
Index
- Default Dashboards
- Create a New Dashboard
- Dashboard Panels
- Panel Templates
- Saving and Restoring Dashboards
- Copying a Dashboard
- Exporting and Sharing Dashboards
- Moving and Deleting Dashboards
- Dashboard Settings
- Time Filter
- Keyboard Shortcuts
- Dashboard Favorites
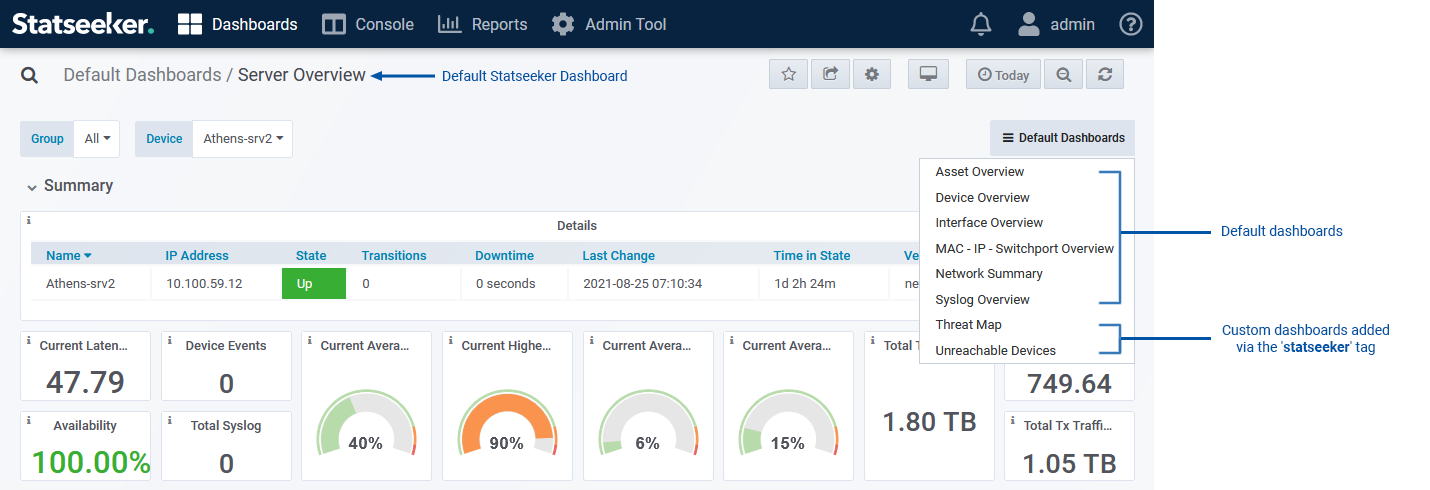
Default Dashboards
Every Statseeker install contains several default dashboards, located in the Default Dashboards folder, available to all users. These non-editable dashboards are created and maintained by Statseeker.
If you would like to edit any aspect of the default dashboards you will need to create an editable copy of the dashboard, see Copying Dashboards for details.
The current default dashboards are:
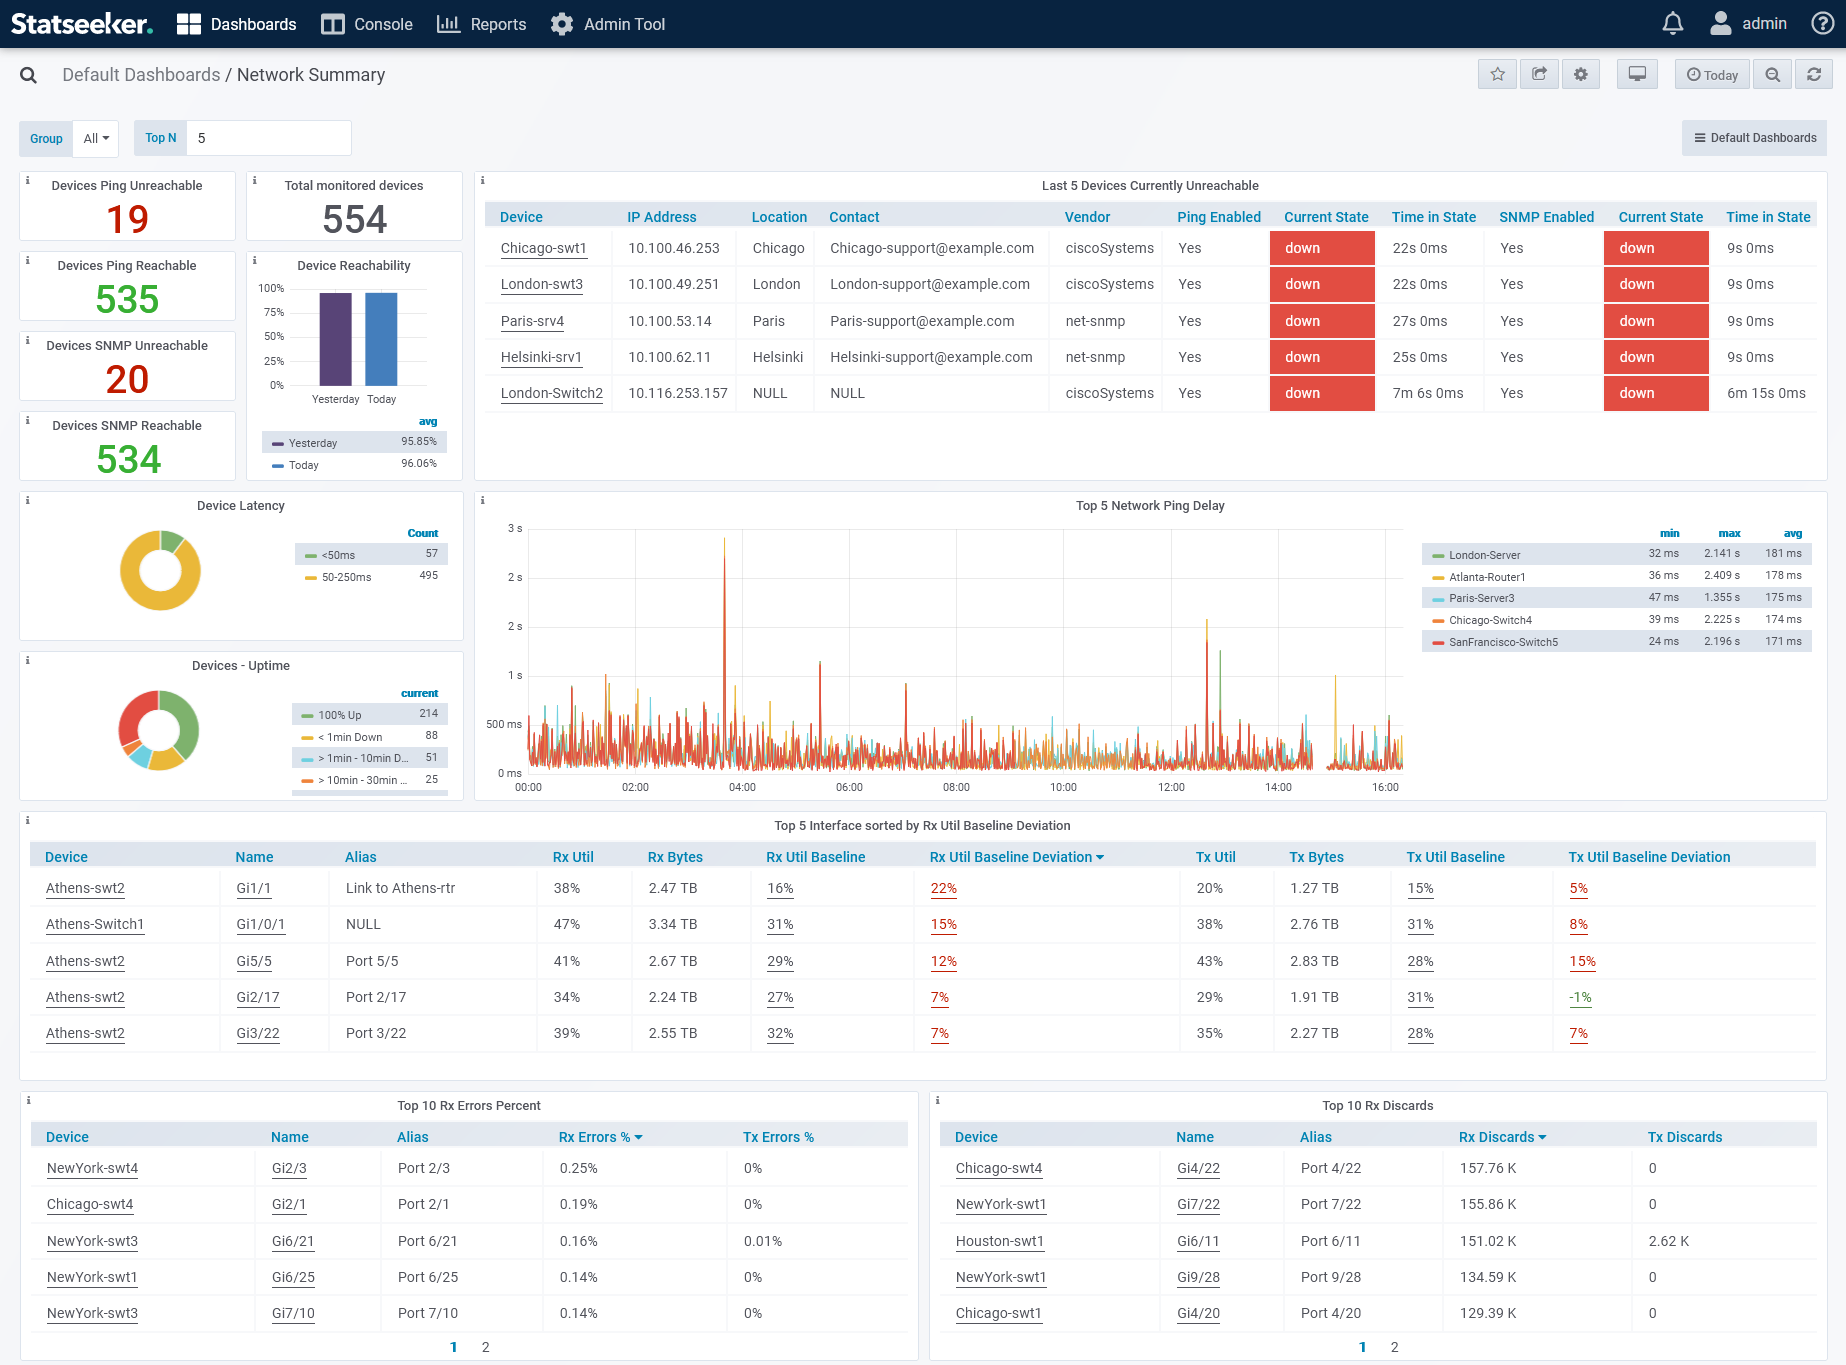
Network Summary
A high level summary of the current state of the network (or subset thereof) with details on down devices and device-level events, ping statistics highlighting latency issues, SNMP communication failures, and identifying potential interface and link congestion. The dashboard features drill-down links to events-based reports, as well as the Device and Interface Overview dashboards
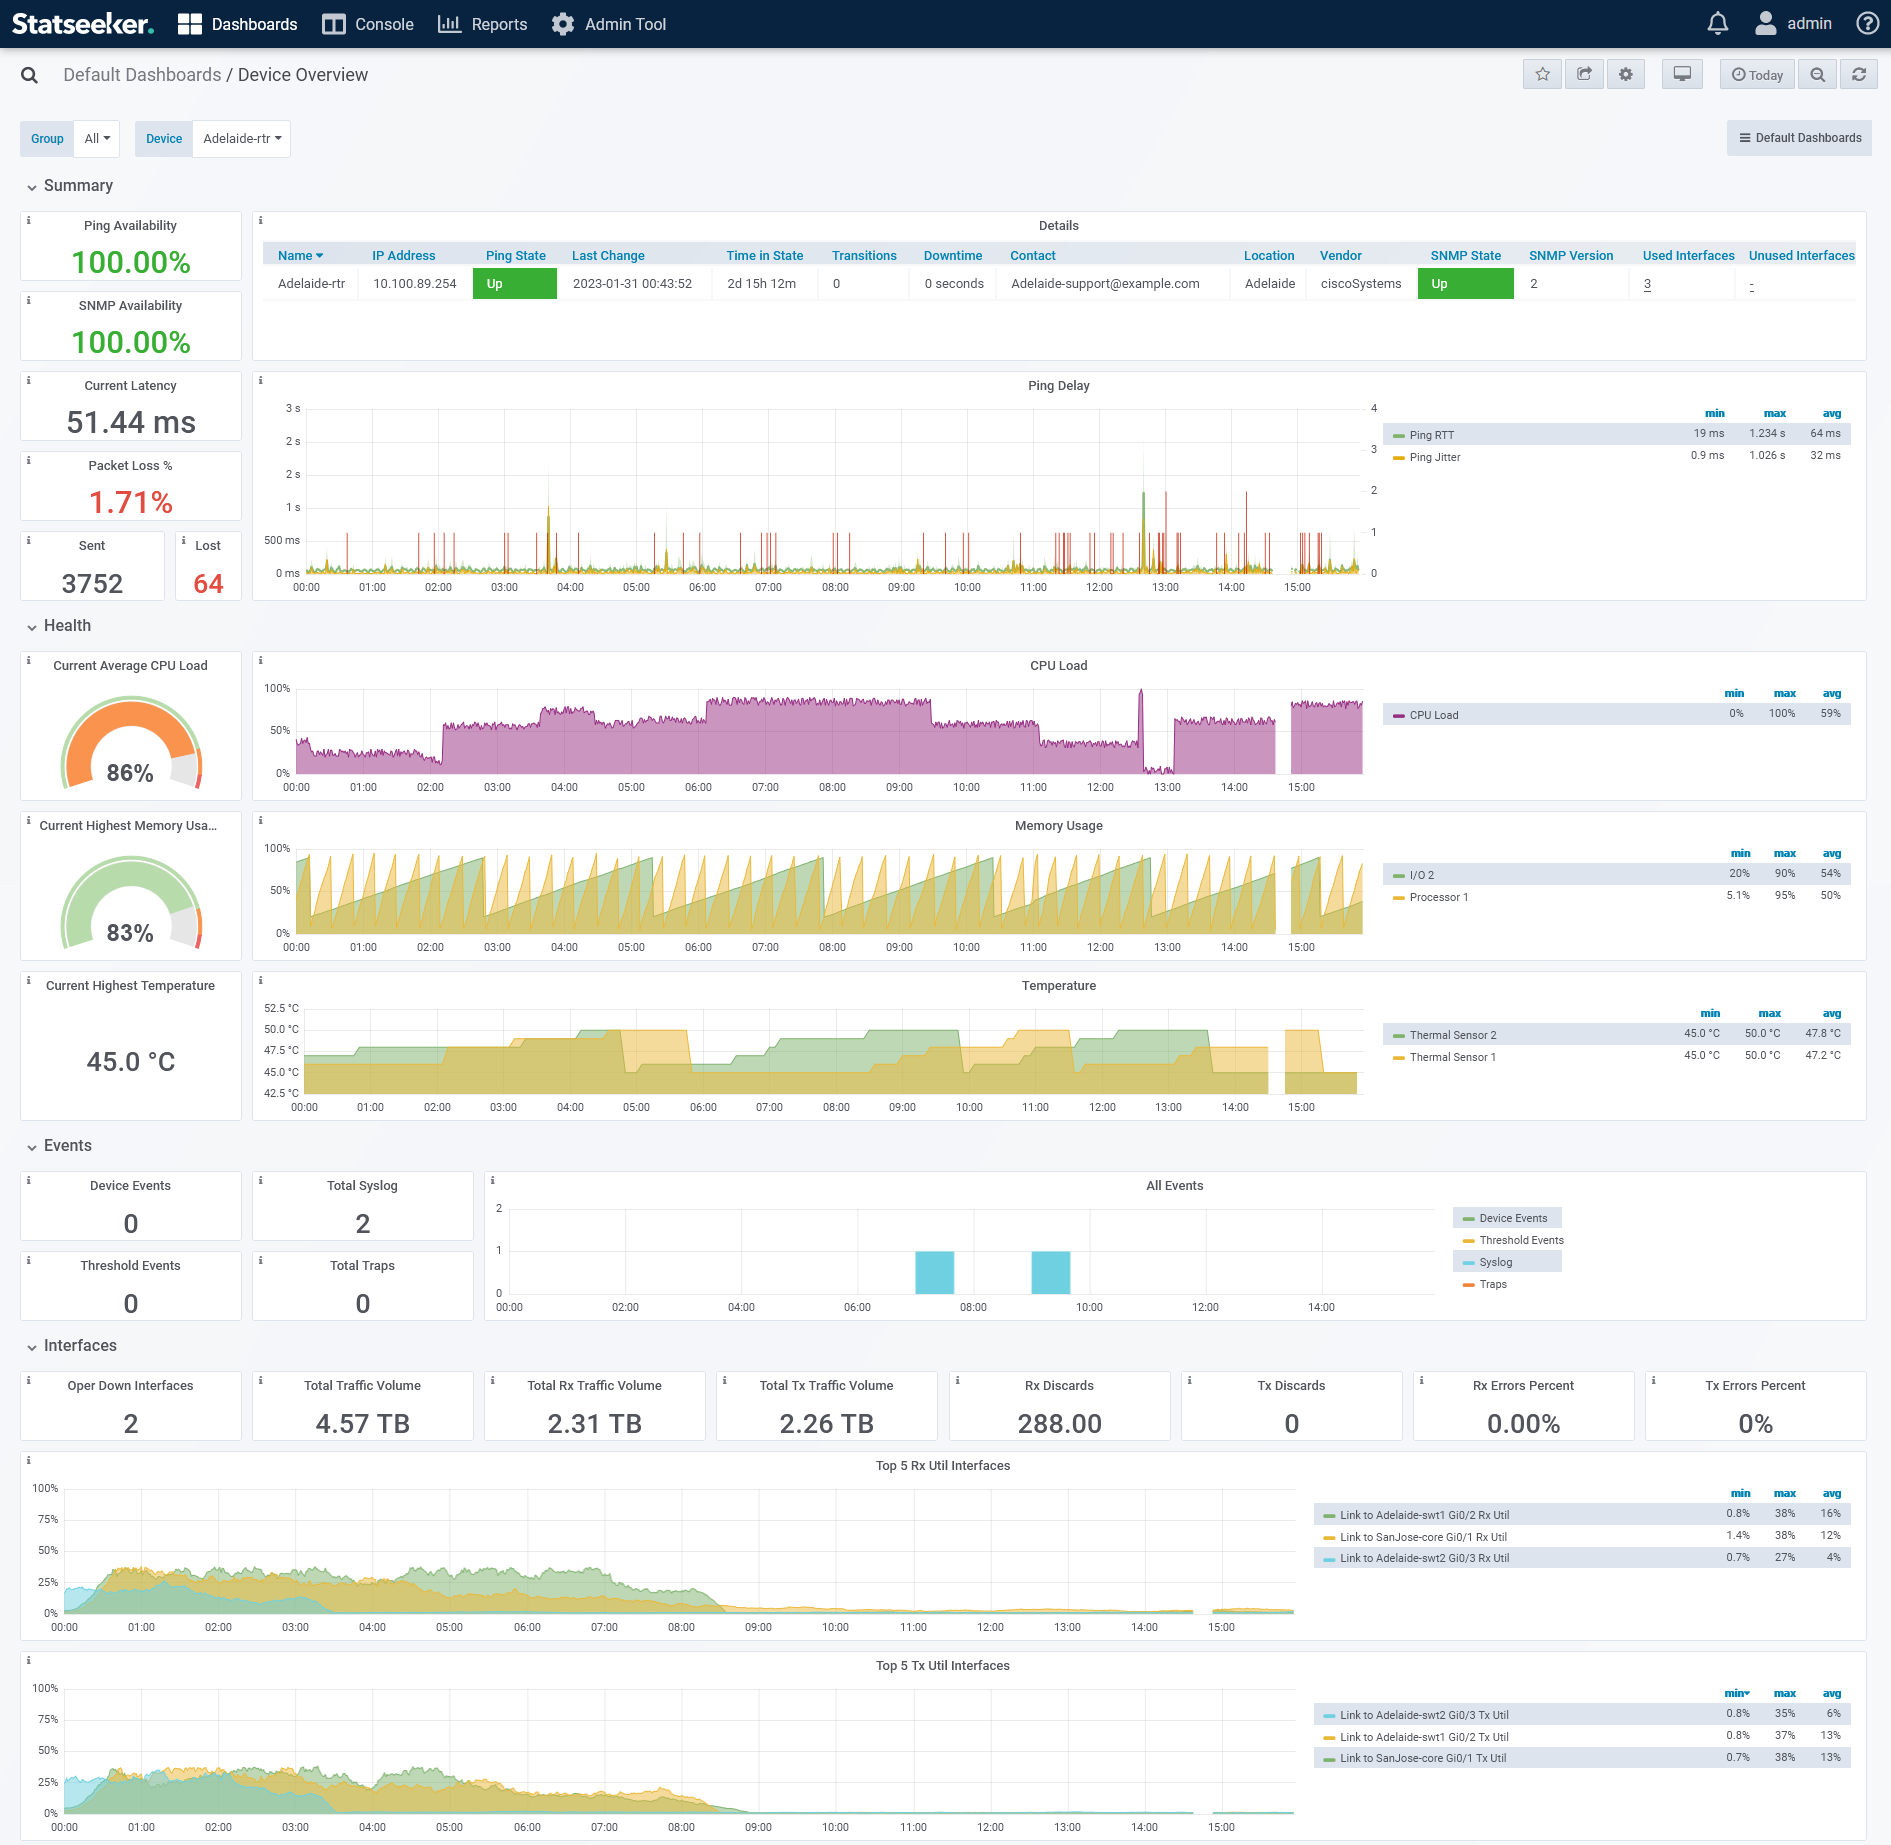
Device Overview
Provides details on a selected device including current ping and SNMP state and availability, latency and packet loss, interface usage and traffic volumes, event records (device events, threshold breaches, syslog and trap messages) and basic device health metrics such as temperature, CPU and memory load. The dashboard features drill-down links to events-based reports, interface utilization baseline reports, and the Interface Overview dashboard.
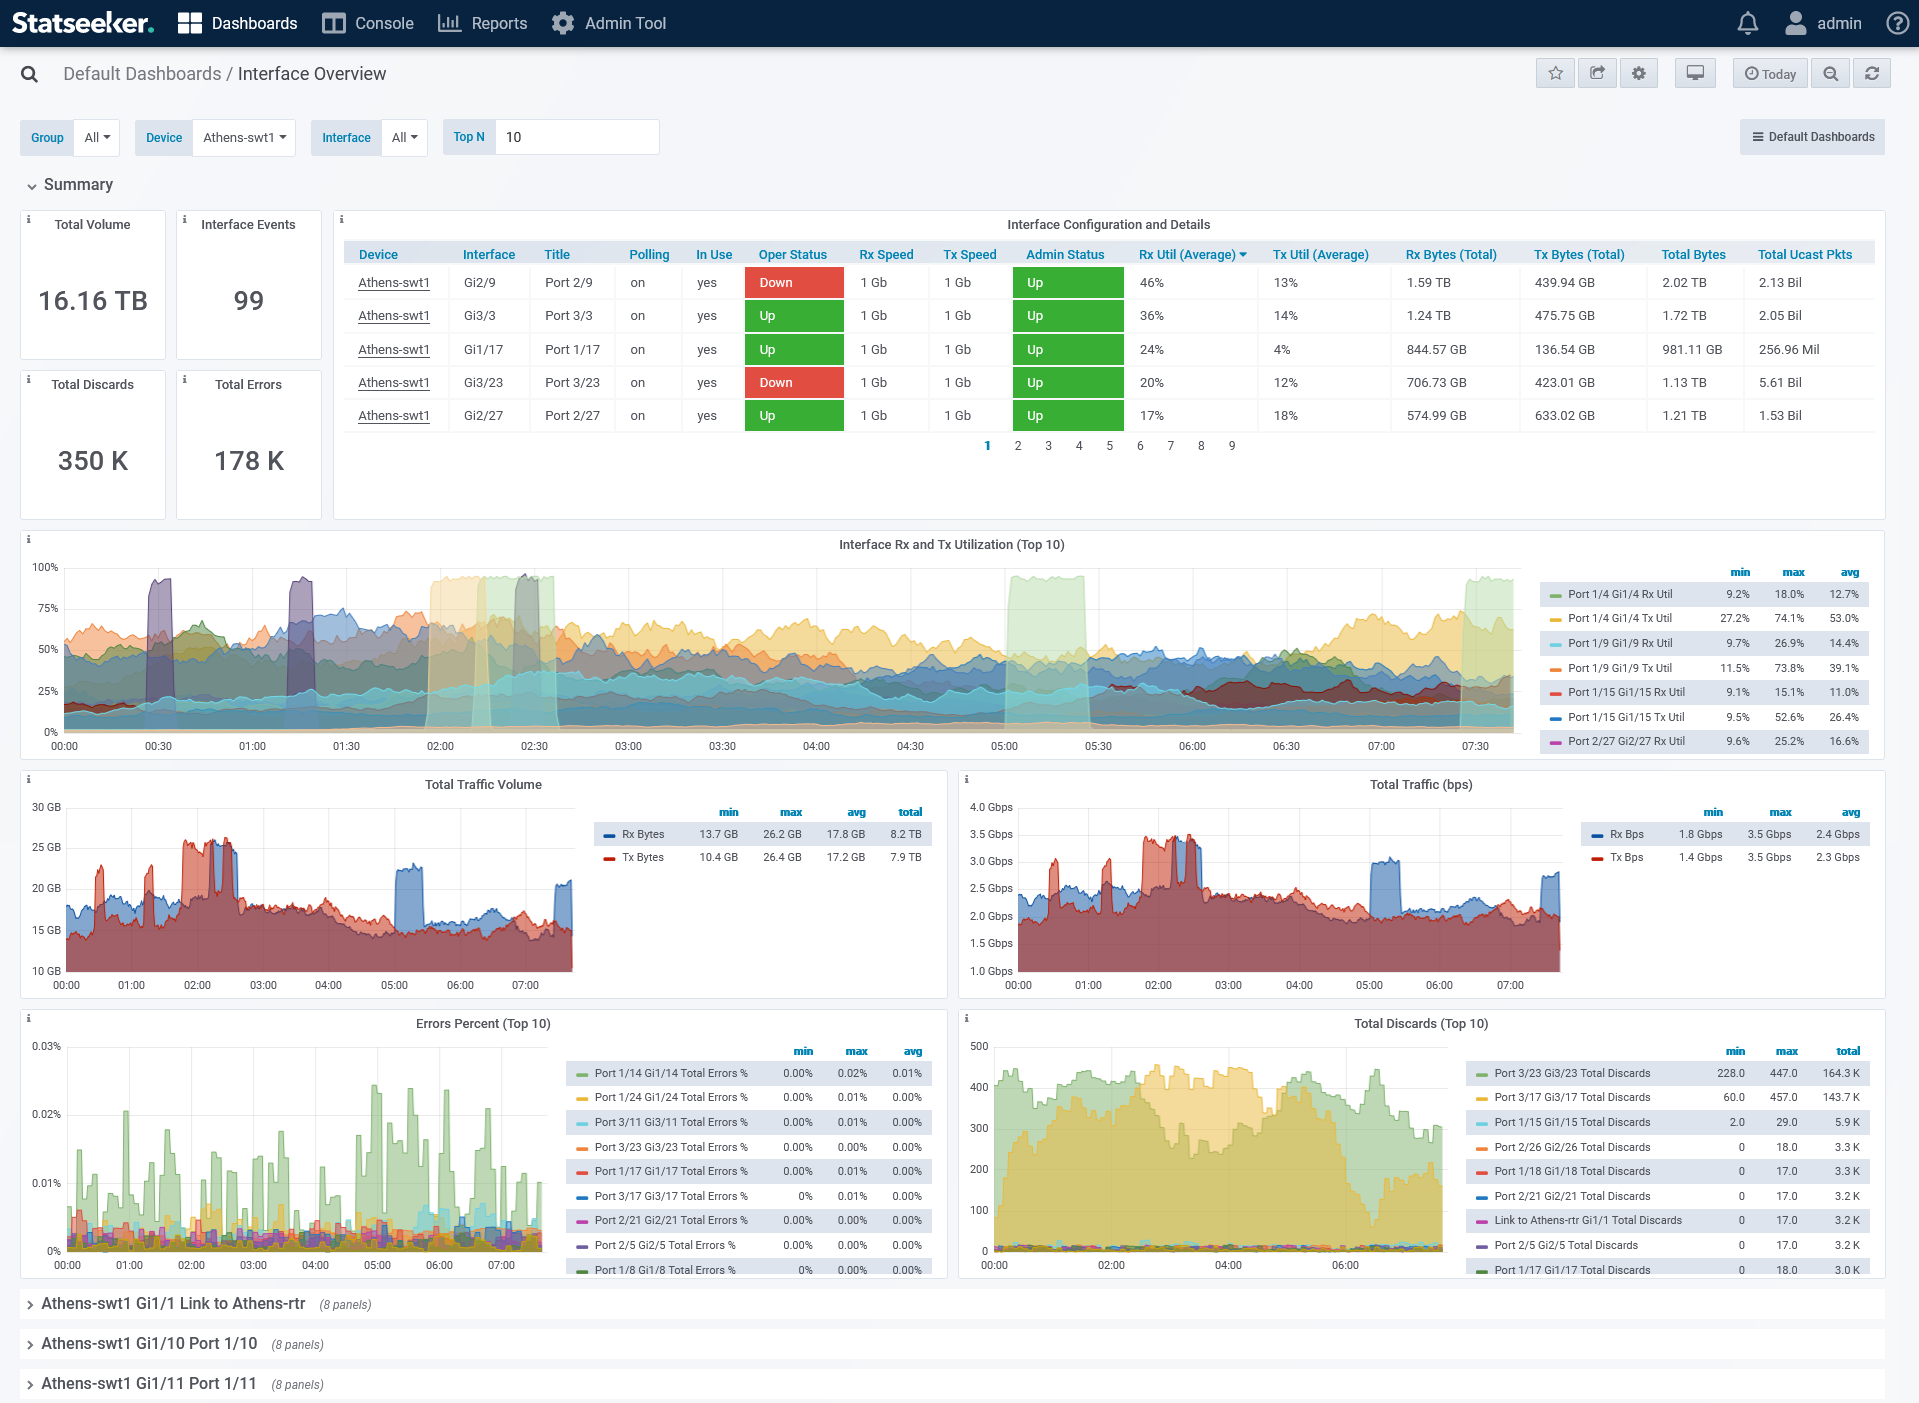
Interface Overview
Offers a detailed look at the interfaces of the selected devices, detailing interface configuration, utilization, traffic volume and rate, and errors and discards. The dashboard also offers links to the Device Overview and drilldowns to an interface events report.
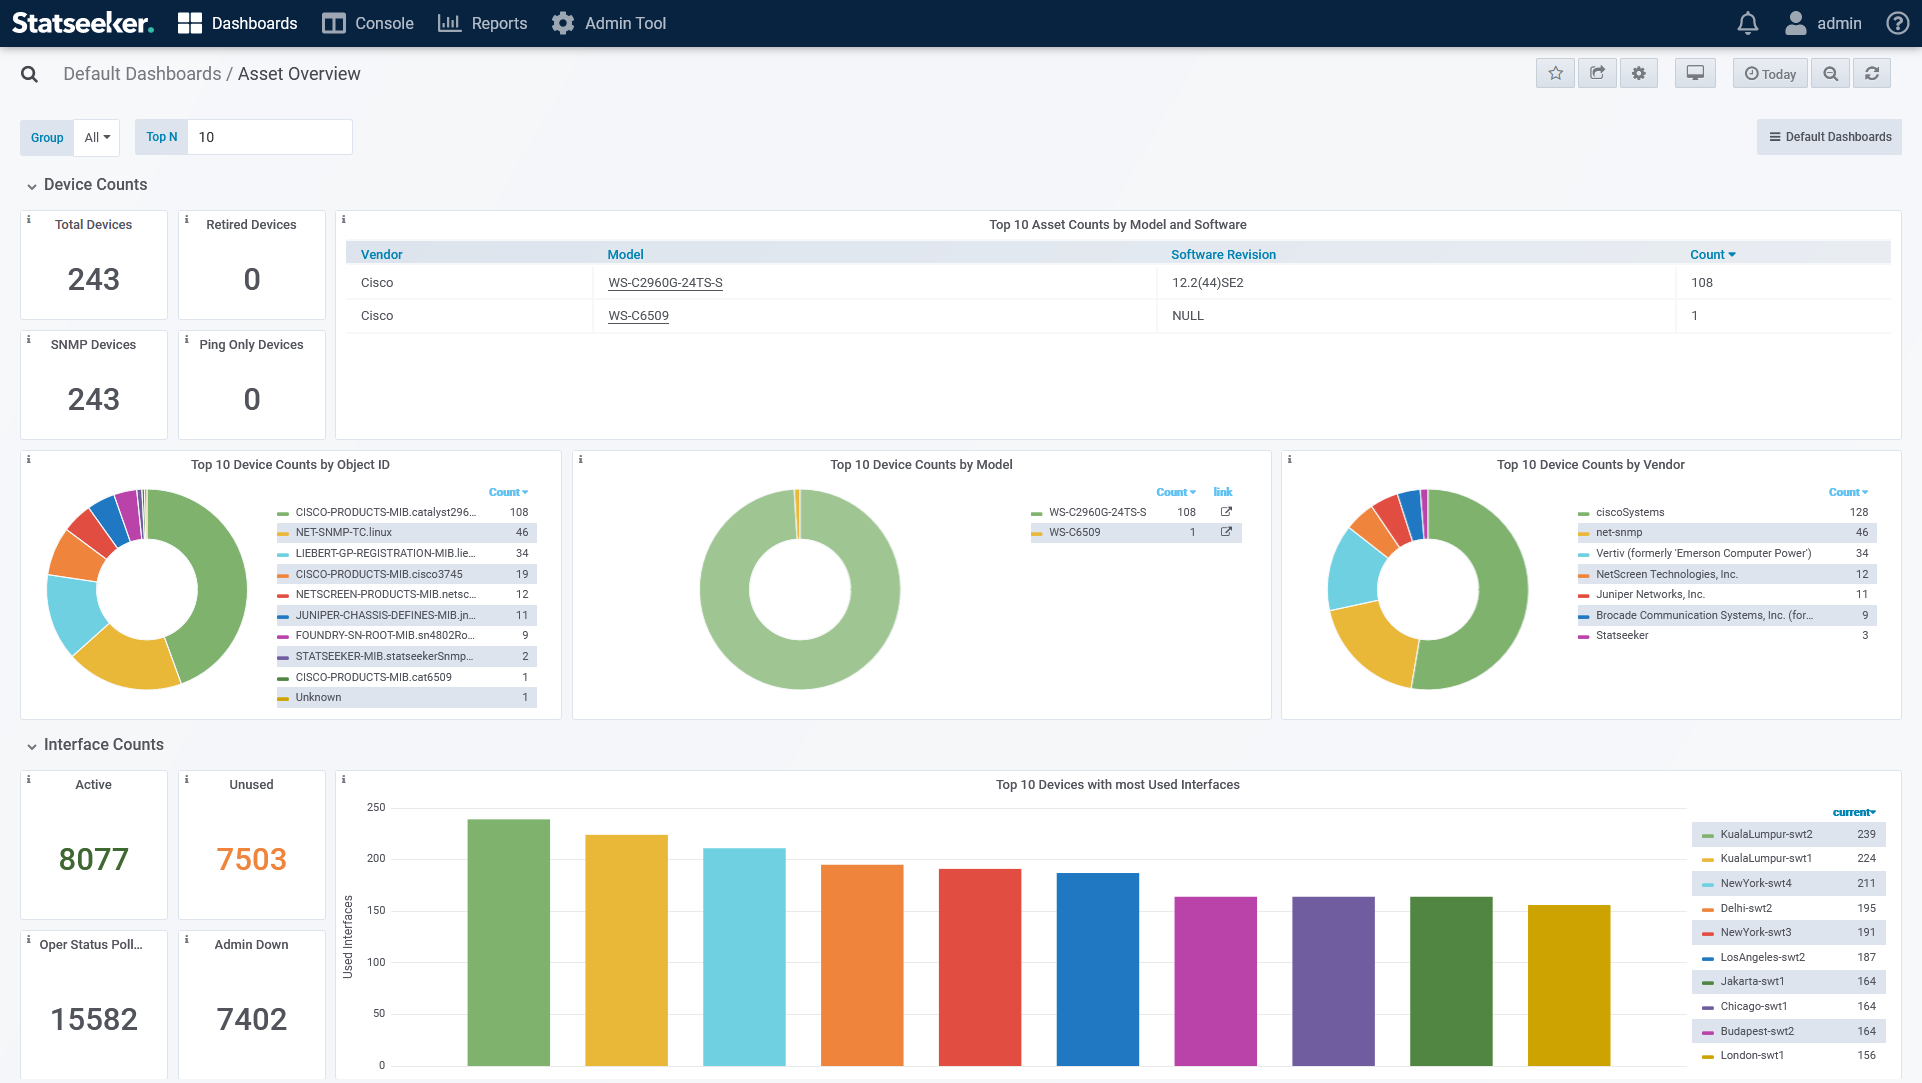
Asset Overview
An overview of the infrastructure makeup of your network, providing details on device and interface counts, MAC/IP configuration, and operational status. Most panels in the dashboard feature drill-down links to breakdowns of this data.
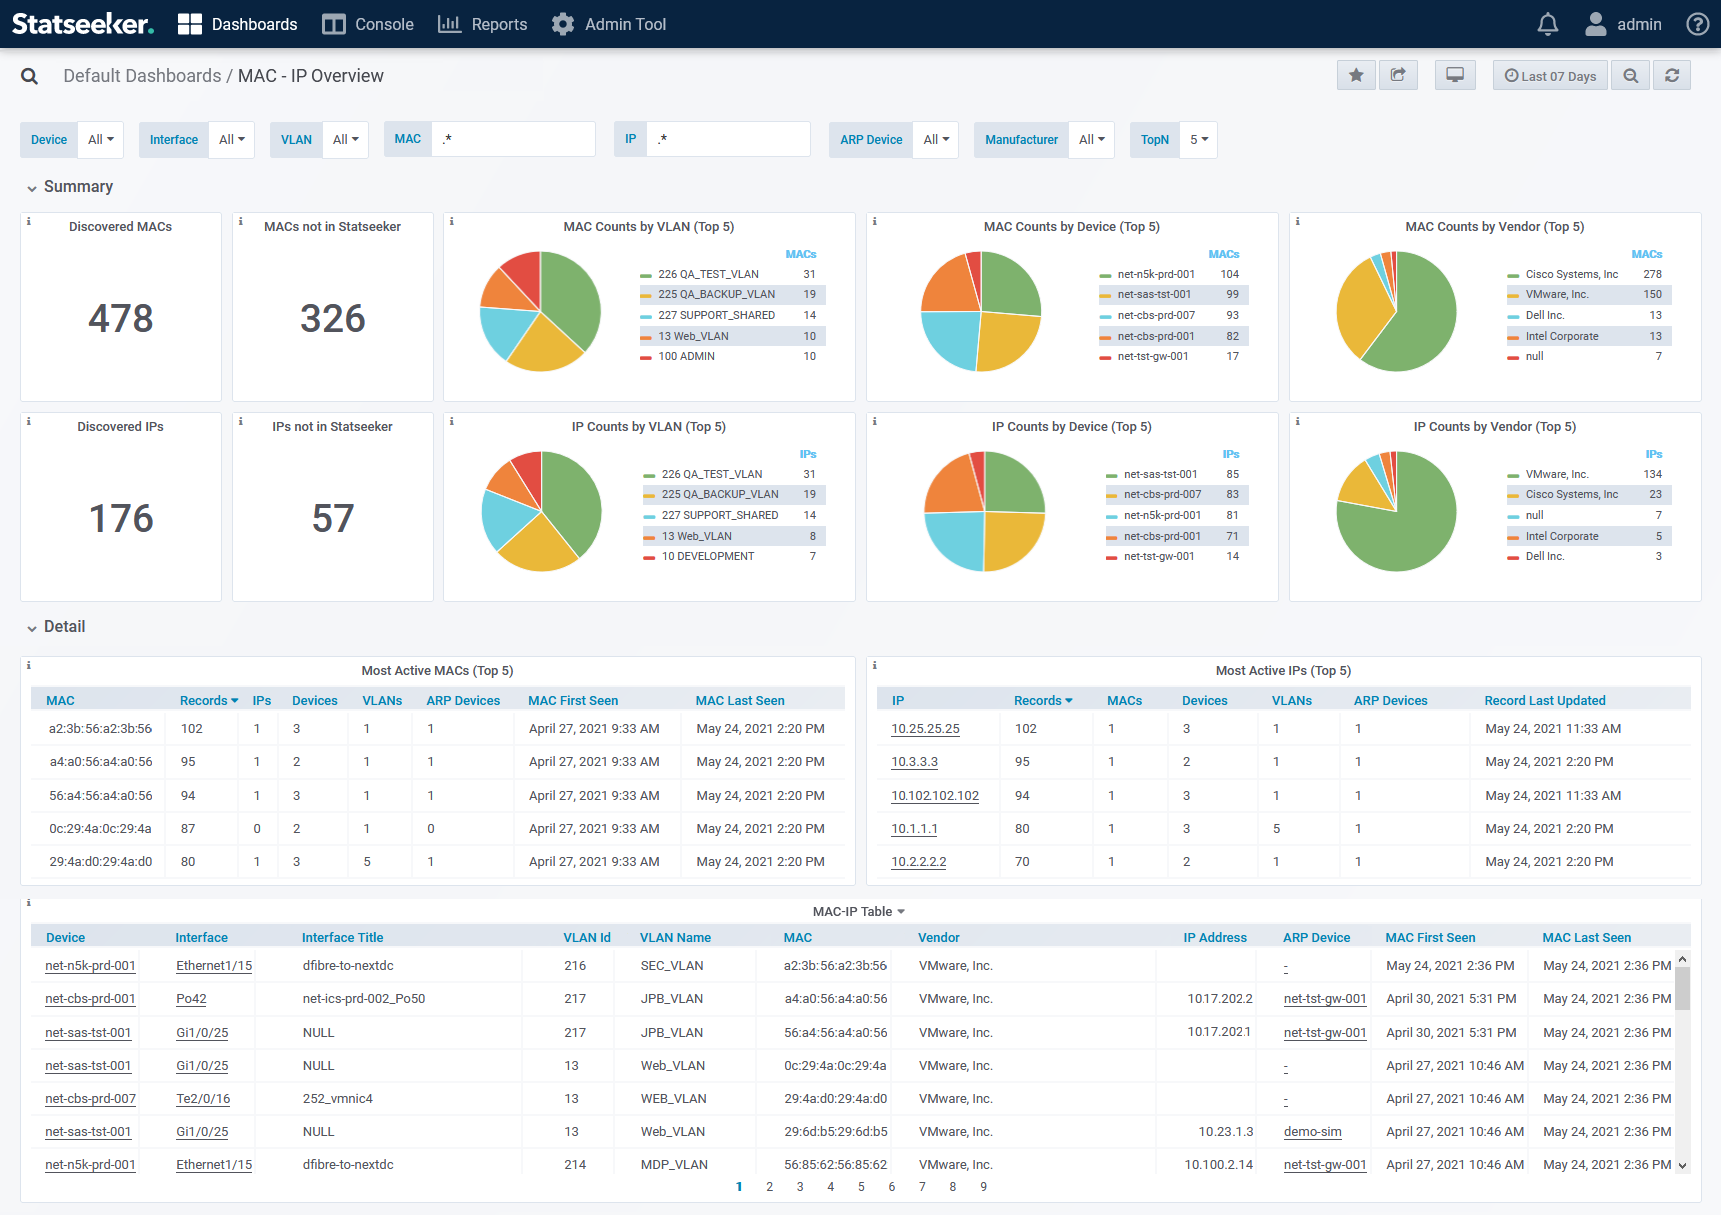
MAC-IP Overview
An overview of the network’s MAC-IP configuration with breakdowns by VLAN, device, interface, and ARP Router
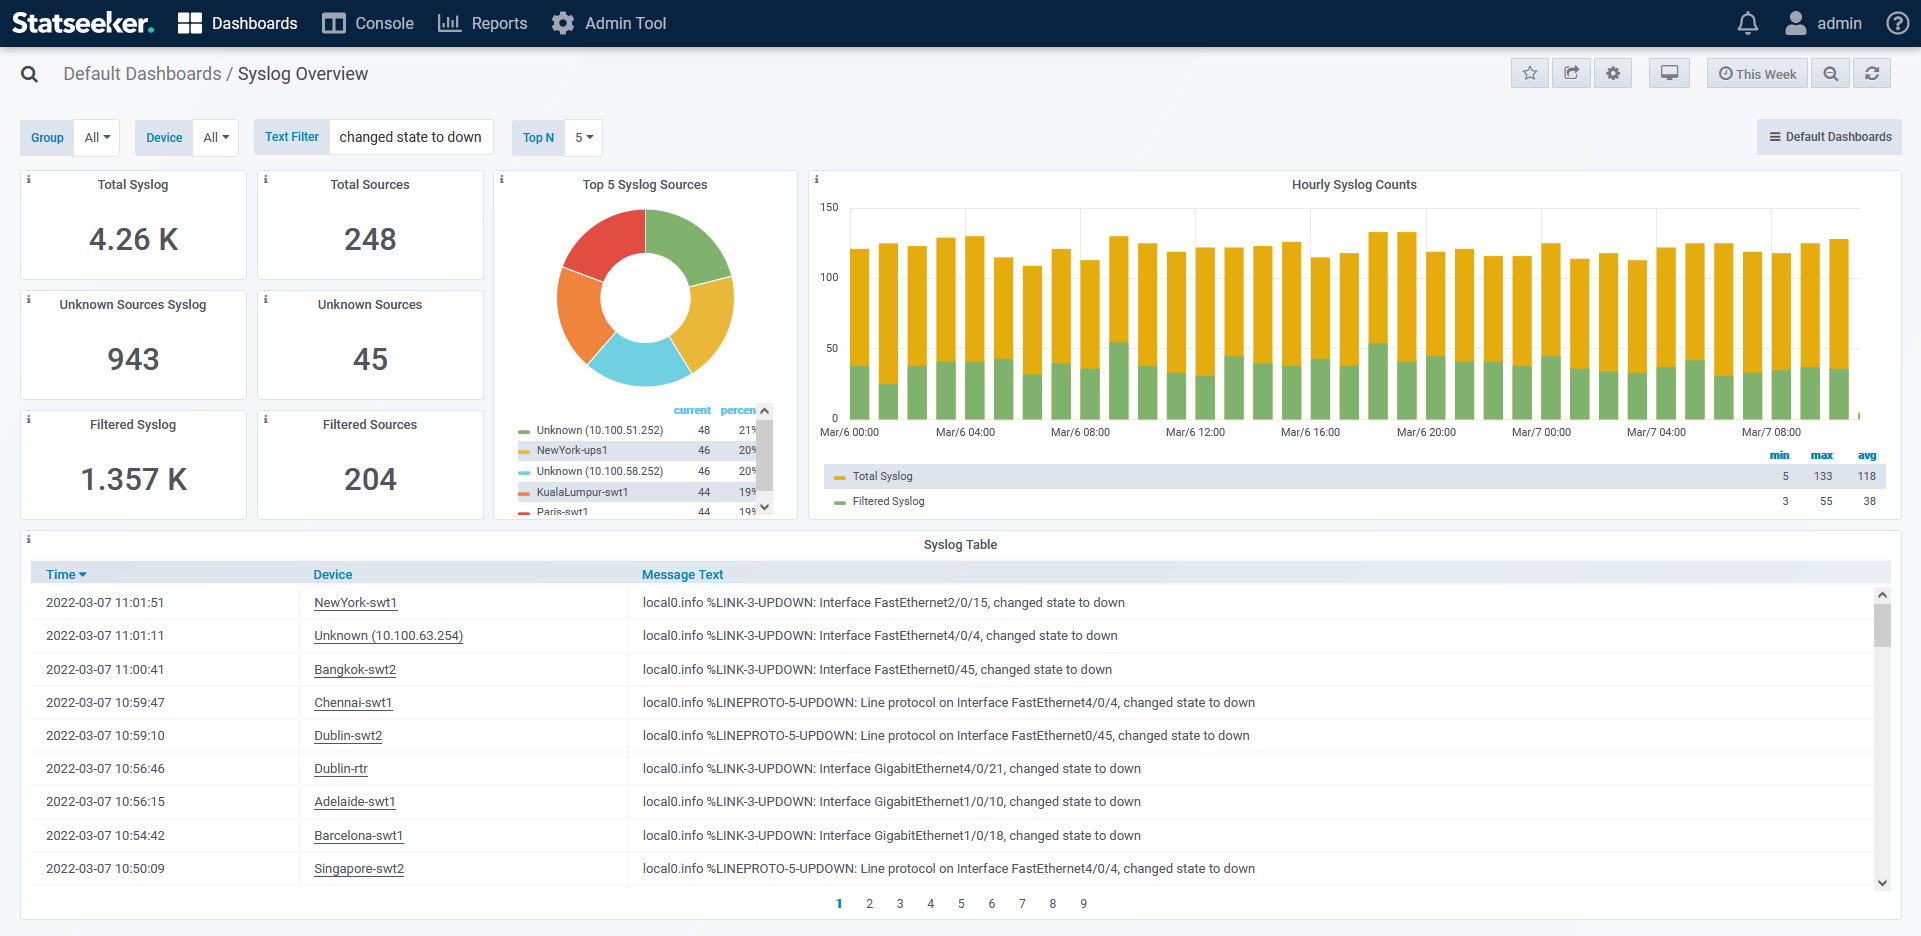
Syslog Overview
Syslog counts and message details broken down by group, device, and source. The dashboard features drill-down links to detailed syslog reports, and the Device Overview dashboard.
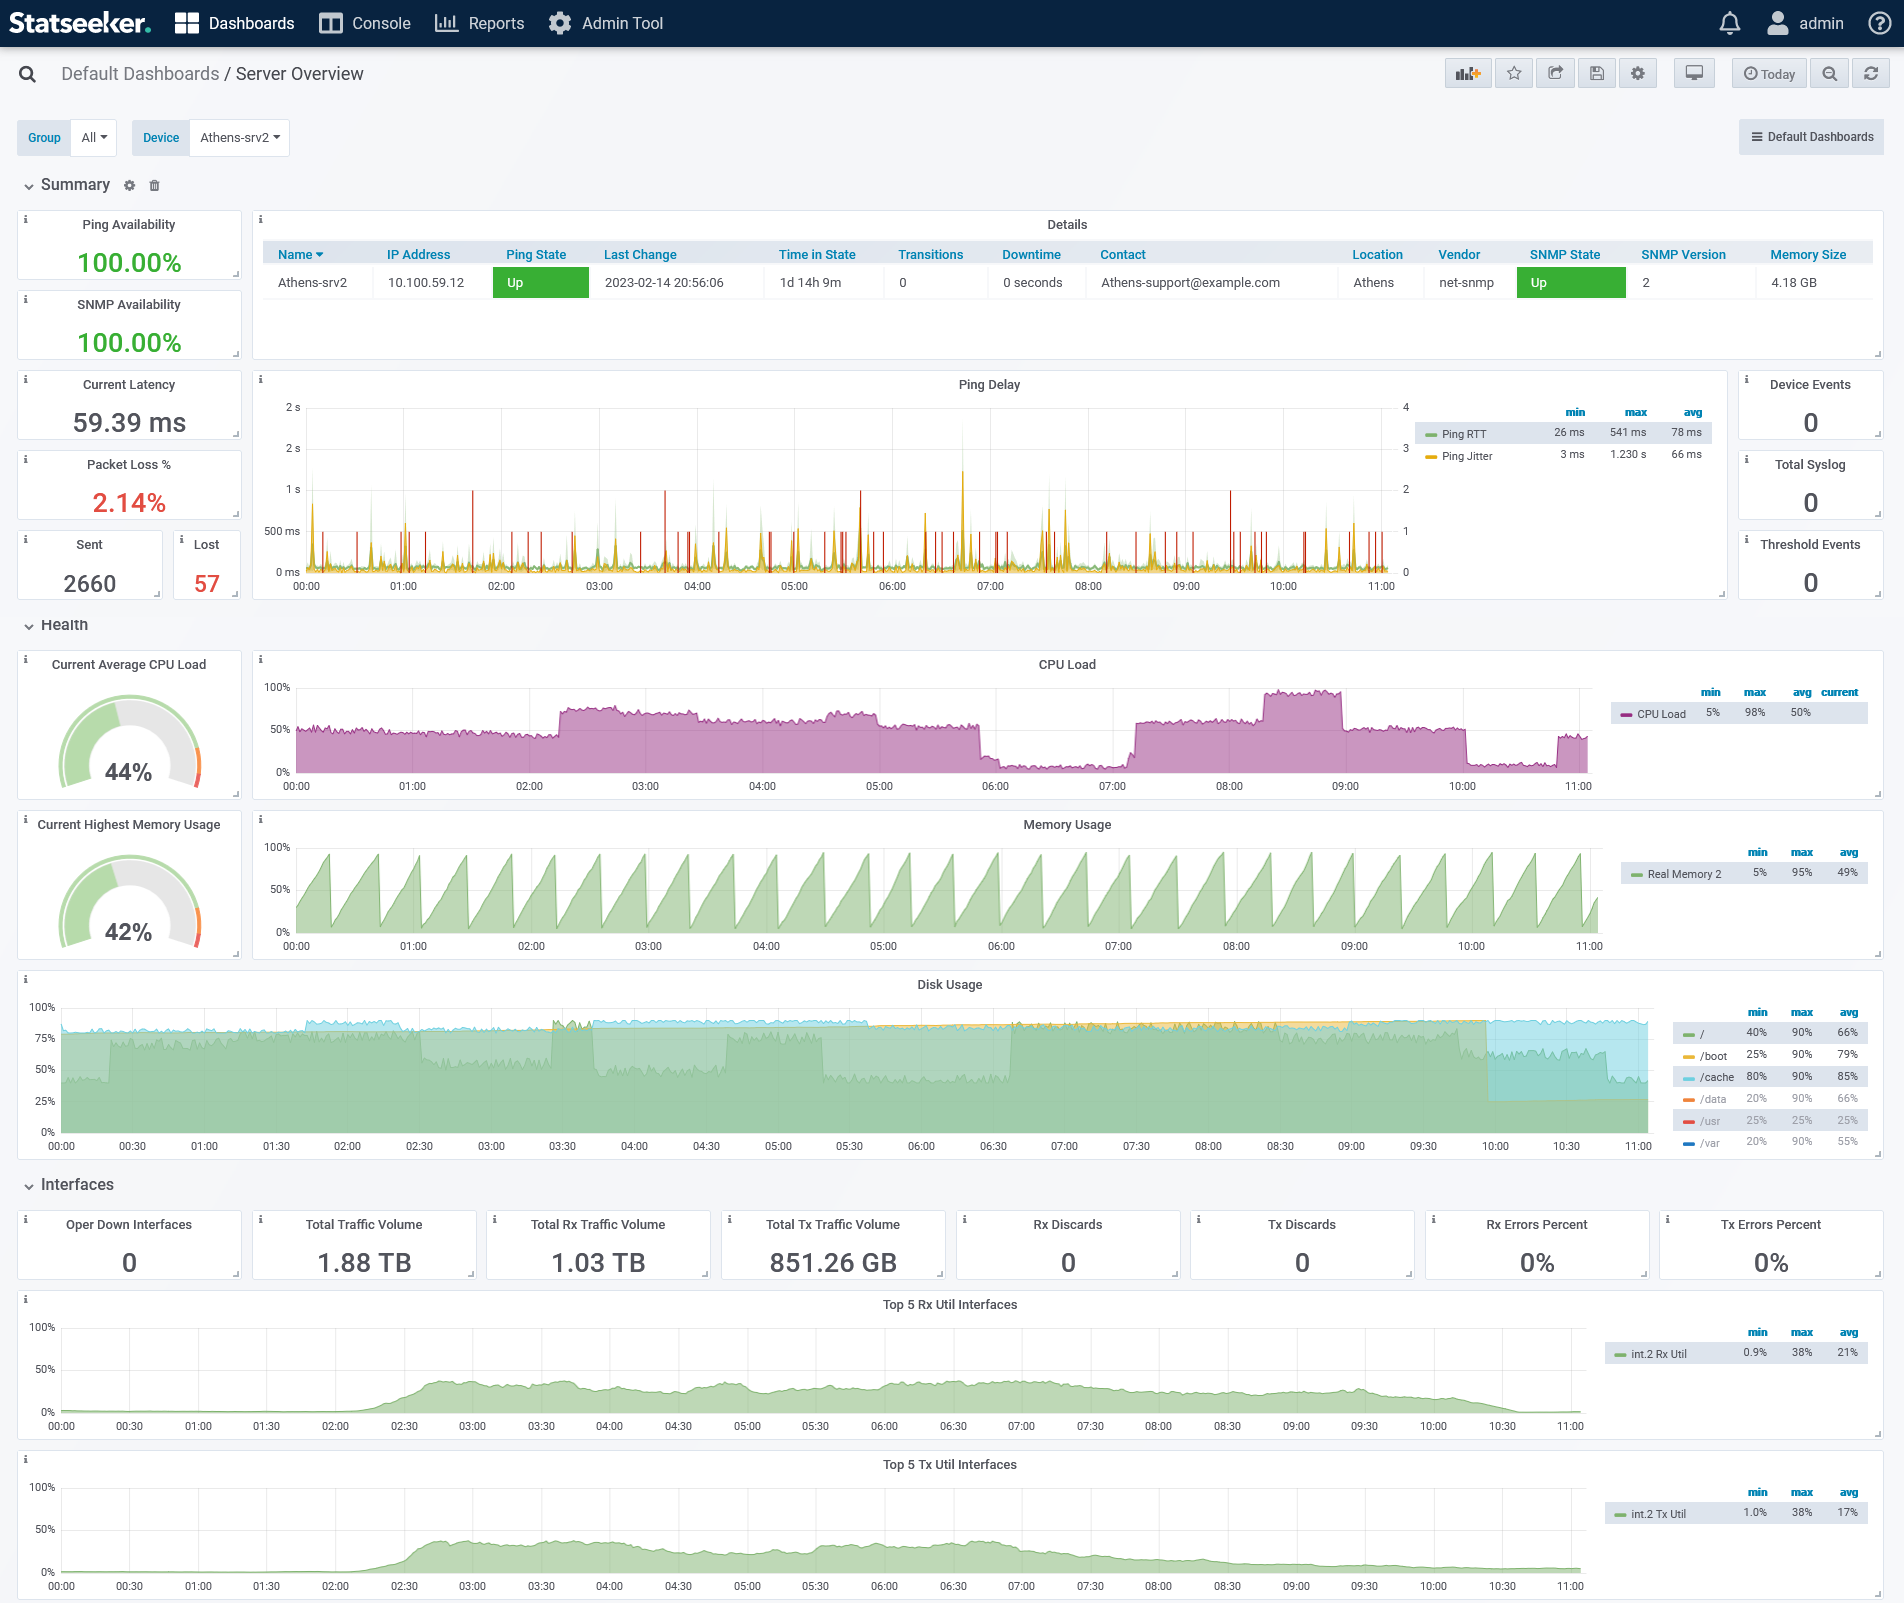
Server Overview
A single device overview providing current state and availability (ping/SNMP) and historical records for a range of server health metrics including ping, CPU load, memory and disk usage, traffic volumes, as well as event and outgoing syslog counts. The dashboard features drill-down links to detailed device event (ping/SNMP), threshold breaches, and syslog reports, and the Interface Overview dashboard.
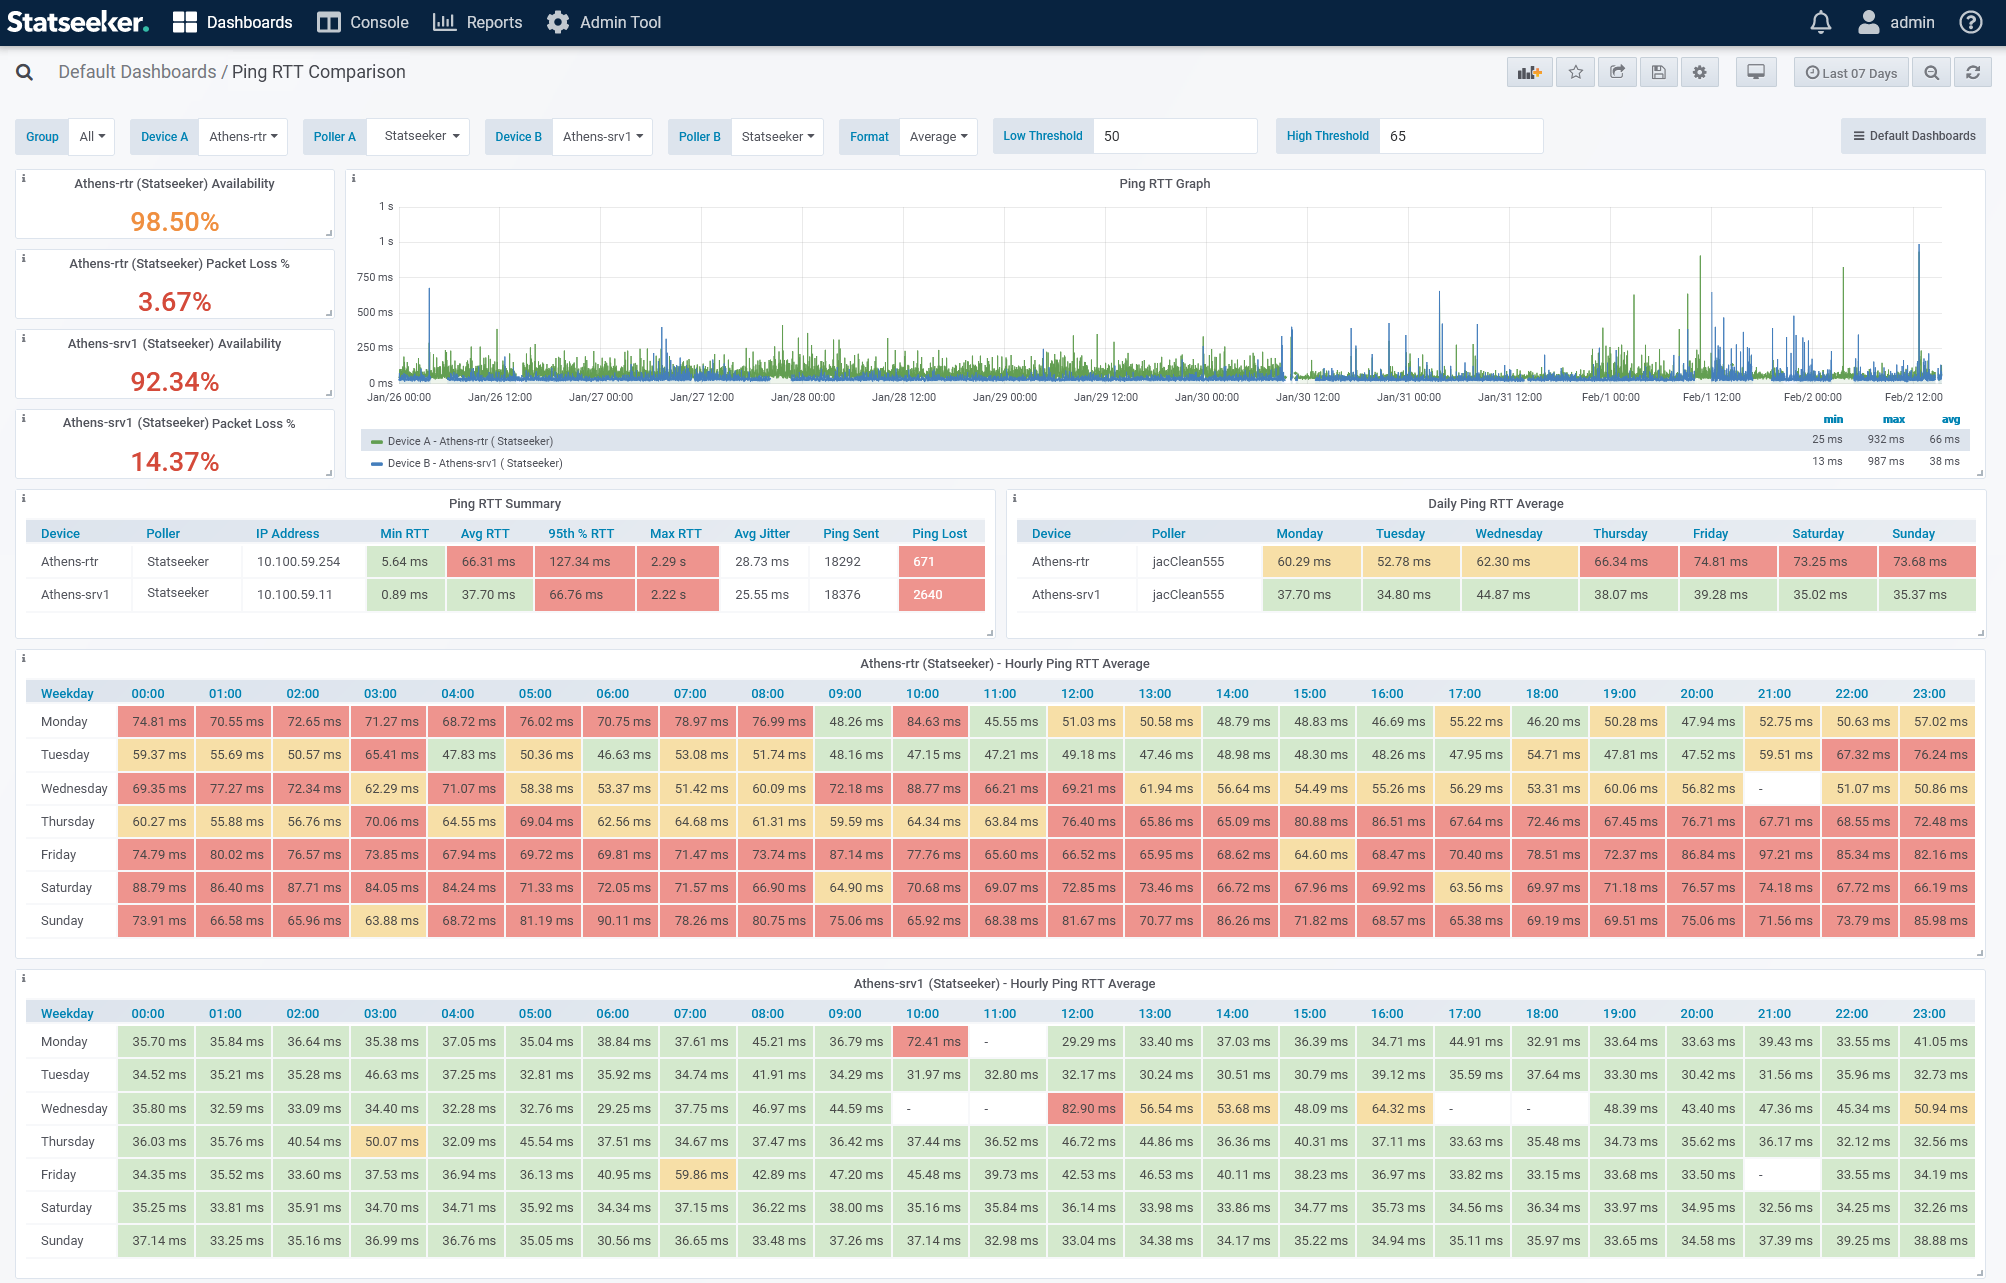
Ping RTT Comparison
Offers a detailed view into the historical Ping data for a device, directly compare that data across two devices, or compare ping data for a single device collected from various polling locations across the network. The dashboard features:
- Variable driven coloring rules – dynamically assign threshold values to suit the specific devices being reviewed in the dashboard and have the data colored according to those values
- Drilldowns to historical ping-outage data
Statseeker Server Diagnostic Dashboards
The Statseeker server monitors performance and health metrics for itself and all deployed Observability Appliances, presenting this data in two additional default dashboards. These dashboards are intended to assist Statseeker Support when investigating issues relating to the server and Observability Appliances.
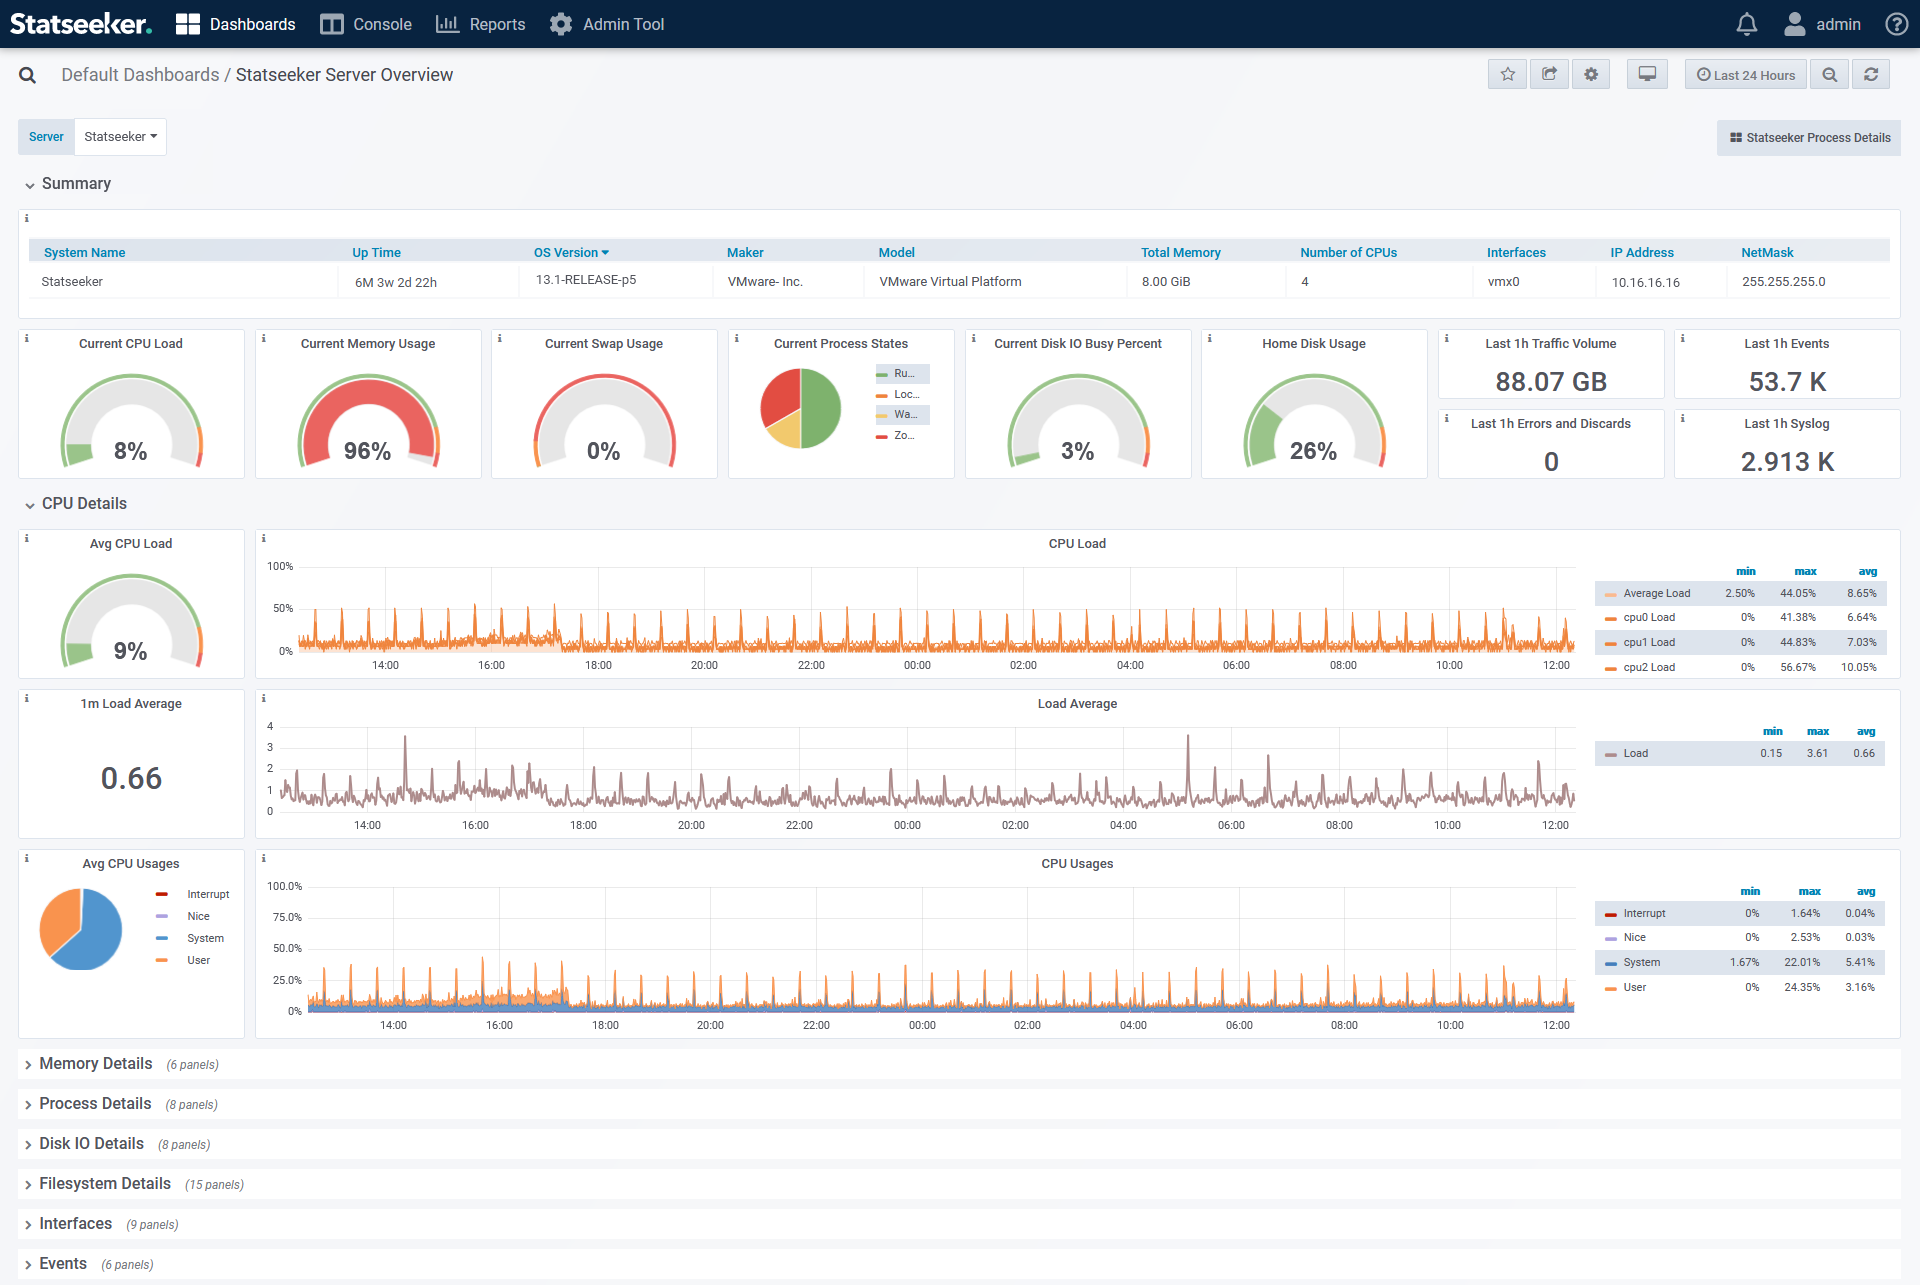
Statseeker Server Overview
This dashboard requires the Admin role to view and is accessed via Administration:
- Select Administration > Statseeker Administration > System Overview
Server/Observability Appliance configuration and health details: CPU, Memory and Disk usage, process states. Intended for diagnostic purposes by Statseeker Support.
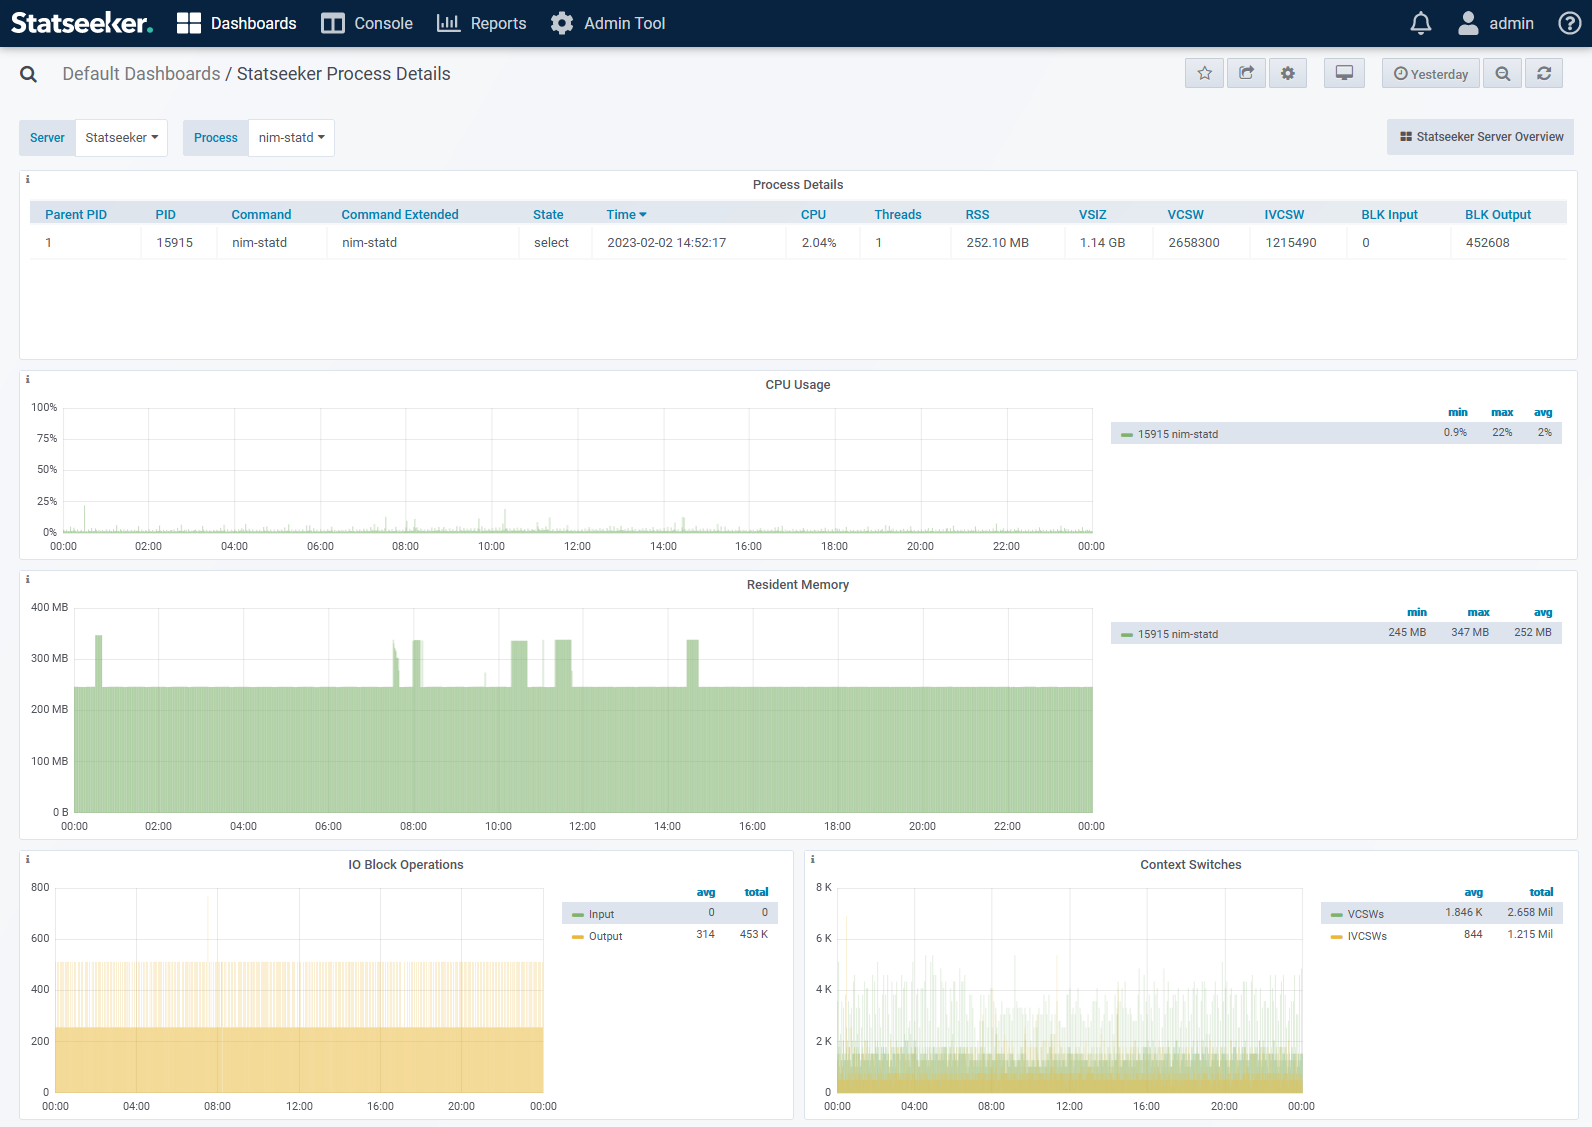
Statseeker Processes
This dashboard requires the Admin role to view and is accessed via Administration:
- Select Administration > Statseeker Administration > Process Details
Performance details on the various process currently running on the server/Observability Appliance. Intended for diagnostic purposes by Statseeker Support.
Meraki Dashboards
If Meraki Monitoring is also licensed on the server, then an additional range of default dashboards will be located in the Default Meraki Dashboards folder. These dashboards have the same editing restrictions as those found in the Default Dashboards folder. For details on this functionality see:
Cisco ACI Dashboards
If Cisco ACI Monitoring is also licensed on the server, then an additional range of default dashboards will be located in the Default ACI Dashboards folder. These dashboards have the same editing restrictions as those found in the Default Dashboards folder. For details on this functionality see:
Create a New Dashboard
To create a new dashboard:
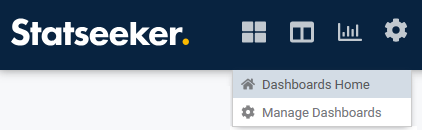
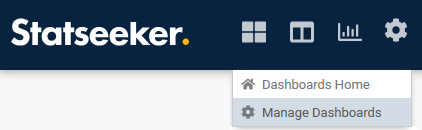
- Select Dashboards > Dashboards Home from the main navigator
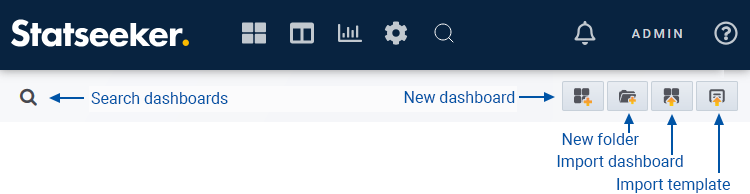
- Click the new dashboard icon
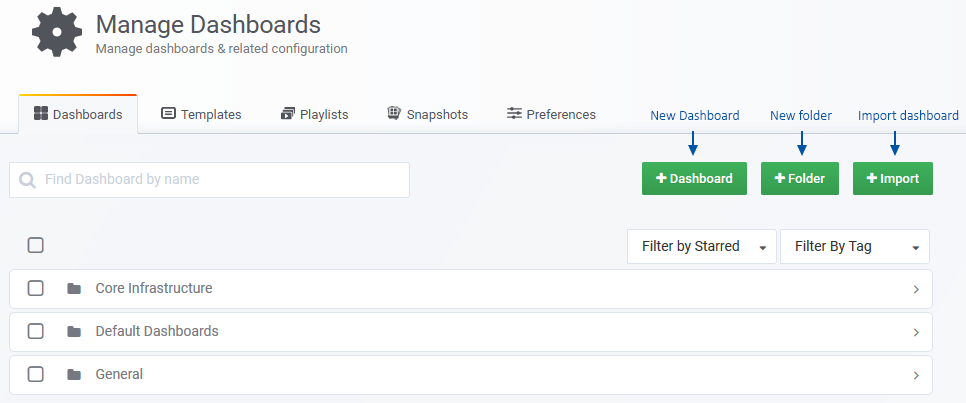
Dashboards can also be created from within the Dashboard Manager:
- Select Dashboards > Dashboard Manager from the main navigator
- Click the new dashboard button
Once a new dashboard has been created:
- Add and configure dashboard panels as needed and Save the dashboard when done.
Importing Dashboards
Importing dashboards allows you to create a new dashboard from the configuration file of an existing dashboard. Importing can be achieved from either the Dashboard Manager, or from the Dashboard Home page. To import a dashboard from Dashboard Home:
- Click the import dashboard icon
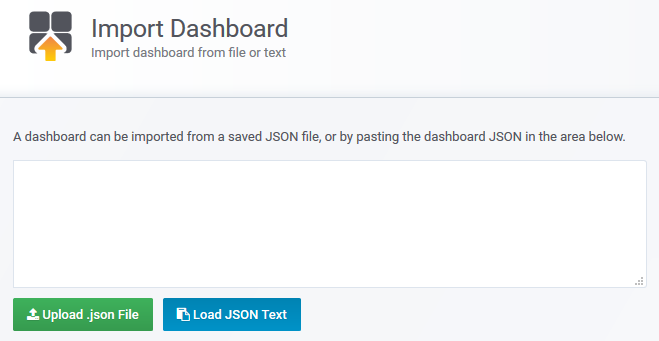
- If you saved the dashboard configuration to file, click Upload .json file and select the saved file
- If you saved the dashboard configuration to the clipboard, paste the config into the import panel and click Load JSON Text
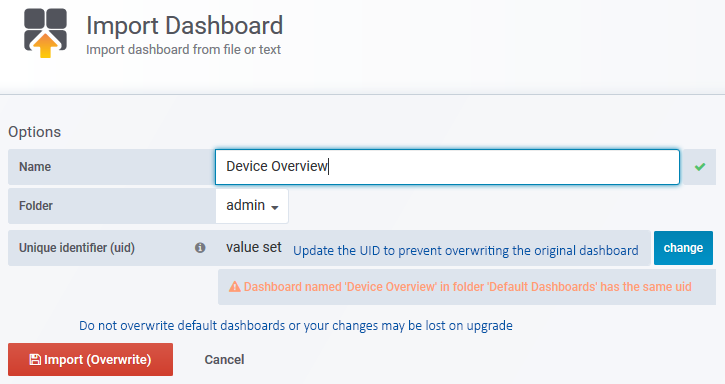
- Update the dashboard name
- Set the folder to house the new dashboard
- Update the UID – failure to do so will result in the original dashboard being overwritten
If you are importing a copy of one of the default dashboards, then it will be flagged as non-editable. To resolve this:
- Click the
 icon in the top-right of the dashboard to open dashboard settings
 - Click Make Editable and save the dashboard
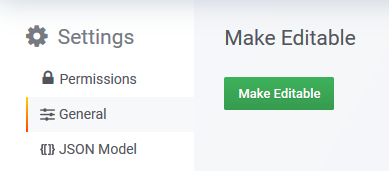
The copy of the default dashboard is now editable and can be tailored to your needs.
Dashboard Panels
Dashboards consist of one or more panels, each panel providing one of:
- A view into your Statseeker data
- Static text
- HTML content
- A clock
- A dashboard layout element
Statseeker offers a range of panel types:
- Graph – a graph or one or more monitored metrics
- Singlestat – a single summary value for a data series (min, max, average, sum, etc.), which can optionally be represented as a gauge
- Table – a data table
- Pie Chart – can be used to present timeseries, configuration or asset data
- Worldmap – display data related to geographical locations on a configurable background
- Image Map – place nodes and links and configure to display configuration, state or timeseries data, optionally overlay the nodes/link on a custom image background
- Text/HTML – static or variable driven text, can also contain imported content such as Statseeker reports or 3rd-party web content
- Clock – display time in selected timezone or configure a countdown to a specified deadline
- Row – a collapsible row used to manage panel layout within your dashboard
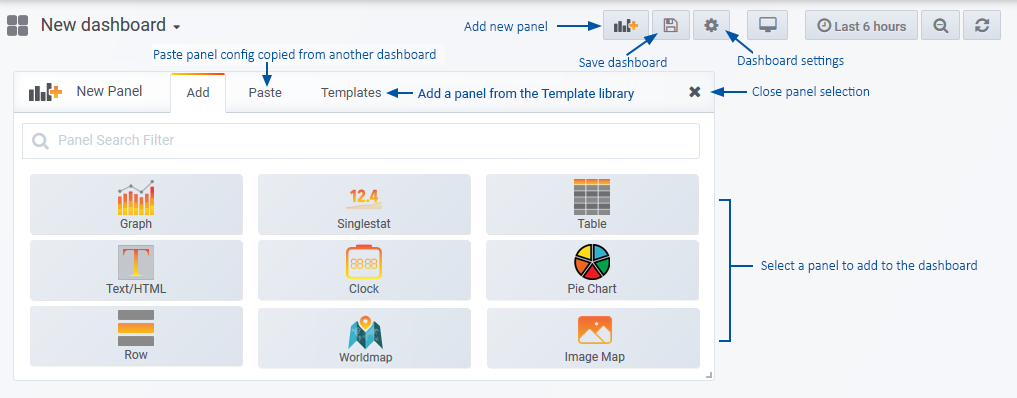
Adding Panels
To add a panel to a dashboard:
- Click the Add Panel icon form the top-right of the dashboard
- Select the panel type to be added
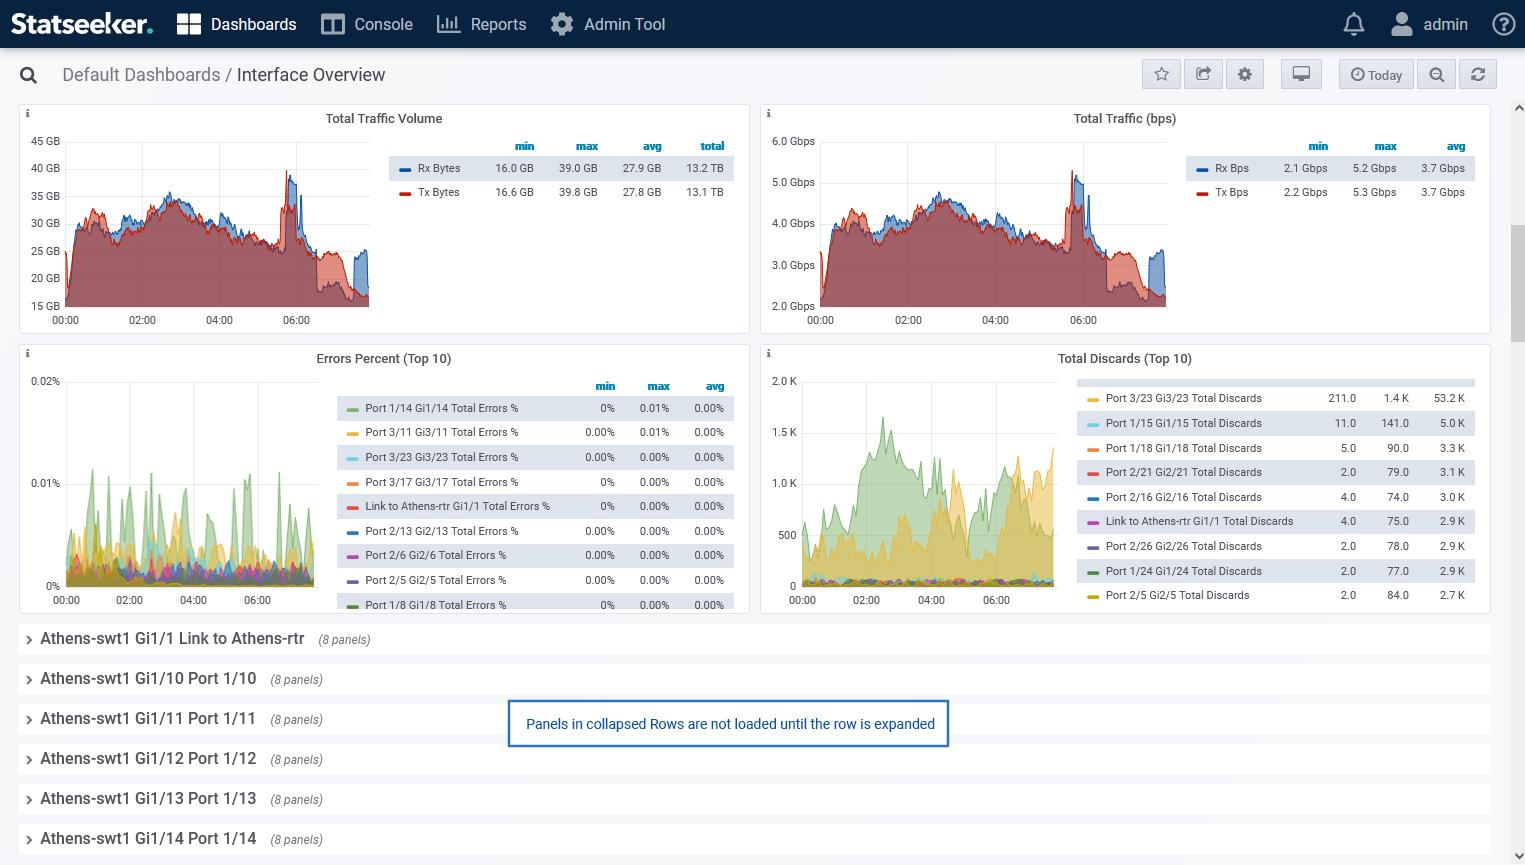
A dashboard can hold any number of panels but do consider the use of Row panels to manage content within dashboards containing a large number of panels. When a dashboard is opened, an API query is sent to your Statseeker server for each panel in the dashboard. These queries are handled sequentially in a first-come-first-served manner and dashboards containing many panels, or panels which request large amounts of data that must be sorted for presentation can take time to fully load.
Panels residing within collapsed panel rows do not send queries (and are not populated with data) until the row is expanded. This feature can be used to ensure critical panels are loaded promptly and less critical panels can be accessed on demand by expanding their parent row.
Moving and Resizing Panels
- Click and drag the panel header to move a panel
- Click and drag the bottom-right corner to resize a panel
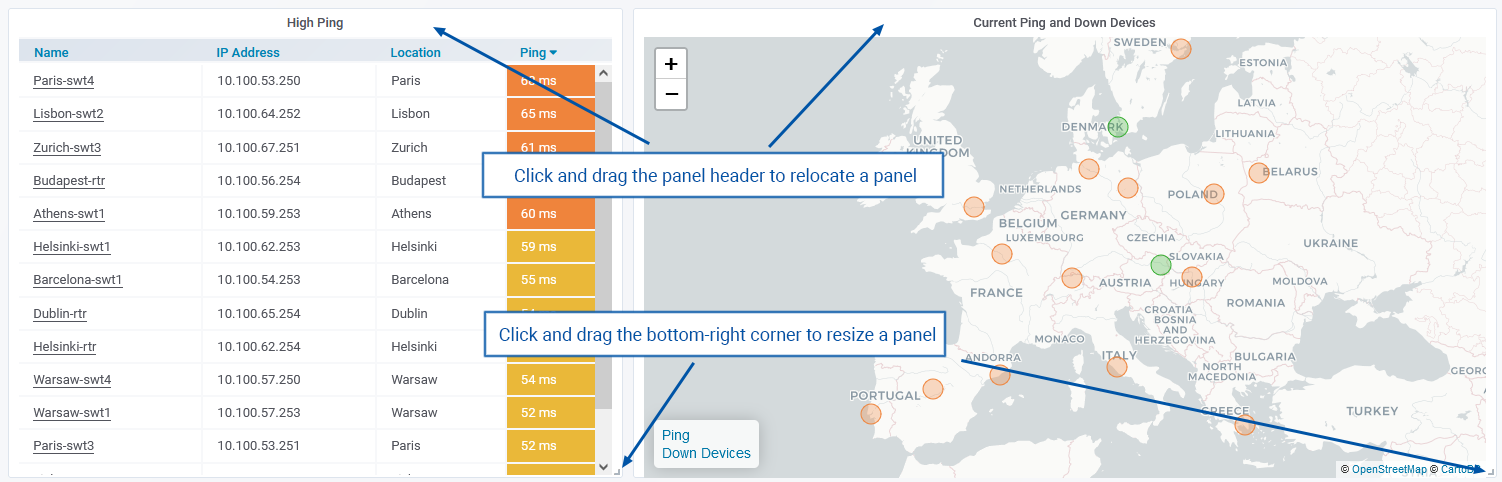
Panels will always ‘float’ to the top of a dashboard, if space permits.
Copying Panels
To duplicate a panel and adding it to the current dashboard:
- Click the panel header and select More > Duplicate
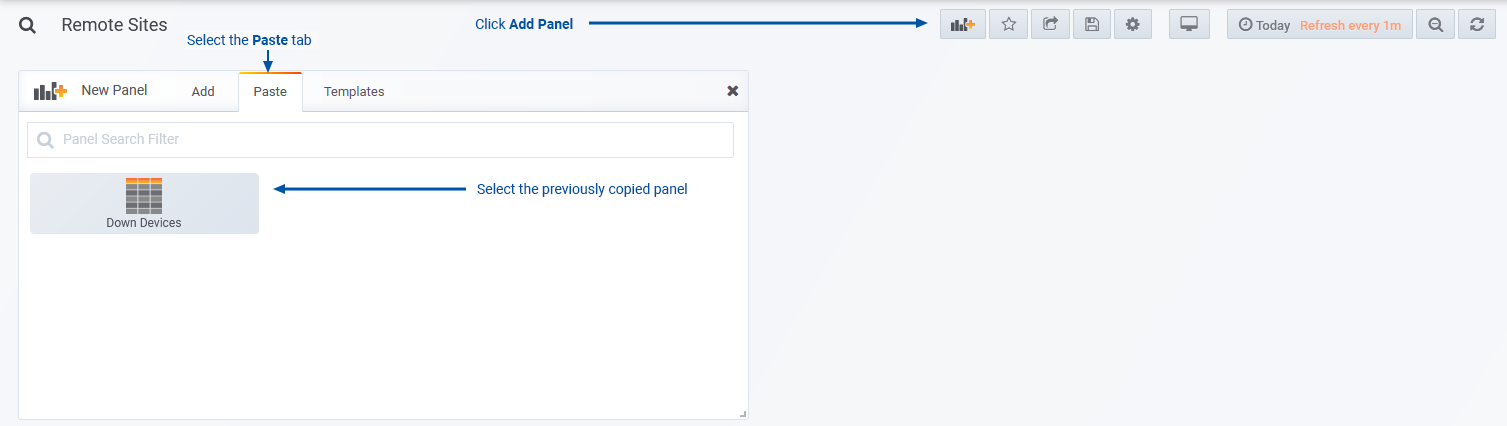
To make a copy of the panel to add to another dashboard:
- Click the panel header and select More > Copy
- Open the destination dashboard, click the Add Panel icon
- Select the Paste tab and then the panel to add to the dashboard
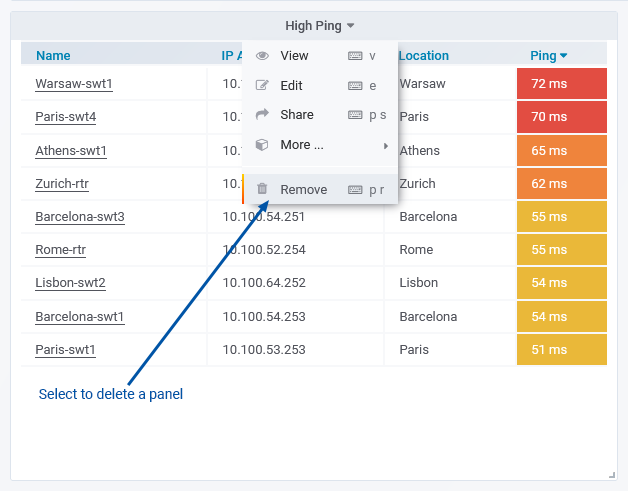
Deleting Panels
To delete a panel:
- Click the panel header, select Remove and confirm the action when prompted
Panel Templates
Panel templates are preconfigured panels which can be added to dashboards. Statseeker comes with a range of default panel templates and any panel can be saved as a custom template to be reused as needed. For details on the default panel templates provided by Statseeker, see the Template Library.
Creating Panel Templates
A panel template can be created from any existing panel located on an editable dashboard (i.e. any dashboard other than the default Statseeker dashboards).
To save a panel configuration as a reusable template:
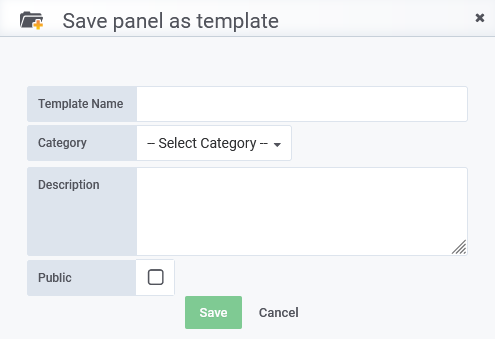
- From the panel header select More > Save panel as template
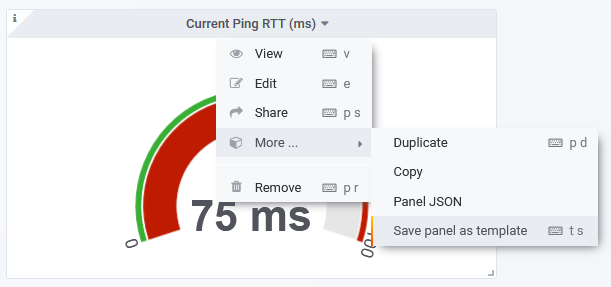
- Configure the template and click Save
- Template Name – template names must be unique to the server
- Category – templates are organized into categories/folders
- Description – any additional information concerning template functionality, requirements or usage
- Public – template access level, private templates can only be accessed by the template owner and admin users, public templates are available to all dashboard editors and admin users
Importing Templates to a Server
The Import option allows users to add pre-configured templates to an existing server. The existing template configuration can be exported to a file and subsequently uploaded to your Statseeker server. Alternatively, you can view the template’s configuration in JSON format, copy this to your clipboard and paste it directly into the Import Template text box.
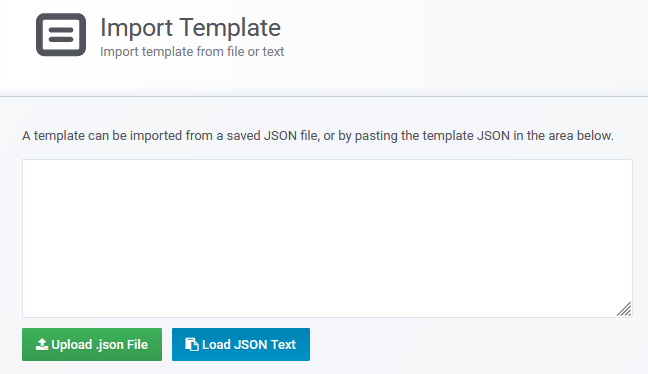
The Import Template function requires dashboard editor permission, and can be accessed from:
- Dashboard Home (buttons in the top-right)
- Dashboard Manager > Templates tab
- The dashboard Search GUI
Adding Templates to a Dashboard
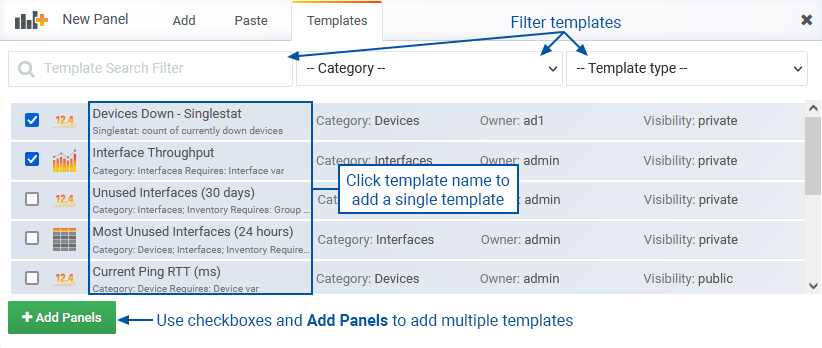
To add a template to a dashboard:
- Select Add Panel > Templates tab
- Click the template Name to add a single template
- Use checkboxes and Add Panels to add multiple templates
Editing/Deleting Templates
Template configuration can only be edited by the template owner or admin users and can be achieved from the Manage Dashboards interface, see Managing Templates for details.
Template Library
Statseeker contains a number of pre-configured panel templates. Grouped by Category, these are:
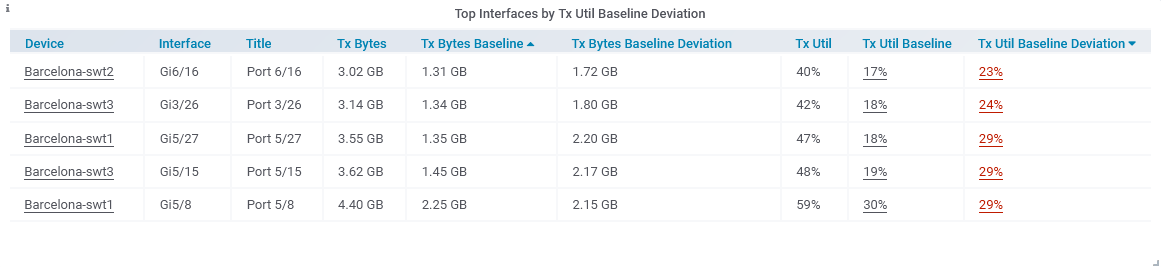
Top Interfaces by Tx Util Baseline Deviation
The top interfaces with the highest Tx Util deviation from the baseline for the time filter that match the dashboard Group and Device filters. The template features drilldowns to the Device and Interface Overview dashboards.
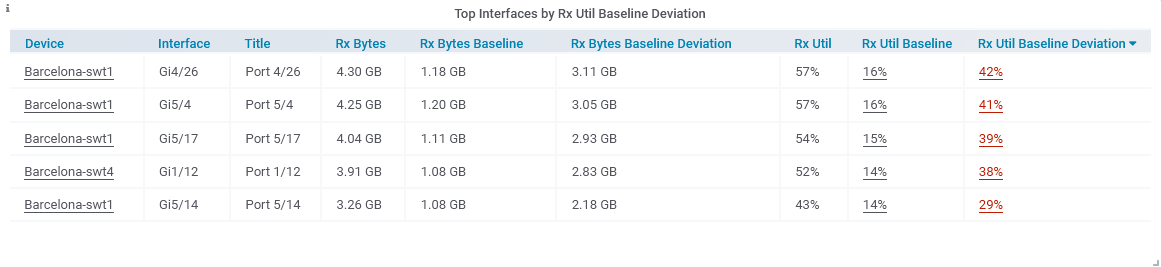
Top Interfaces by Rx Util Baseline Deviation
The top interfaces with the highest Rx Util deviation from the baseline for the time filter that match the dashboard Group and Device filters. The template features drilldowns to the Device and Interface Overview dashboards.
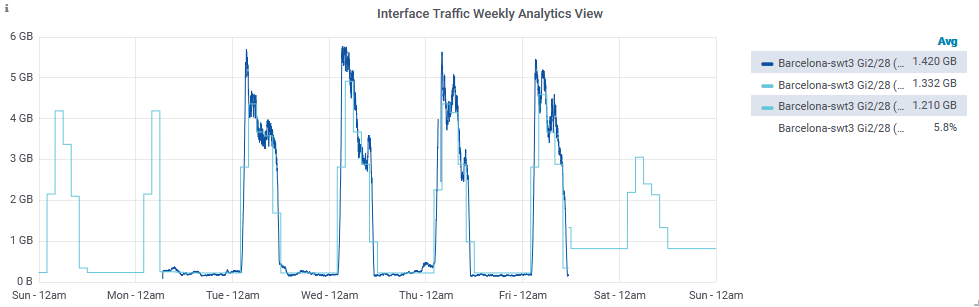
Interface Traffic Weekly Analytics View
The current total traffic and related analytics, including the historical baseline, forecast, and trend over the current week for the interface with the highest total traffic anomaly strength over the week so far that also matches the dashboard Group and Device filters. The template features drilldowns to the Interface Utilization Baselines report.
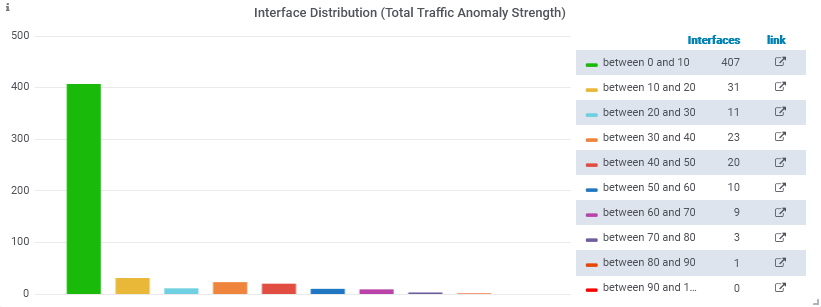
Interface Distribution (Total Traffic Anomaly Strength)
The number of interfaces in different bands of anomaly strength for their total traffic over the dashboard time filter for interfaces that match the dashboard Group and Device filters. The template features drilldowns to the Interface Utilization Baselines report.
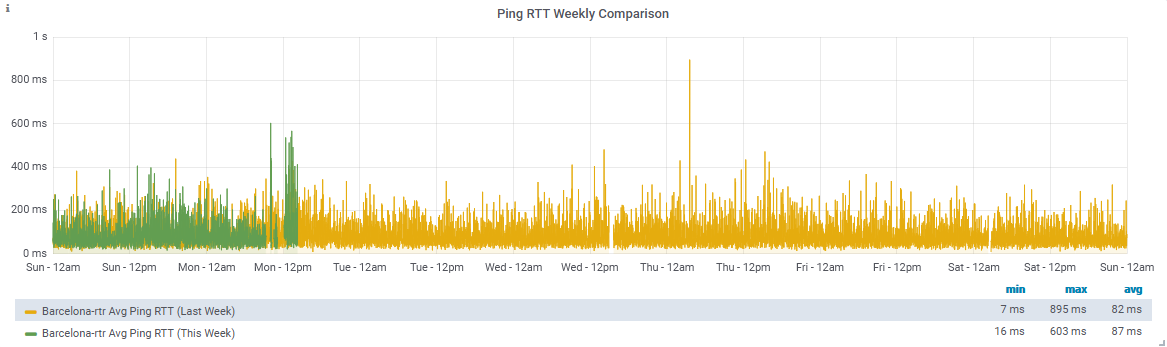
Ping RTT Weekly Comparison
Comparison of the average Ping RTT between last week and this week from the default ping poller for the device with the highest average Ping RTT over the week so far that also matches the dashboard Group and Device filters.
Daily Device Ping Reachability
The average ping reachability for the last 7 days across all devices that match the dashboard Group and Device filters.

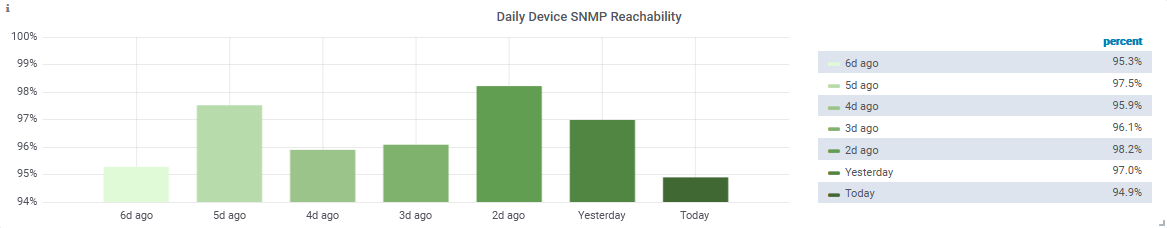
Daily Device SNMP Reachability
The average SNMP reachability for the last 7 days across all devices that match the dashboard Group and Device filters.
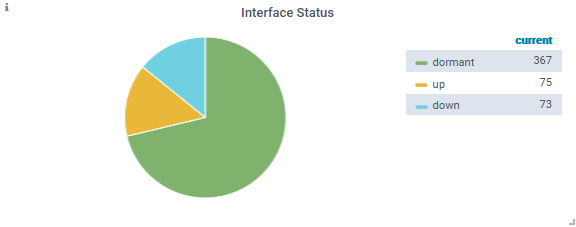
Interface Status
The number of interfaces that are in different interface ifOperStatus states that also match the dashboard Group and Device filters.
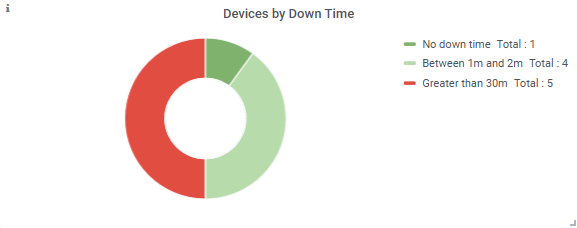
Devices by Down Time
Compares the number of devices that have had various lengths of down time during the dashboard time filter for devices that match the dashboard Group and Device filters.
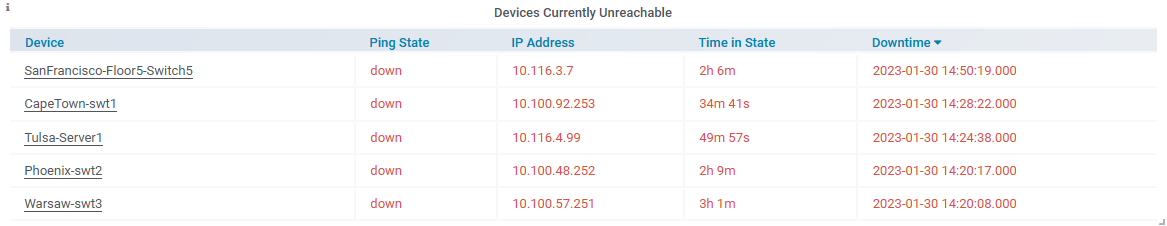
Devices Currently Unreachable
The most recent devices that are currently unreachable via ICMP and that match the dashboard Group and Device filters. The template features drilldowns to the Device Overview dashboard.
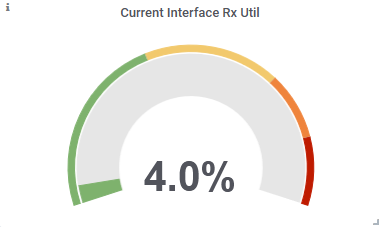
Current Interface Rx Util
The current Rx Utilization percentage averaged across all interfaces that match the dashboard Group and Device filters. The template features drilldowns to the Interface Overview dashboard.
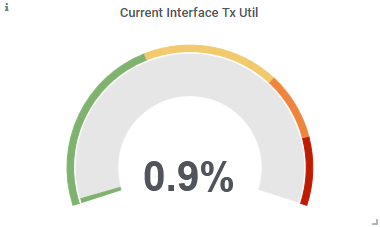
Current Interface Tx Util
The current Tx Utilization percentage averaged across all interfaces that match the dashboard Group and Device filters. The template features drilldowns to the Interface Overview dashboard.
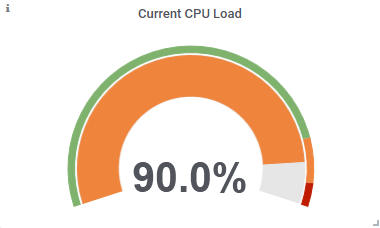
Current CPU Load
The current CPU Load averaged across all CPUs on devices that match the dashboard Group and Device filters.
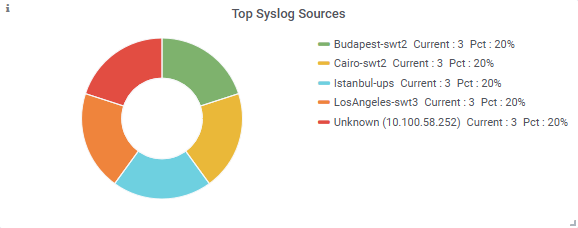
Top Syslog Sources
The top syslog sources based on the number of messages received in the last hour.
Note that the Group and Device filters do not apply to this panel.
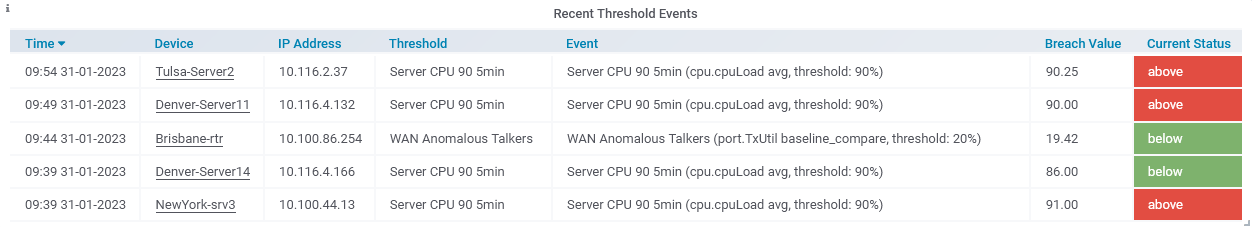
Recent Threshold Events
The most recent threshold events that have occurred for devices and that match the dashboard Group and Device filters. The template features drilldowns to the Device Overview dashboard.
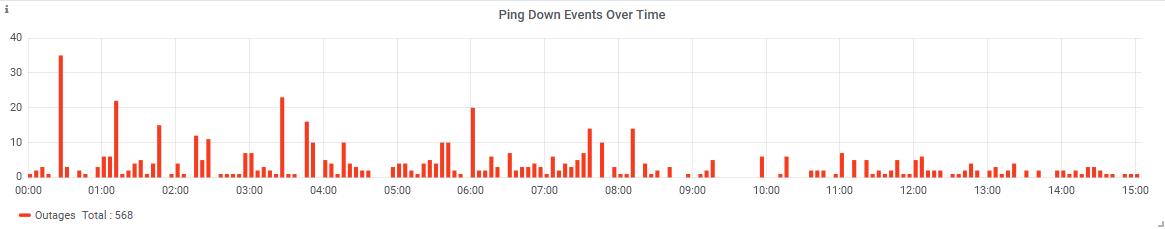
Ping Down Events Over Time
Historical counts of the number of ping down events every 5m over the duration of the dashboard time filter that match the dashboard Group and Device filters.
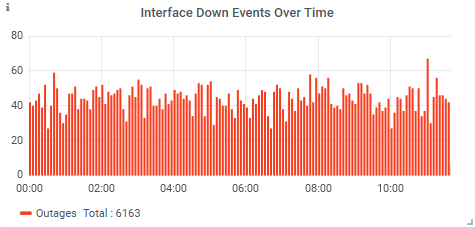
Interface Down Events Over Time
Historical counts of the number of interface operstatus down events every 5m over the duration of the dashboard time filter for interfaces that match the dashboard Group and Device filters.
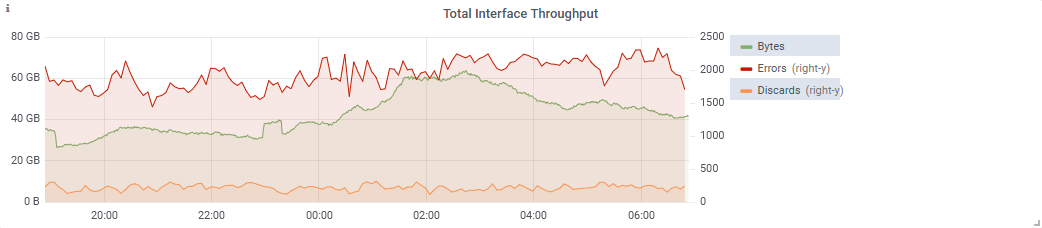
Total Interface Throughput
The total volume of Interface traffic and errors/discards for the duration of the dashboard time filter across all interfaces that match the dashboard Group and Device filters. The template features drilldowns to the Interface Overview.
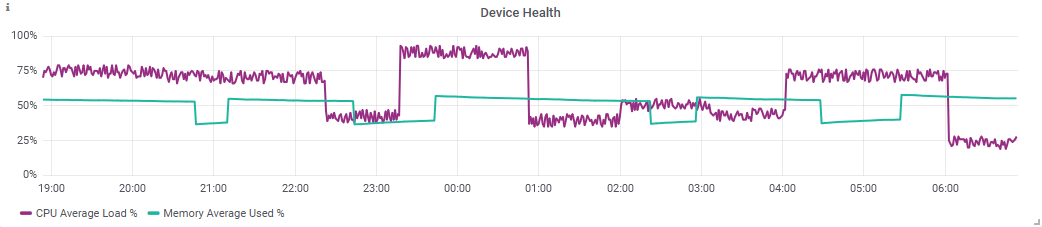
Device Health
Historical CPU load and memory usage averaged over all devices that match the dashboard Group and Device filters.
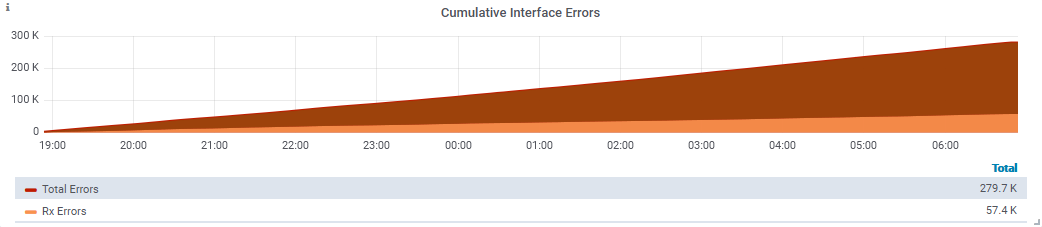
Cumulative Interface Errors
The total cumulative number of interface errors over the dashboard time filter from interfaces that match the dashboard Group and Device filters.
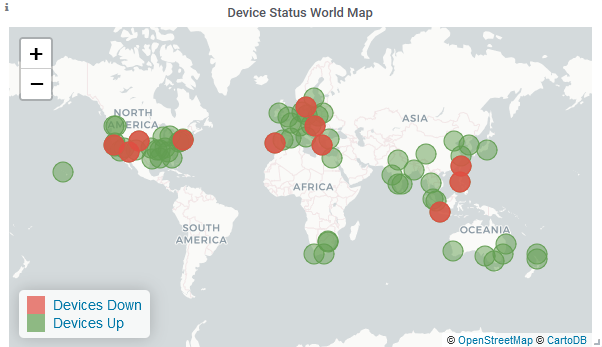
Device Status World Map
The number of devices that are currently in an up or down ping state grouped by geolocation that match the dashboard Group and Device filters. The template features drilldowns to filtered device event records.
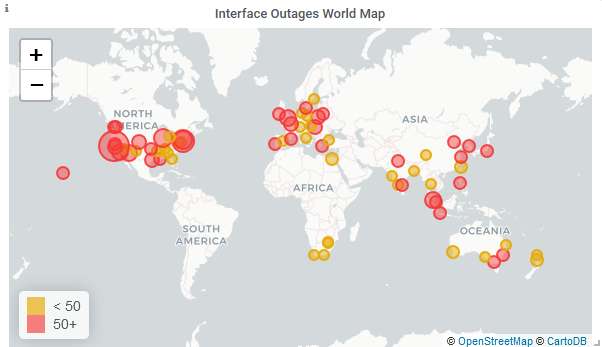
Interface Outages World Map
The number of interfaces that are currently operationally down grouped by geolocation that match the dashboard Group and Device filters. The template features drilldowns to filtered interface event records.
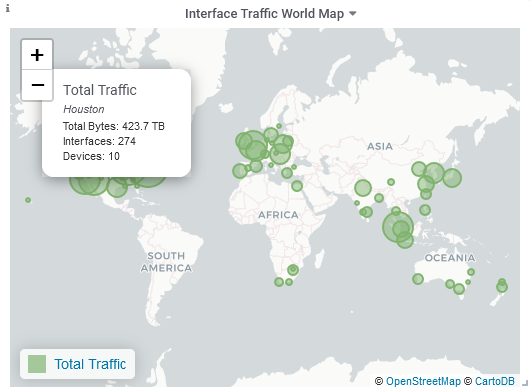
Interface Traffic World Map
The total volume of interface traffic for interfaces grouped by geolocation that match the dashboard Group and Device filters. The template features drilldowns to filtered interface traffic details.
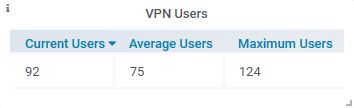
VPN Users
The current, average, and maximum number of active VPN users over the duration of the dashboard time filter for devices that match the dashboard Group and Device filters.
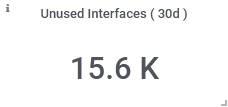
Unused Interfaces ( 30d )
The number of interfaces that have not had any traffic over the last 30 days and match the dashboard Group and Device filters.
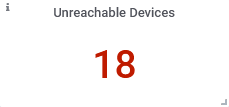
Unreachable Devices
Total number of devices that are classed as unreachable and not responding to ICMP requests, matching the dashboard Group and Device filters.
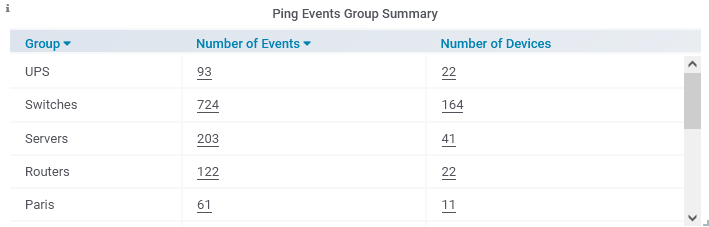
Ping Events Group Summary
A summary of the device ping events that occurred over the duration of the dashboard time filter organized by group for devices that match the dashboard Group and Device filters. The template features drilldowns to filtered event record and device lists.
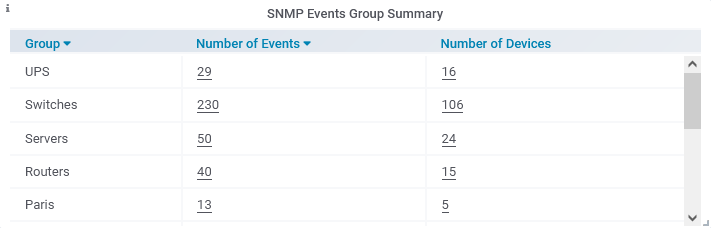
SNMP Events Group Summary
A summary of the device SNMP events that occurred over the duration of the dashboard time filter organized by group for devices that match the dashboard Group and Device filters. The template features drilldowns to filtered event record and device lists.
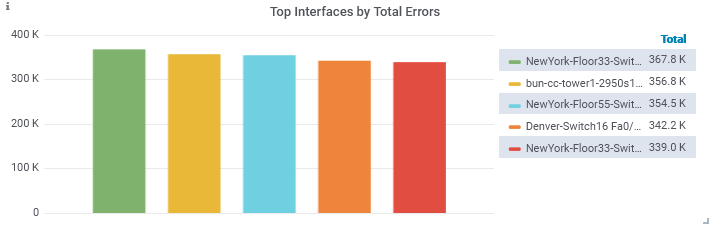
Top Interfaces by Total Errors
The interfaces with the highest total number of errors during the dashboard time filter from interfaces that match the dashboard Group and Device filters.
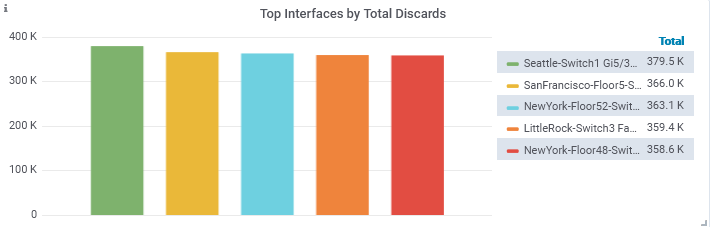
Top Interfaces by Total Discards
The interfaces with the highest total number of discards during the dashboard time filter from interfaces that match the dashboard Group and Device filters.
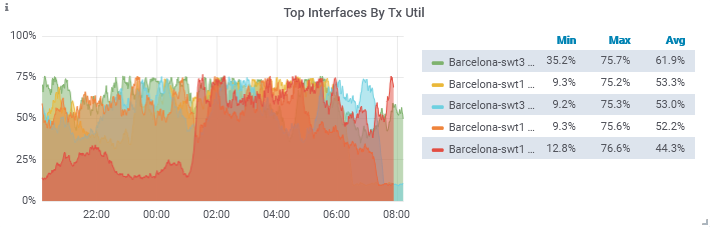
Top Interfaces By Tx Util
The interfaces with the highest average Tx Utilization percentage during the dashboard time filter from interfaces that match the dashboard Group and Device filters.
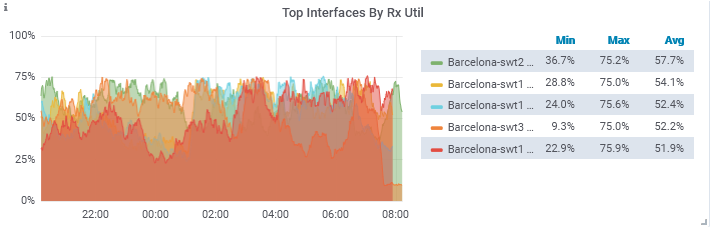
Top Interfaces By Rx Util
The interfaces with the highest average Rx Utilization percentage during the dashboard time filter from interfaces that match the dashboard Group and Device filters.
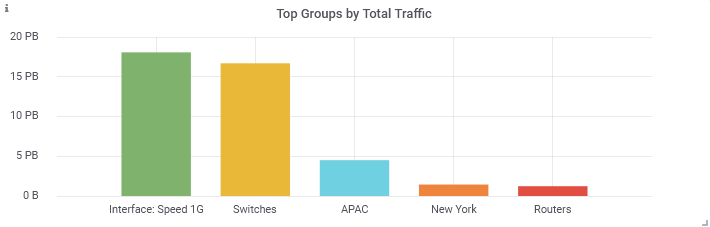
Top Groups by Total Traffic
The top groups with the most interface traffic over the dashboard time filter for interfaces that match the dashboard Group and Device filters.
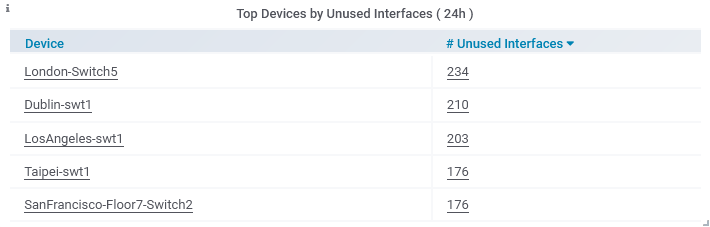
Top Devices by Unused Interfaces ( 24h )
The top devices with the highest number of interfaces that have not had any traffic over the last 24 hours and that also match the dashboard Group and Device filters. The template features drilldowns to the Device Overview dashboard and filtered unused device details lists.
Saving and Restoring Dashboard
When saving dashboards, you are presented with the option to add a note identifying the changes made.
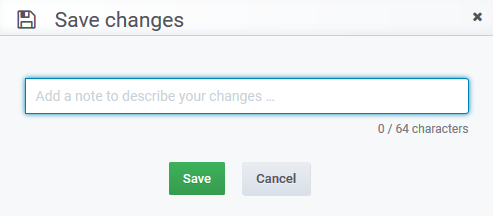
These notes, along with the time of the save-point are used to build a version history of the dashboard. The version history allows dashboard editors to roll-back changes, restoring a dashboard to a previous state.
To view the version history:
- Click the dashboard Settings button
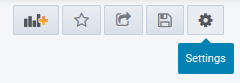
- Select Versions
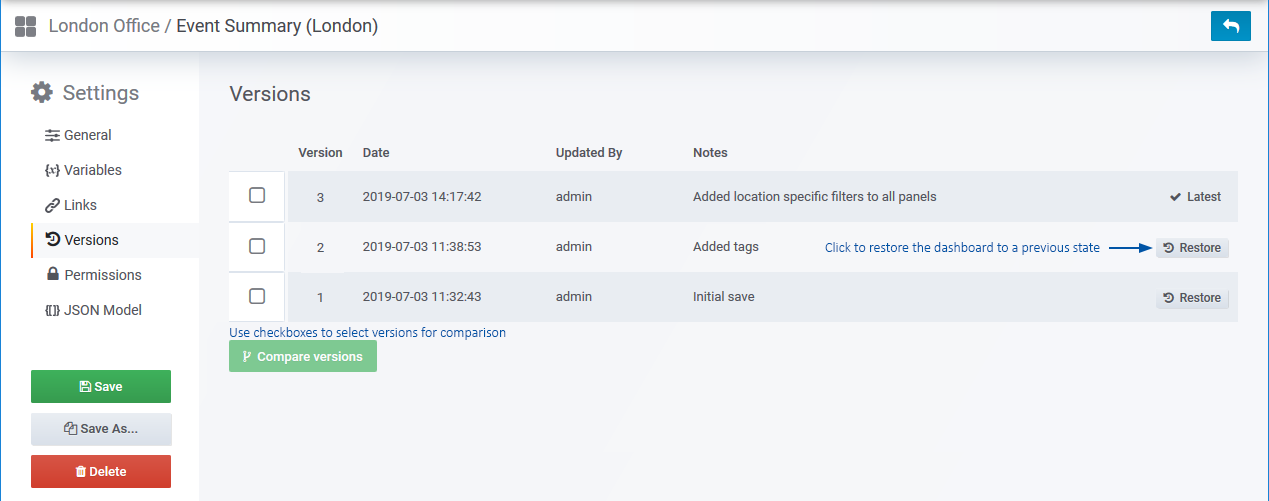
The versions screen allows you to compare any two versions, displaying a summary of the changes made as well as the option to view a comparison of the JSON underlying the dashboard configuration.
If needed, roll the dashboard back to a previous state by clicking the Restore button associated with that version.
Restoring the dashboard to a previous state adds the restored state as a new version, retaining all saved states of the dashboard.
Copying a Dashboard
A local copy of an existing dashboard:
- Select Dashboard Settings
- Click Save As
- Specify a name and save location and click Save
Exporting and Sharing Dashboards
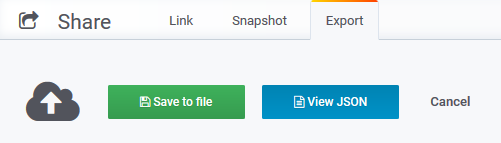
There are 3 options for sharing your Statseeker dashboards:
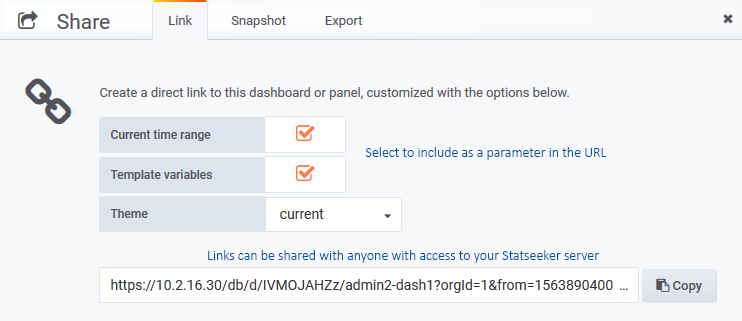
- Link – create and copy a link to your dashboard, optionally including your current timefilter and variable settings. Requires that those receiving the link have access to the Statseeker server, and the end-user’s data visibility permissions (see Users and Grouping for details) determine the content of the dashboard when viewed.
- Snapshot – creates a record of the current state of the dashboard and caches the data displayed, allowing anyone to view the data as contained in the snapshot. Requires access to the Statseeker server to view.
- Export – used to create a copy of the dashboard configuration and from that configuration, create a new dashboard.
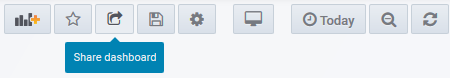
To link, snapshot, or export a dashboard:
- Select Share from the dashboard actions in the top-right
Dashboard Links
The current time filter, and any dashboard level variables used by panels within the dashboard, can be included when creating the link.
Snapshots
The current state of a dashboard, including the data can be saved as a snapshot. This snapshot can be shared with anyone that has access to the Statseeker server and includes not only the dashboard configuration but also a cached copy of the data displayed in the dashboard at the time the snapshot was taken. Once created, a snapshot cannot be edited in any way, only viewed, and deleted.
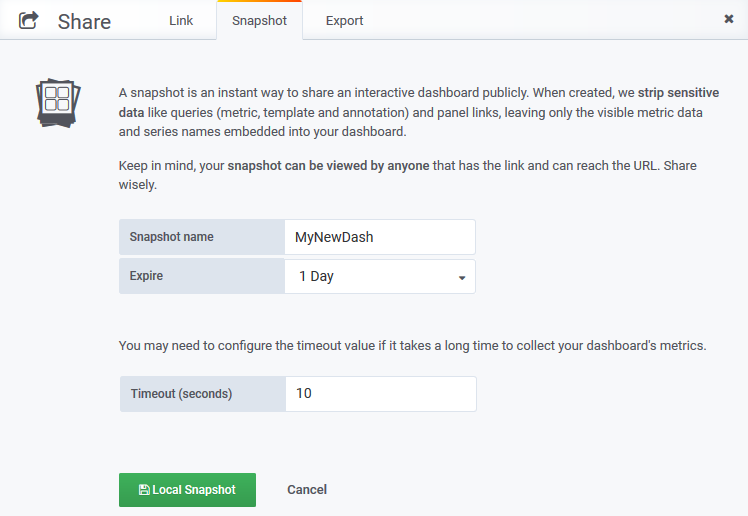
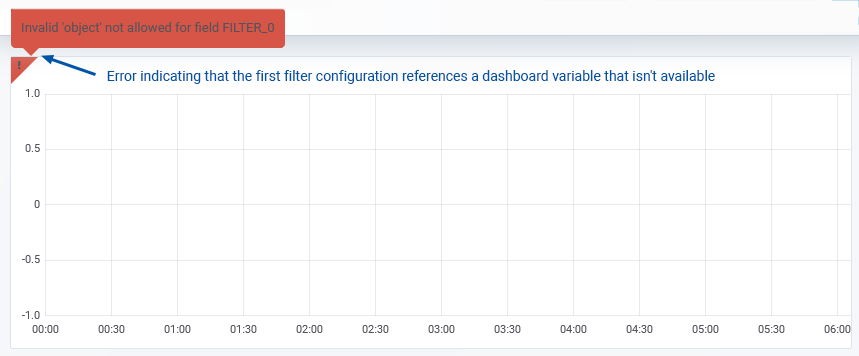
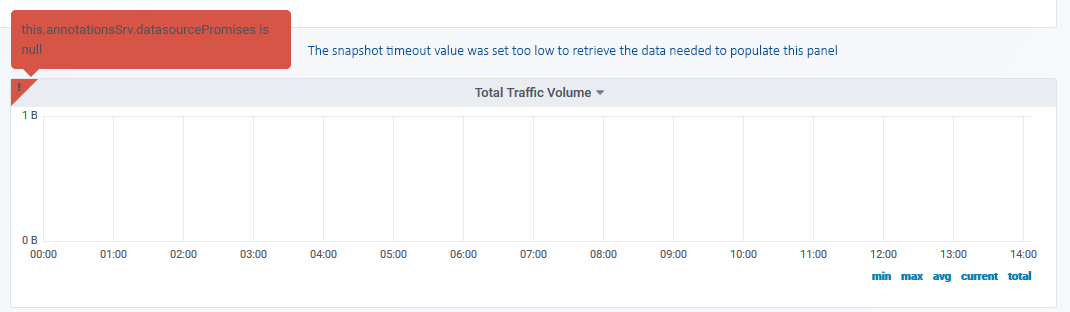
When the snapshot is created, Statseeker effectively reloads the dashboard in the background and caches everything. If the dashboard typically takes a while to load all data on refresh, then consider running a refresh first to get a rough estimate of how long is needed, then set the snapshot timeout value accordingly. If the timeout is set too low to retrieve all the required data, then users viewing the snapshot may see empty panels and panels presenting error messages.
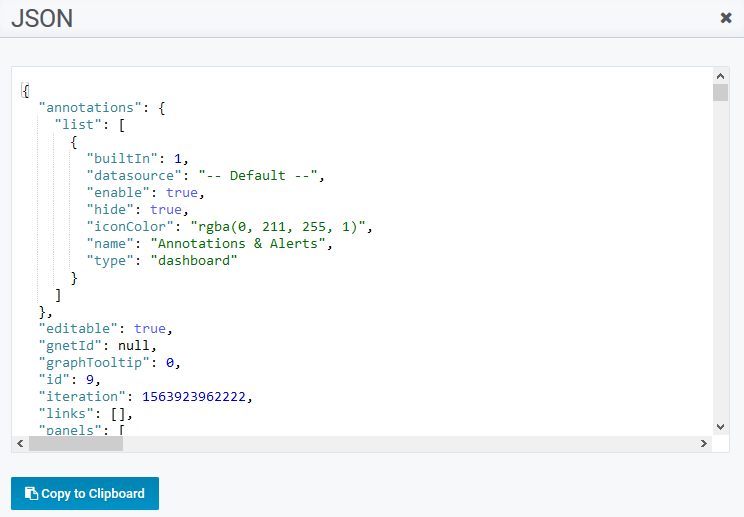
Export
A dashboard configuration can be exported and shared with any other Statseeker user. This export includes the dashboard panels, filters, and settings, but not the data. Exporting a dashboard allows you to share your dashboard with another user, providing them with a copy which they can view and edit as their own.
The dashboard configuration can be saved to a file (in JSON format) and then imported to create a new dashboard.
Alternatively, the configuration can be copied to the clipboard and from there, copied into the configuration file, creating a new dashboard.
Importing an exported dashboard configuration is handled in the Dashboard Manager, see Dashboard Manager > Manage
Moving and Deleting Dashboards
Moving and deleting dashboards can be handled from either the Dashboard Manager, see Dashboard Manager > Manage tab, or from within the dashboard itself.
Moving a Dashboard
- View the dashboard and select the Settings icon in the top-right
- Select General
- Update the specified Folder and click Save
Deleting a Dashboard
- View the dashboard and select the Settings icon in the top-right
- Select General
- Click Delete and confirm the action when prompted
Dashboard Settings
Select the icon to view the Dashboard Settings.
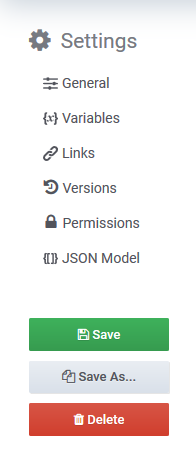
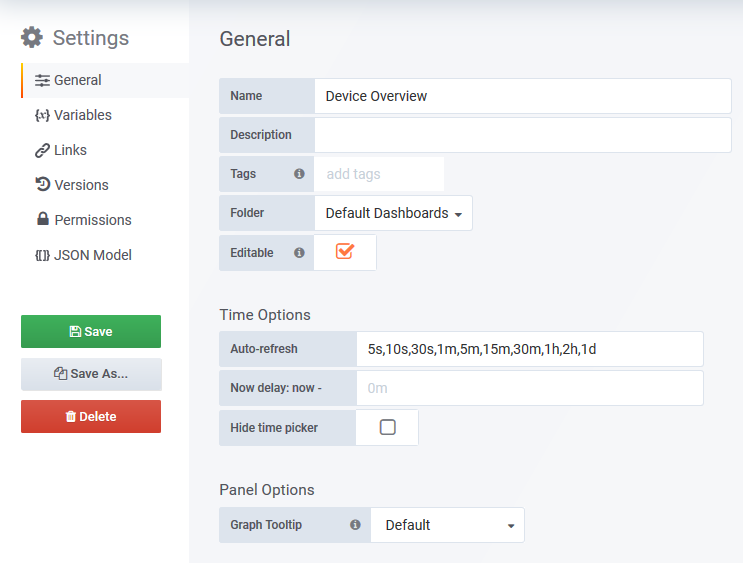
General
- Save the dashboard
- Return to Dashboard Settings
- Name – edit the dashboard name
- Descriptions – set a description
- Tags – apply tags to be used when searching for or filtering dashboards
If Meraki Monitoring is licensed on the server, then the default Meraki dashboards will be available featuring a similar dashboard level link utilizing the Meraki tag to filter the list.
- Folder – move the dashboard
- Editable – toggle the ability for non-Admin users to edit the dashboard (overrules the user-role level viewer/editor permissions when unchecked)
- Auto-refresh – define refresh options available in the time filter
- Now delay – can be set to resolve issues where ‘now’ typically returns NULL for the last polling interval
- Hide time picker – toggle to hide the time filter in the dashboard
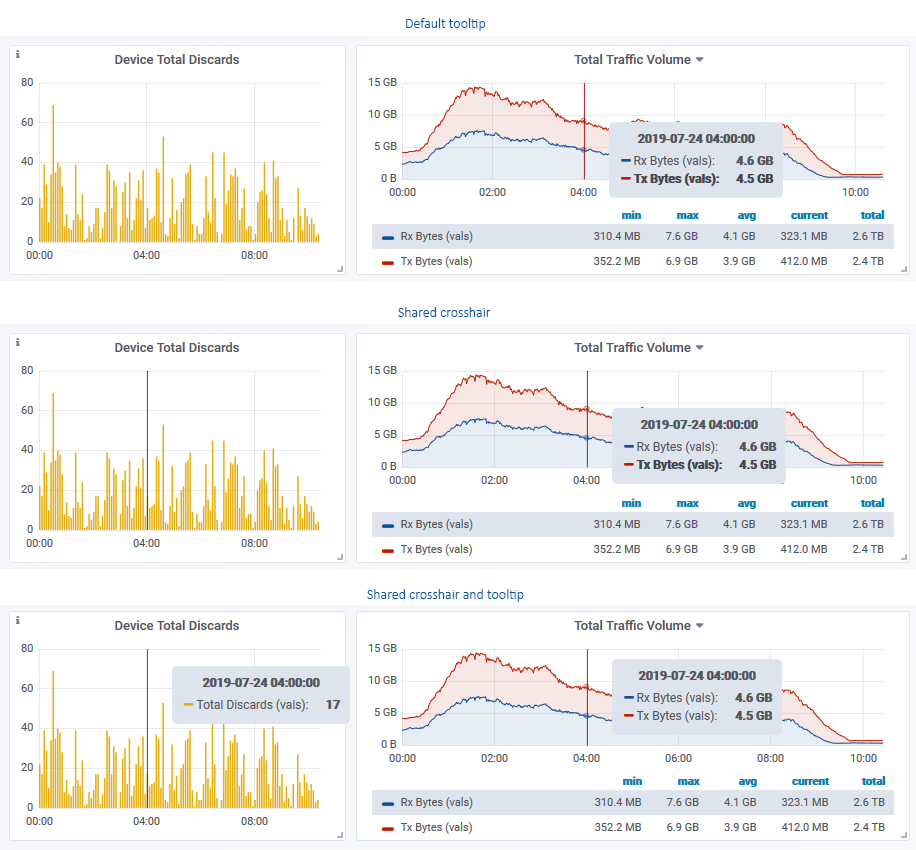
- Graph Tooltip – configure tooltip behavior, this setting can be cycled with the keyboard shortcut Ctrl/Cmd+O
- Default – crosshair and tooltip are only displayed for the graph under the mouse
- Shared crosshair – the tooltip is displayed for the graph under the mouse, but the crosshair is shown on all graphs on the dashboard
- Shared tooltip – both crosshair and tooltip are displayed on all graphs
Variables
Instead of hardcoding values into your panels, editors can create dashboard level variables and reference them in panel configurations. Variables are used in this way in all default Statseeker dashboards:
Variable Configuration
- Name – referenced by panels making use of the variable with the syntax $name
- Label – optional display alternative to the specified Name
- Type – select variable type (see below)
- Hide – toggle to display variable in the dashboard
Type: Query
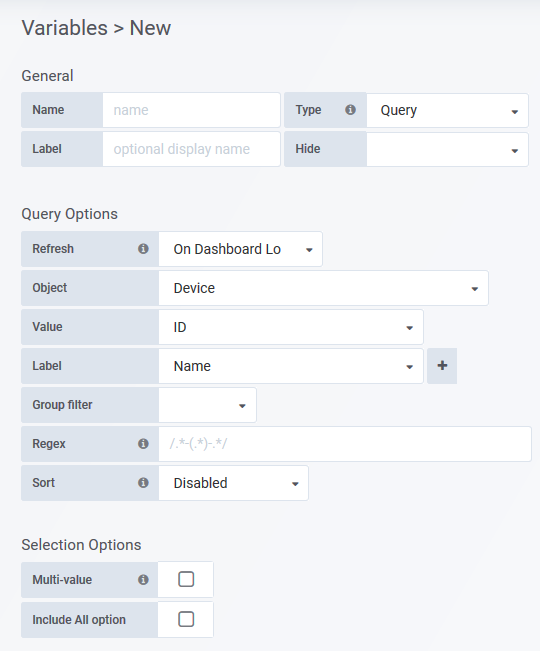
- Refresh – refresh rate for variable values
- Object – the Statseeker object list to offer as a variable (e.g. selecting Device will present a list of all devices in the variable)
- Value – the value that will be passed to the panel when the variable is referenced (e.g. If Object = Device, selecting ID will pass the device ID to the panel, selecting Name will pass the device name to the panel)
- Label – The label to display in the variable list (e.g. If Object = Device, and Value = ID, and Label = Name, the variable presents a list of Device names, when an entry is selected the device ID is passed to the panel)
- Regex – set to filter the query
- Sort – sort variable by displayed Label when set, otherwise sort by Value
- Multi-value – toggle to allow multiple selections
- Include All option – toggle to add an ‘All’ option to the variable list
- Custom All – Requires Include All option. Apply a custom regex to be used when selecting the “All” option
- The regex will be run against the variable Value, not the Label
- A blank Custom All field will return a list of all Object entities. Dashboard panels referencing the variable will iterate through that list running a match against each of these values – this can be slow when a very large number of entities are returned. Specifying .* as the Custom All will more efficiently select all entities.
Type: Custom
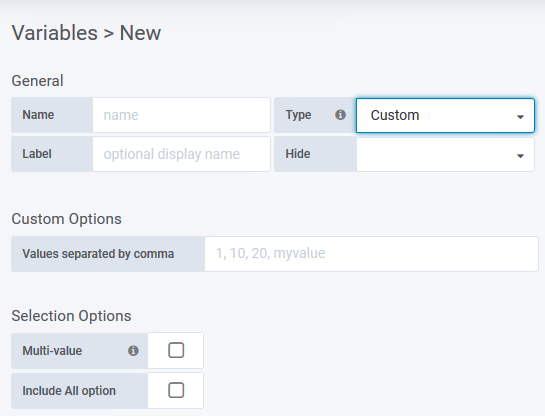
- Values – csv list of values to display
- Multi-value – toggle to allow multiple selections
- Include All option – toggle to add an ‘All’ option to the variable list
- Custom All – Requires Include All option. Apply a custom regex to be used when selecting the “All” option
- The regex will be run against the variable Value, not the Label
- A blank Custom All field will return a list of all Object entities. Dashboard panels referencing the variable will iterate through that list running a match against each of these values – this can be slow when a very large number of entities are returned. Specifying .* as the Custom All will more efficiently select all entities.
Type: Text box
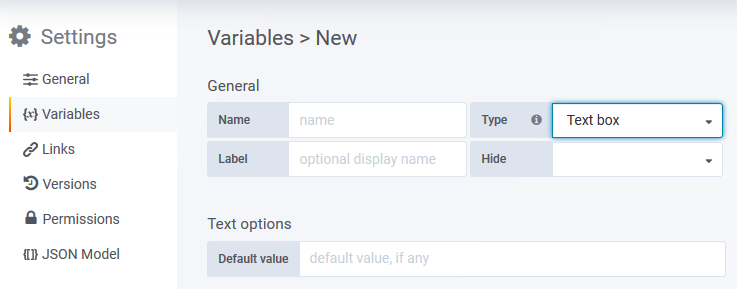
- Default value – optionally include a default value
Default Variables
Statseeker automatically includes 3 pre-configured variables in all custom dashboards:
- Group ($Group) – a list of all groups (containing at least one device) on the server
- Device ($Device) – a list of all devices on the server, filtered by the current value of the Group variable
- TopN ($TopN) – a text field which can be referenced in the Metrics tab > Limit field to dynamically limit the number of returned rows
These variables are added to all newly created custom dashboards on initial save of the dashboard. To employ these variables in your panel configurations:
- Create a new dashboard
- Place a panel and then Save the dashboard
The Group and Device variables will be added and then dashboard saved.
- Edit the panel to reference the variable in the panel configuration, for more details see Referencing Variables in Panel Configurations
Referencing Variables in Panel Configurations
Once a dashboard variable has been created it can be referenced in a number of places within a panel configuration, including:
- Panel title
- Repeating panels
- Query Filters
- Query Limit
- Coloring rules
- Link configuration
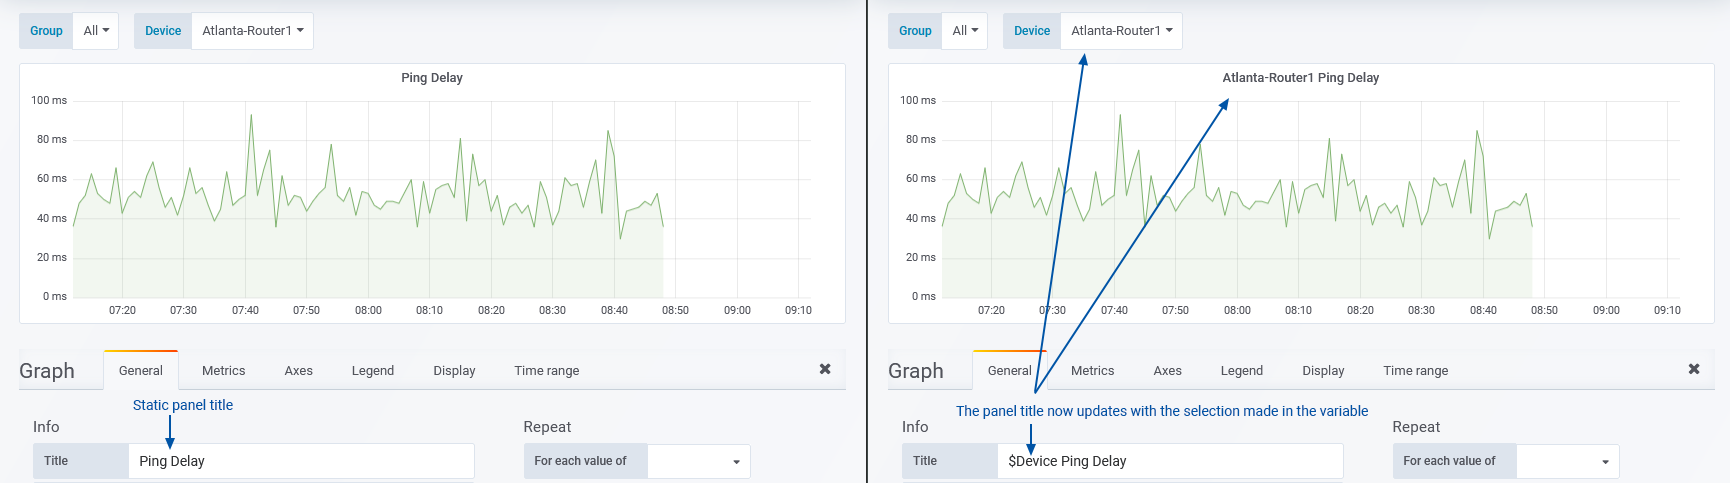
Panel Title
Add the variable reference to the panel Title configuration in the General tab to create dynamic panel titles, ensuring that users are aware of the panel focus/content.
Repeating Panels
There are two repeating panel configurations:
- Repeating Rows – repeat a row, and every panel contained within the row, for each value in a variable
- Repeating Panels (non-Row) – repeat a single panel configuration for every value in a variable
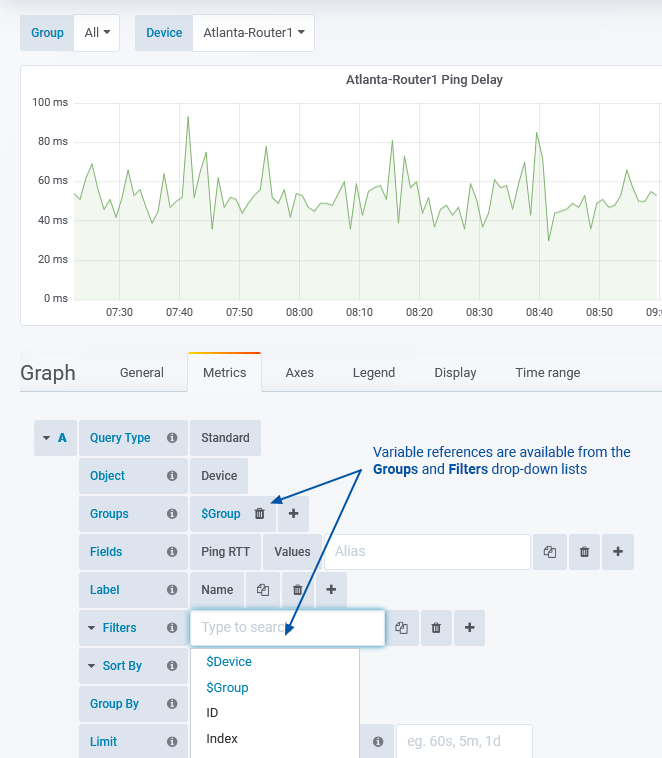
Query Filters
The most common implementation for variables is for use in panel filters, providing the ability to drive panel content from the variable value. All Statseeker Default dashboards utilize variables in the panel filters.
Once a dashboard variable has been configured the variable is automatically added to the query Groups and Filters drop-down lists for easy access.
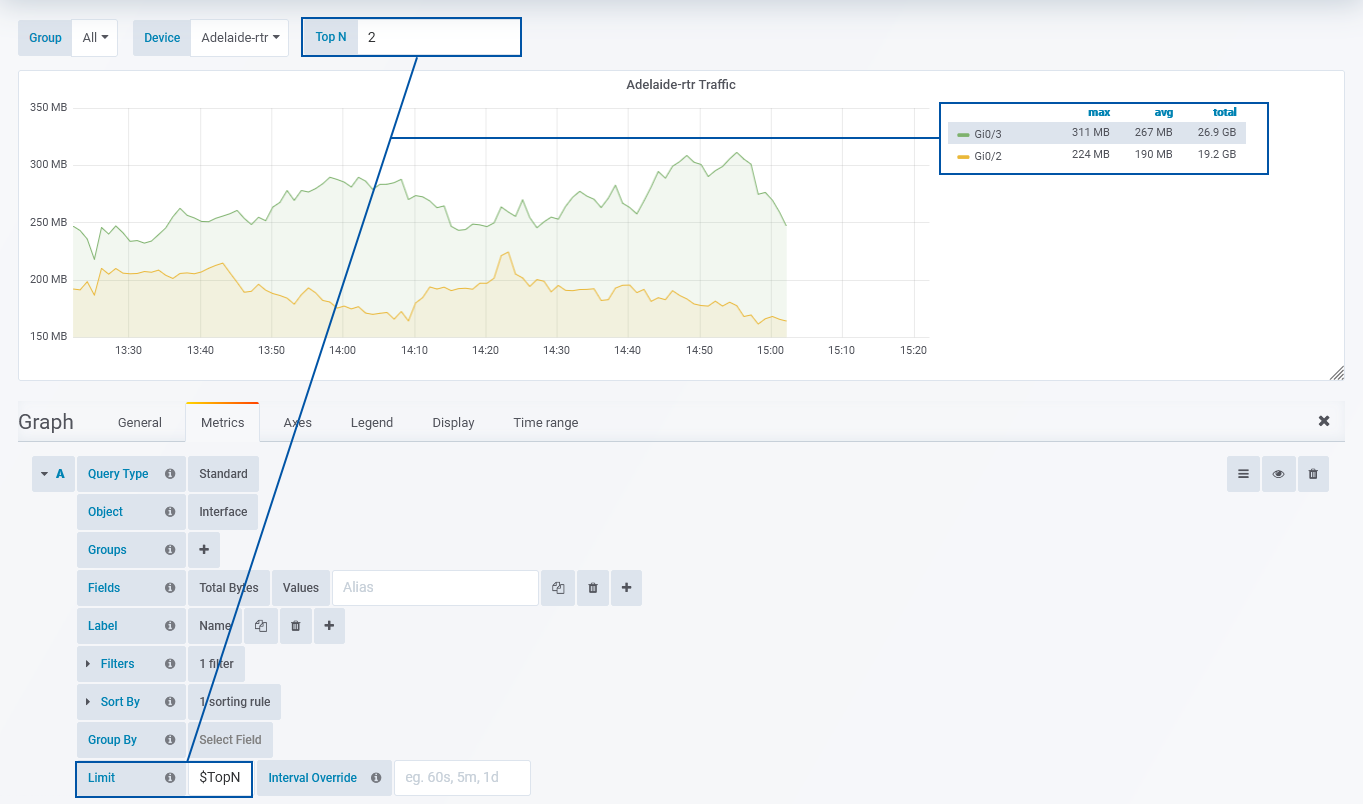
Query Limit
The default TopN ($TopN) variable can be referenced in the Metrics tab > Limit field to dynamically alter the number of rows returned by the query.
Coloring Rules
The default Ping RTT Comparison dashboard uses Text (Type = Text box) variables to drive the coloring rules used throughout the dashboard. Users can update these variables as needed and the dashboard will re-color cells in various table panels.
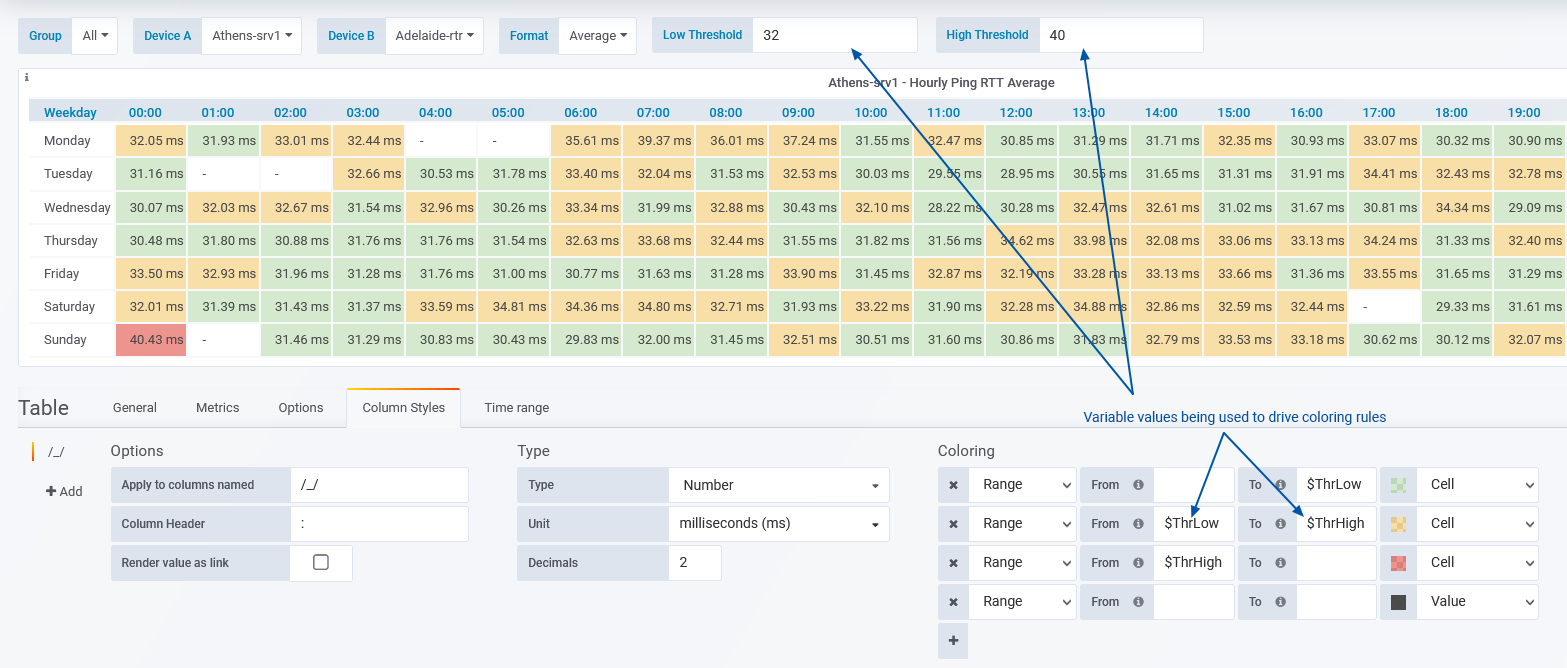
Using variables to drive coloring rules is available in Table, Singlestat, Image Map, and Worldmap panels. Similar functionality can be achieved using variables in Graph panel > Display Tab > Threshold configurations.
Link Configurations
Variables can also be utilized in dashboard, panel and field-level links, allowing the link configuration to pre-populate variables in the destination. For details on using variables in link configurations see Setting Variables from Links.
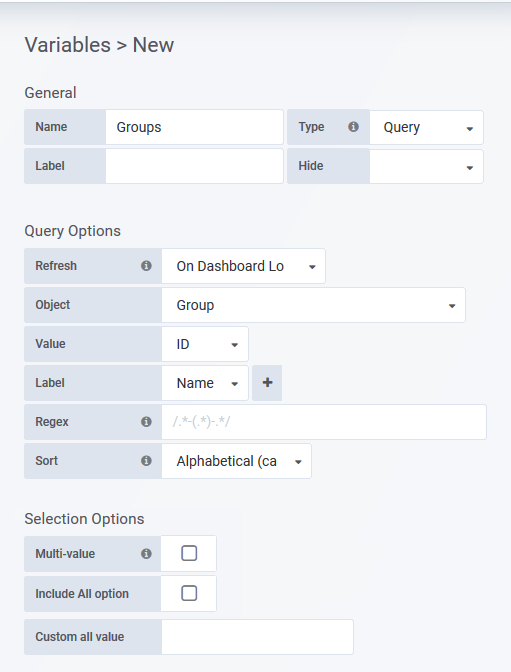
Example: Group Selector
This variable will offer a list of all Statseeker groups. Any panel where Groups = $Groups will have the content of that panel filtered by the content of the selected group/s.
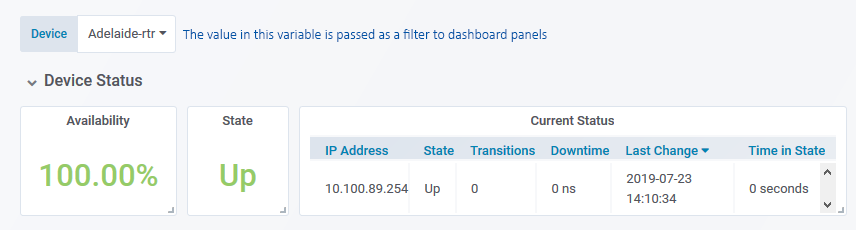
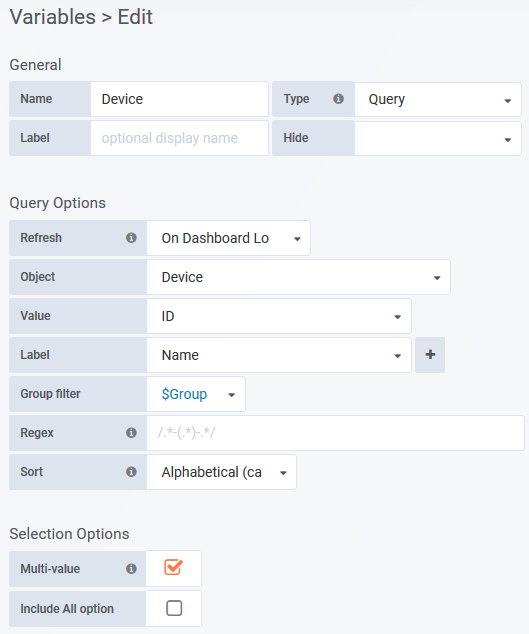
Example: Device Selector
This example will create a variable which presents all monitored devices on your network. Dashboard panels can be configured to reference this variable, filtering their content by the device/s selected in the variable. This example uses the Groups variable from the previous example. The device list presented in this variable will be filtered by the selection in the Groups variable.
This variable is featured in the default Device and Interface Overview dashboards.
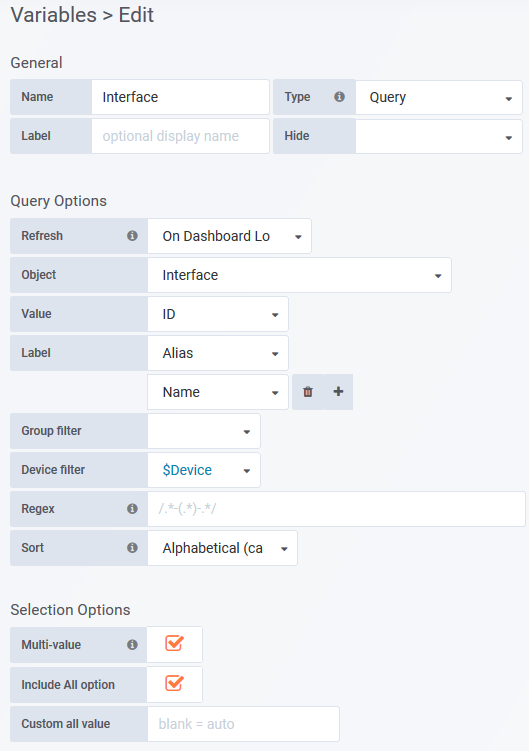
Example: Interface Selector
This example will create a variable which presents all interfaces found on a device. This example uses the Device variable from the previous example. The interface list presented in this variable will be filtered by the selection in the device variable.
This variable is featured in the default Interface Overview dashboard.
Links
The links tab allows you to add links to the top-right of the dashboard. These links can be either a list of dashboards and dashboard folders, or a URL.
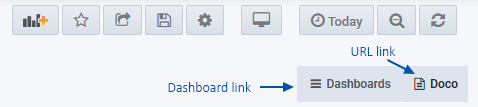
- Type – the link type, either Dashboard or URL
Type: Dashboard – a list of dashboards and dashboard folders found on the server
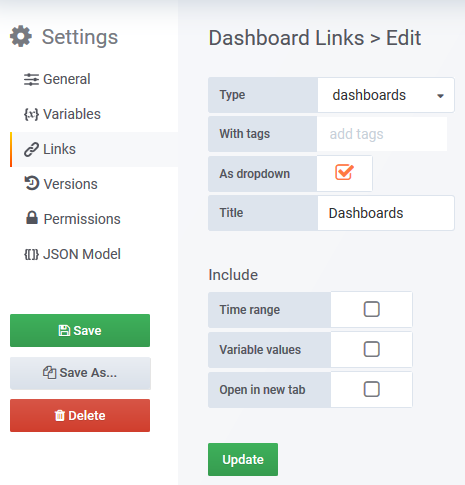
- With tags – filter the dashboard list by the specified tags
- As dropdown – toggle to display the list as a dropdown
- Title – displayed dropdown title
- Time range – toggle to pass the current time filter through to the selected dashboard
- Variable values – toggle to pass the current variable values through to the selected dashboard
- Open in tab – toggle to launch the selected dashboard/folder in a new tab
If Meraki Monitoring is licensed on the server, then the default Meraki dashboards will be available featuring a similar dashboard level link utilizing the Meraki tag to filter the list.
Type: Link – specify a URL to link to
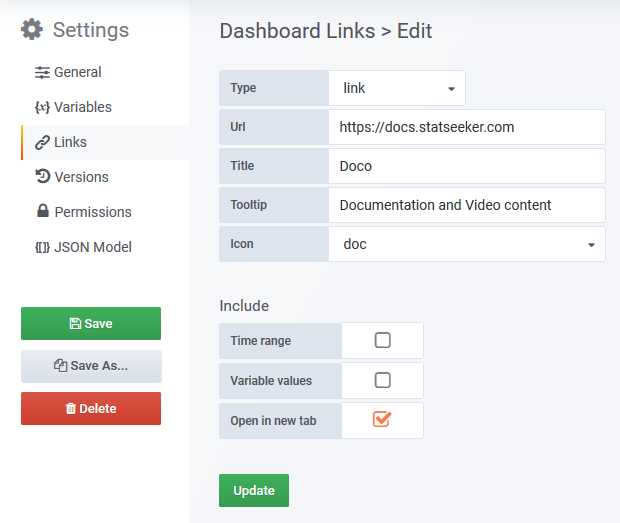
- Url – the URL to link to
- When linking to resources on the Statseeker server, the domain name part of the URL can be omitted
- Console report: https://MyStatseekerServer/cgi/nimc02?rid=53410, can be defined as /cgi/nimc02?rid=53410
- Dashboard: https://MyStatseekerServer/#dashboards:StatseekerDefaultDeviceOverview, can be defined as /#dashboards:StatseekerDefaultDeviceOverview
- When linking to external resources, other protocols such as mailto:// and ssh:// can also be referenced
- Title – displayed link title
- Tooltip – content will be displayed on hover
- Icon – icon to display with the link title
- Time range – toggle to pass the current time filter through to the selected URL
- Variable values – toggle to pass the current variable values through to the selected URL
- Open in tab – toggle to launch the selected link in a new tab
Linking to a specific Panel
When specifying a link to a another dashboard, additional parameters can be supplied to link to a specific panel within that dashboard and focus the view within that dashboard to display just the specified panel. Panel specific links can be specified within the General tab of any panel and from within specific object or field configurations within Table, Pie Chart, and Image Map panels.
These links require an absolute reference (Link Type = Url or absolute), the syntax for panel-specific links is:
- panelTitle={PANEL_TITLE}&fullscreen=true
Example: A link to the Ping Delay panel within the default Device Overview dashboard, looking at a device named “London-swt2”
- /#dashboards:StatseekerDefaultDeviceOverview?var-Device=London-swt2&panelTitle=Ping Delay&fullscreen=true
Setting Variables from Links
The Variable Values setting enables you to automatically pass the value from a variable in the dashboard through to a corresponding (must have the same name) variable in the destination dashboard.
In some instances, you may wish to set a variable in the destination, but the source dashboard doesn’t include that variable, or you want the variables in the destination dashboard set to a different value. In this instance you will need to specify this requirement as a parameter in the URL.
When using an absolute reference (Drilldown = Absolute), the syntax is:
- /#dashboards:<DASHBOARD_REFERENCE>?var-<VARIABLE_NAME1>=<VARIABLE_VALUE>&var-<VARIABLE_NAME2>=<VARIABLE_VALUE>
- E.g: /#dashboards:StatseekerDefaultDeviceOverview?var-Device=London-rtr
When Drilldown = Dashboard, we select the dashboard form the list and add the variable references in the URL Params field using the following syntax:
- var-<VARIABLE_NAME1>=<VARIABLE_VALUE>&var-<VARIABLE_NAME2>=<VARIABLE_VALUE>
- E.g: var-Device=London-rtr&var-Interface=Gi0/1
Versions
View the dashboard version history, compare version, and restore the dashboard to a previous state. See Saving and Restoring Dashboards.
[top]
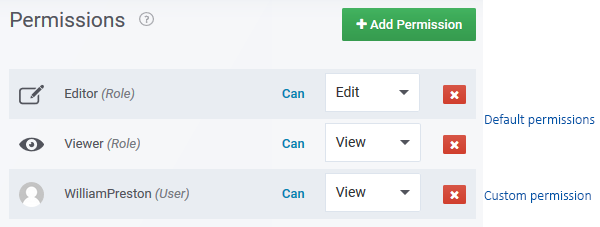
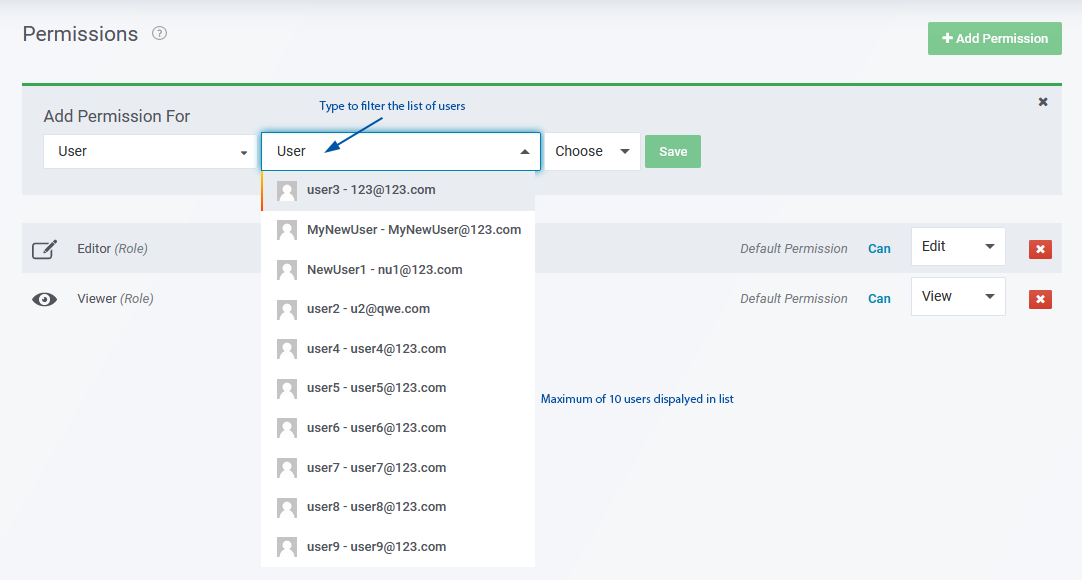
Permissions
Alter the default dashboard permissions. All dashboards inherit their parent folder permissions, in addition, dashboard editors are able to apply custom permissions specific to that dashboard.
For details on managing permissions and how they interact with users and data visibility, see Statseeker Dashboards and the Dashboard Manager.
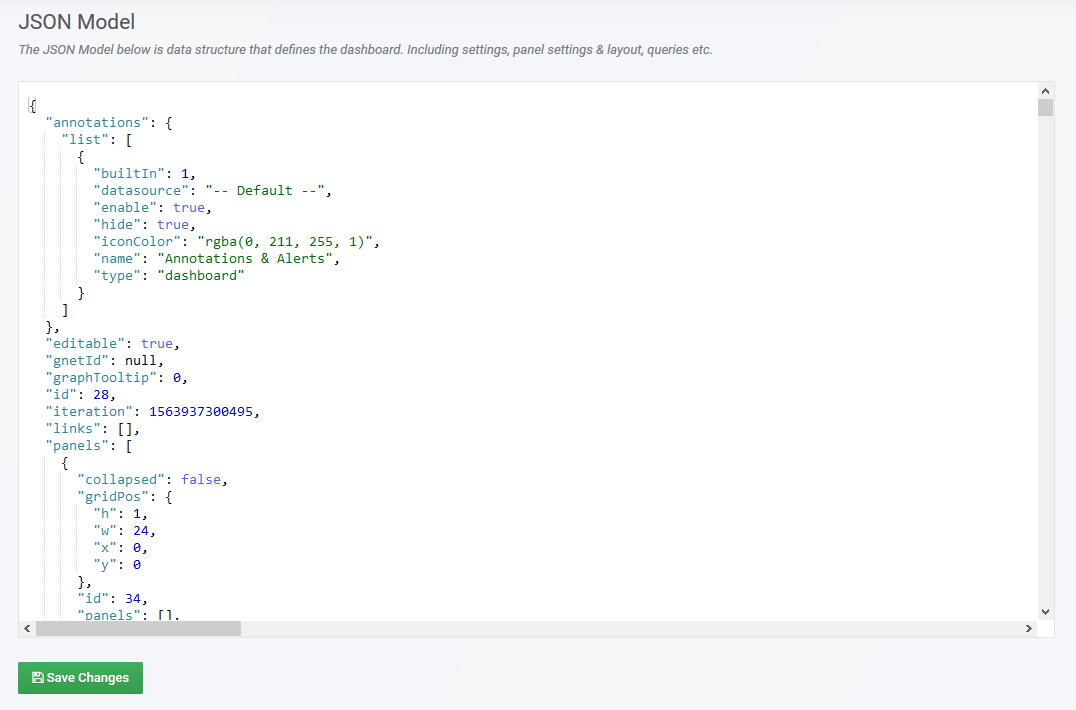
JSON Model
View and edit (not advised) the raw JSON configuration for the dashboard.
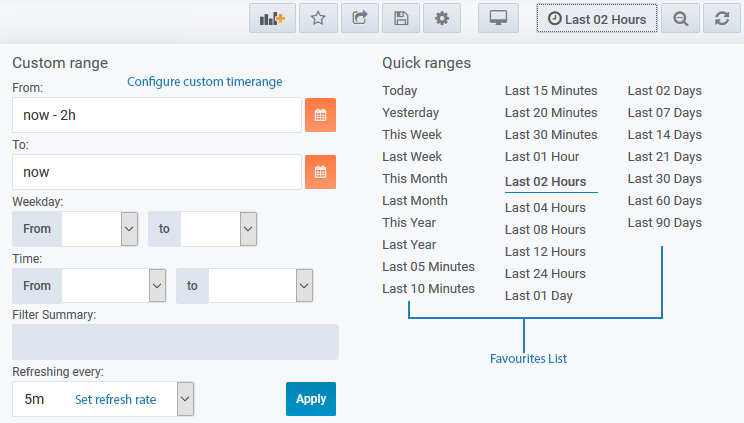
Time Filter
The dashboard time filter is used to define the time range of the data to be displayed in the dashboard, as well as refresh rate for the dashboard content.
The dashboard time filter is applied to all panels within the dashboard. This time filter can be overridden with a panel level override set in the Time Range tab of the panel.
The dashboard time filter cannot handle complex timefilters such as those featuring:
- Multiple time ranges (see Note below for clarification)
- “OR”, “AND”, or “NOT” operators
These timefilters cannot be applied, and if they are contained in your TimeFilter Favorites list, then they will be hidden from that list in the dashboards. However, these timefilters can still be used with your reports, and a report featuring such a timefilter can be embedded in a dashboard via the Text/HTML panel (set Mode = Link).
- “(7am – 11am) and (2pm – 4pm)” – not supported
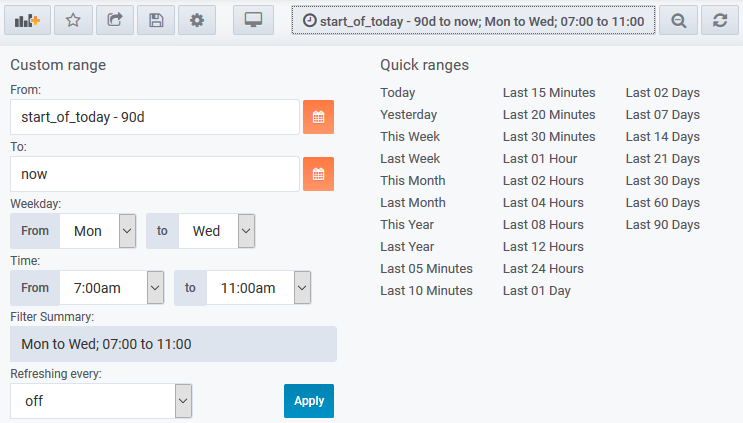
There is no requirement for the reporting period to be a continuous block of time, a time filter with a single ‘time of day’ across multiple days is supported:
- “(7am – 11am), Mon – Wed, for the last 3months” – supported
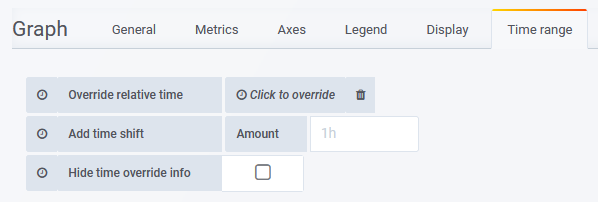
Panel-Specific Timefilter Overrides
Dashboard editors can specify an override to the dashboard-wide timefilter from within the panel configuration. Panels with time range overrides refresh, but do not alter their timefilter, when a user:
- Alters the dashboard time filter settings
- ‘Zooms in’ on a graph panel on the same dashboard, changing the timefilter applied to the dashboard
Using panel specific timefilter overrides allows you to easily create dashboards which compare the same data (entity and metric) for different time ranges:
- Today vs yesterday
- This week so far vs last week
This feature is available from the Time Range tab within panel configuration for Graph, Table, Singlestat, Pie Chart, Image Map, and Worldmap panels.
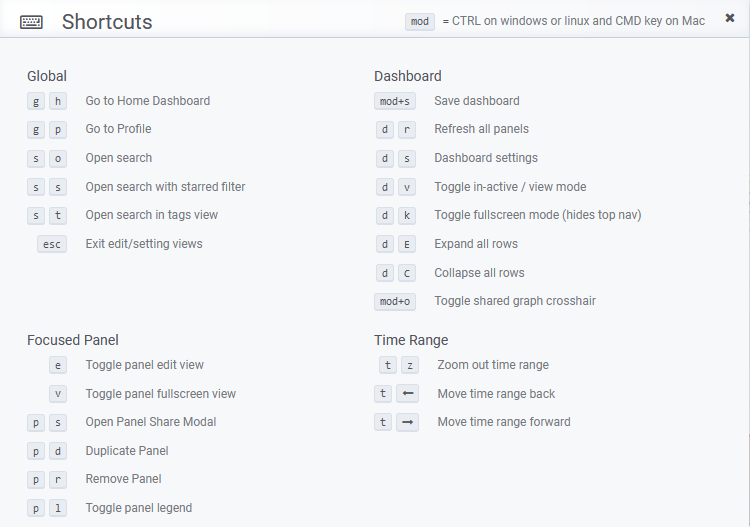
Keyboard Shortcuts
There are a number of keyboard shortcuts available when working with dashboards, a summary of these can be accessed with the shortcut: Shift/Cmd + ?.
Dashboard Favorites
Dashboards can be tagged as a ‘favorite’ for easy access from both the Dashboards heading in the main navigator and from the Dashboards Home page.
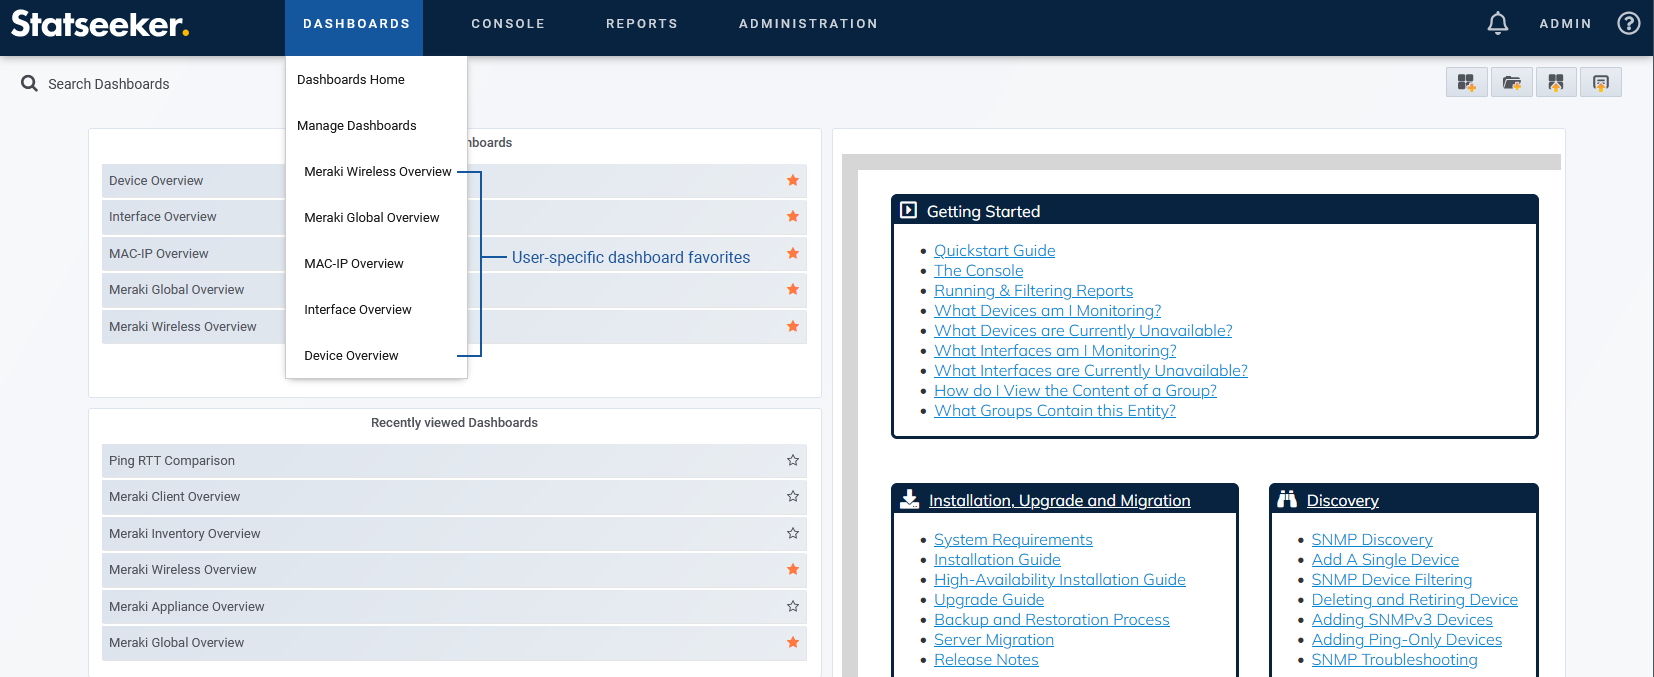
Star/Favorite a Dashboard from Dashboard Home
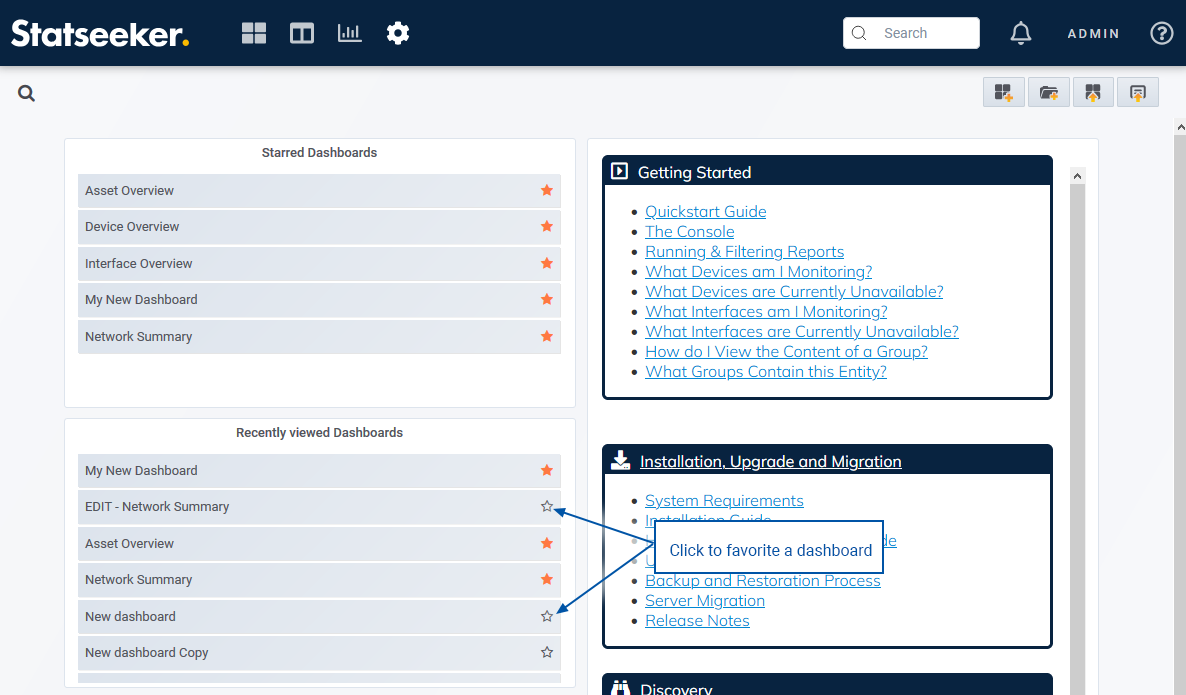
Star/Favorite a Dashboard from within a Dashboard
A dashboard favorite can also be configured as the default landing page when the Dashboard item in the main navigator is selected, for details see User Preferences.