Index
- Overview
- Pie Chart Configuration
- Example Configurations
Overview
The pie chart panel allows you to present aggregated timeseries, configuration or asset data as a pie or donut chart.
Clicking the panel header opens the panel menu, offering the following options:
- View – view the panel in fullscreen mode
- Edit – edit the panel configuration
- Share – options for sharing the panel contents with others, both internal and external to your organization
- More
- Duplicate – place a duplicate of the panel on the current dashboard
- Copy – copy the dashboard configuration in order to add the panel to another dashboard
- Panel JSON – view/edit the JSON underlying the panel configuration
- Remove – delete the panel from the dashboard
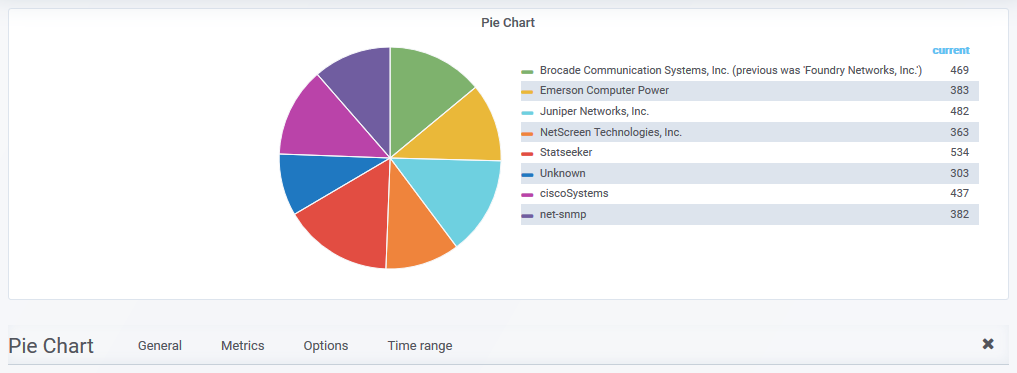
Pie Chart Configuration
You can edit the pie chart configuration by:
- Clicking the panel title to open the panel menu and selecting Edit
General
The General tab is used to configure the panel title, description and panel-level links.
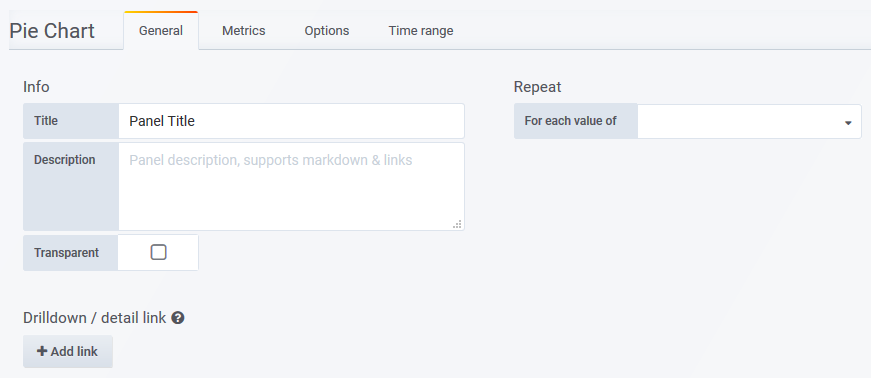
- Title – the panel title, displayed at the top
- Description – the panel description, displayed on hover of info icon in the upper left corner of the panel
- Transparent – if checked, removes the solid background of the panel (default not checked)
- Repeat – repeat a panel for each value of a variable, see Repeating Panels for details
- Drilldown / detail link – apply a panel-level link
- Type
- dashboard – link will target a Statseeker dashboard on the server
- absolute – link will target a URL, other protocols such as mailto:// and ssh:// can also be referenced
- report – link will target a Statseeker report on the server
- Dashboard/URL/Report – the dashboard/URL/report to link to
- Tooltip – the tooltip to display on mouseover, can make use of dashboard variables
- Url Params – (requires Type = dashboard/report)key=value pairs to be appended to the end of the URL as parameters
- Include time range – include the current panel time range as a URL parameter
- Include variables – include all dashboard variables as key=value pairs to be appended to the end of the URL as parameters
- Open in a new tab – open the linked destination in a new tab
- Type
Metrics
The Metrics tab is used to configure the data series to be graphed. What options are available in the Metrics tab depends upon which Query Type is being used, see Query Types for details.
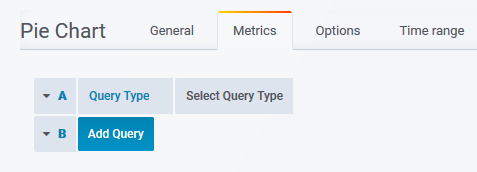
The pie chart requires that you specify:
- A field to Group By
- A single unique value field be specified in Fields (the ID field is unique in all instances, use this)
In most instances, the Label should be set to the field specified in Group By. For example, if you group by Location, each pie segment will represent a location. If the Label is also set to Location, then each segment will be labeled with the location it represents.
Options
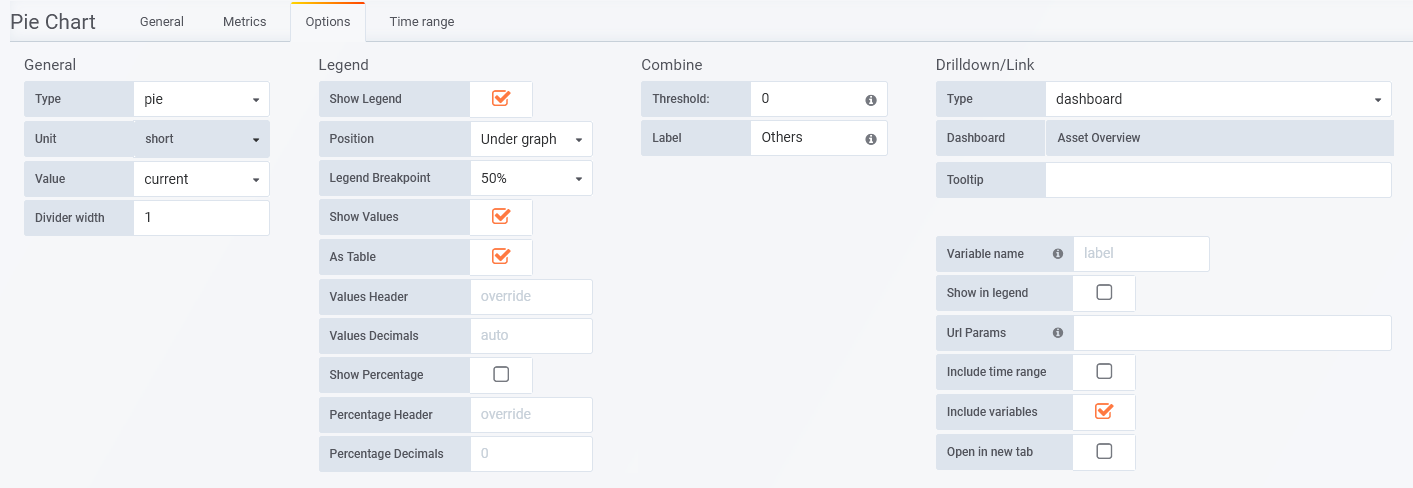
- General
- Type – set chart to pie/donut
- Unit – set the units to be displayed with the values
- Value – set the value to be charted
- Divider Width – set the size of the whitespace between segments
- Legend
- Show Legend – toggle legend
- Position – set legend position
- On graph – display the legend on the chart segments
- Font size – size of the displayed labels
- Under graph – display the legend under the chart
- Legend Breakpoint – the percentage of the panel height to assign to the legend
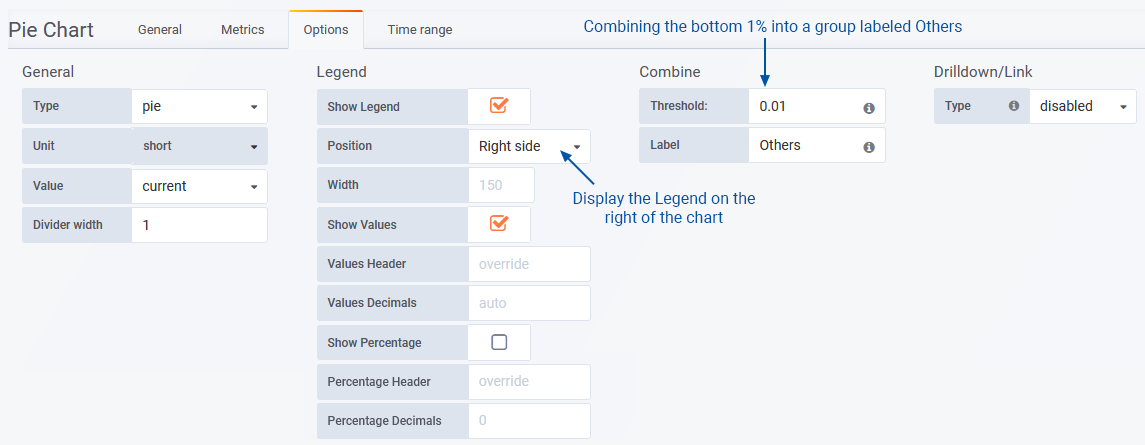
- Right side – display the legend on the right of the panel
- Width – minimum width (px) of the displayed legend
- On graph – display the legend on the chart segments
- Show Values – toggle display of segment values in the legend
- Values Header – an alternate header for the legend values column
- Values Decimals – the number of decimal places to display
- Show Percentage – display the segment percentage
- Percentage Header – an alternate header for the legend percentage column
- Percentage Decimals – the number of decimal places to display on the percentage
- Combine
- Threshold – threshold at which to aggregate all other series with a lower percentage of the graphed data. The value is specified as a decimal percentage (0.01 = 1%, 0.1 = 10%, 1.0 = 100%)
- Label – label for the series’ which have been aggregated due to being below the specified threshold
- Drilldown Link – apply a link to each chart segment and/or entry in the legend
- Type
- disabled – (default) no link functionality from pie-chart segments or legend entries
- dashboard – link will target a Statseeker dashboard on the server
- absolute – link will target a URL, other protocols such as mailto:// and ssh:// can also be referenced
- report – link will target a Statseeker report on the server
- Dashboard/URL/Report – the dashboard/URL/report to link to
- Tooltip – the tooltip to display on mouseover, can make use of dashboard variables
- Variable name – passes the segment label to the specified variable
- e.g. Variable name = Group: adds var-Group=<Segment Label> as a URL parameter to the destination dashboard, this will override/replace all/any other instances of var-Group= in the URL (requires Include Variables = true)
If left blank, the segment label is passed to var-label
- Show in legend – add a link icon to the legend
- URL Params: – specify additional parameters
- ${__label} – can be used to reference the segment label
- Include time range – include the current panel time range as a URL parameter
- Include variables – include all dashboard variables as key=value pairs to be appended to the end of the URL as parameters
- Open in a new tab – open the linked destination in a new tab
- Type
Time Range
Apply an override to the dashboard-wide timefilter. Panels with time range overrides refresh, but do not alter their timefilter, when a user:
- Alters the dashboard time filter settings
- ‘Zooms in’ on a graph panel on the same dashboard, changing the timefilter applied to the dashboard
Using panel specific timefilter overrides allows you to easily create dashboards which compare the same data (entity and metric) for different time ranges:
- Today vs yesterday
- This week so far vs last week
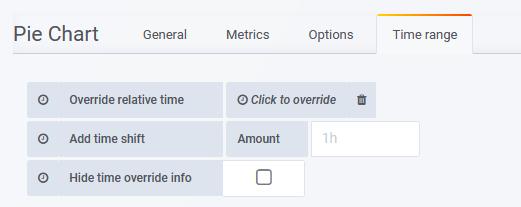
- Override relative time – specify a time range for the panel
- Add time shift – Amount – override the ‘now’ point with respect to the timefilter being applied to the panel
- Hide time override info – when unchecked, the current time override setting is displayed in the top-right of the panel header
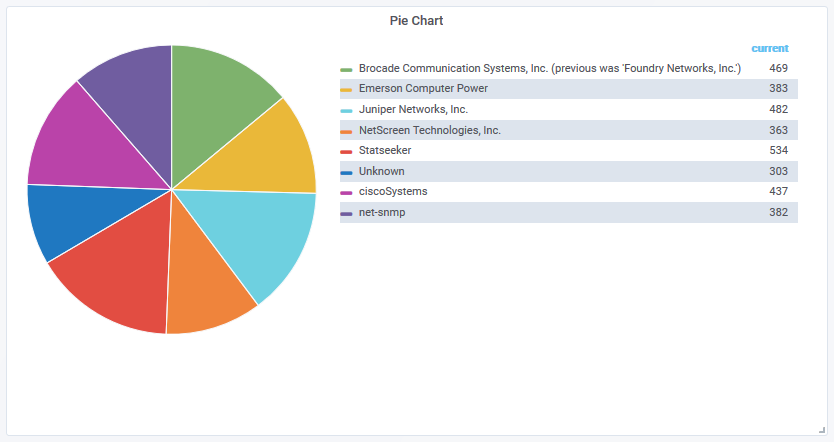
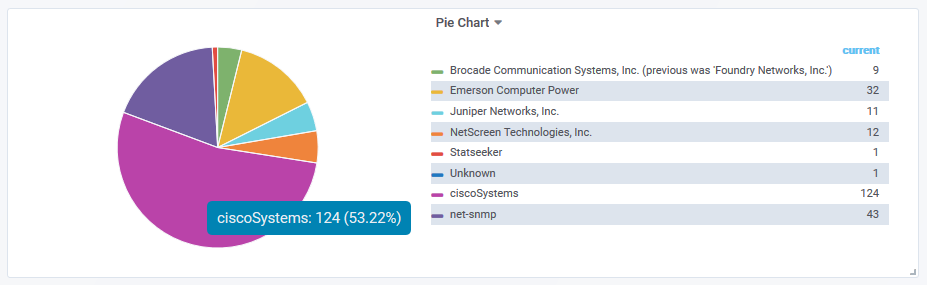
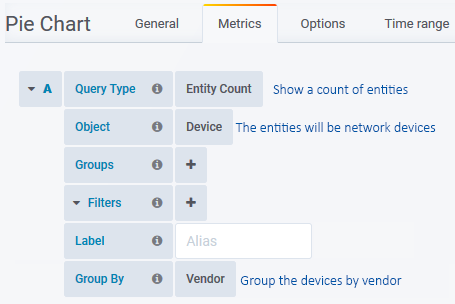
Example: Network Devices by Vendor
Display a breakdown of all monitored devices by their Vendor, and combine the smallest 1% into a single bucket.
Metrics Tab
Define the chart content.
Options Tab
Configure the presentation options for the chart.