Index
- Overview
- Panel Configuration
- Example Configurations
Overview
Display data related to geographical locations on a worldmap background.
This can also be achieved:
- For individual or bulk devices from Manage Devices
- As a bulk update via auto-grouping, see Using Auto-Grouping to Apply Bulk Configuration Changes
- Via the API
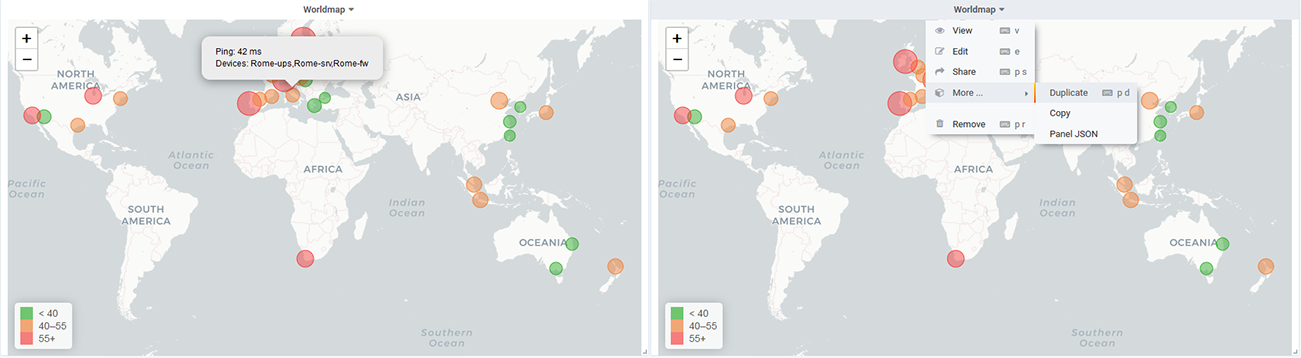
Clicking the panel header opens the panel menu, offering the following options:
- View – view the panel in fullscreen mode
- Edit – edit the panel configuration
- Share – options for sharing the panel contents with others, both internal and external to your organization
- More
- Duplicate – place a duplicate of the panel on the current dashboard
- Copy – copy the dashboard configuration in order to add the panel to another dashboard
- Panel JSON – view/edit the JSON underlying the panel configuration
- Remove – delete the panel from the dashboard
Panel Configuration
You can edit the map configuration by:
- Clicking the panel title to open the panel menu and selecting Edit
General
The General tab is used to configure the panel title, description, and panel-level links.
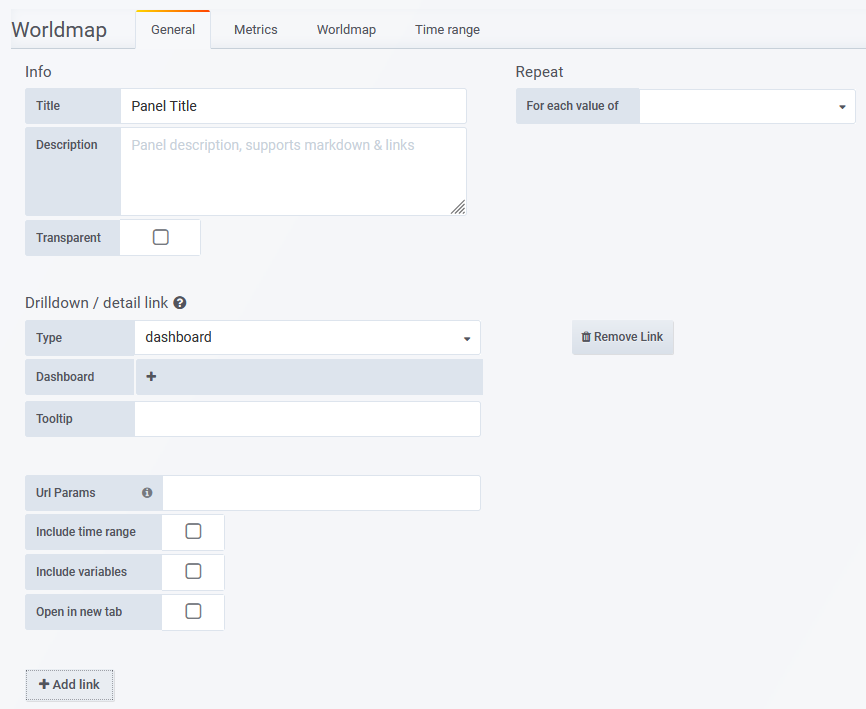
- Title – the panel title, displayed at the top
- Description – the panel description, displayed on hover of the ‘info’ icon in the upper left corner of the panel
- Transparent – if checked, removes the solid background of the panel (default not checked)
- Repeat – repeat a panel for each value of a variable, see Repeating Panels for details
- Drilldown / detail link – apply a panel-level link
- Type
- dashboard – link will target a Statseeker dashboard on the server
- absolute – link will target a URL, other protocols such as mailto: and ssh:// can also be referenced
- report – link will target a Statseeker report on the server
- Dashboard/URL/Report – the dashboard/URL/report to link to
- Tooltip – the tooltip to display on mouseover, can make use of dashboard variables
- Url Params – (requires Type = dashboard/report)key=value pairs to be appended to the end of the URL as parameters
- Include time range – include the current panel time range as a URL parameter
- Include variables – include all dashboard variables as key=value pairs to be appended to the end of the URL as parameters
- Open in a new tab – open the linked destination in a new tab
- Type
Metrics
The Metrics tab is used to configure the data to display. What options are available in the Metrics tab depends upon which Query Type is being used, see Query Types for details. The available query types for the Worldmap panel are:
- Value by Location
- Count by Location
By default, the first field specified in the query configuration is used to calculate circle sizes. The fields may be re-ordered in the Metrics tab by dragging the fields, and the default field (first specified in Metrics tab > Fields) can be overridden by specifying a field to use in Worldmap tab > Circle Properties > Field.
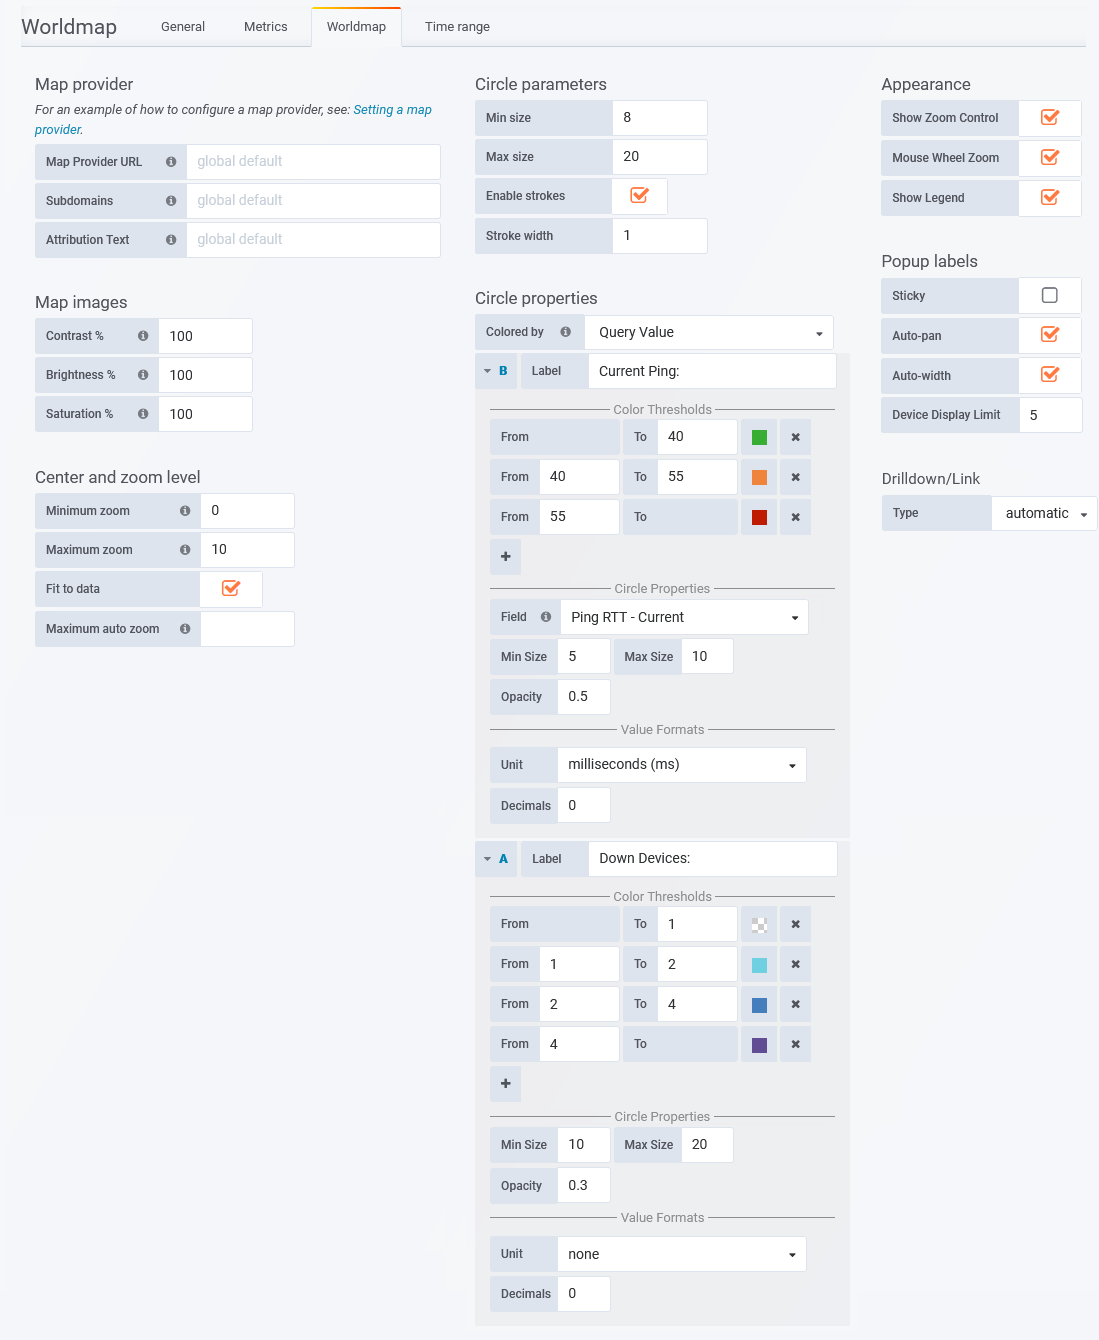
Worldmap
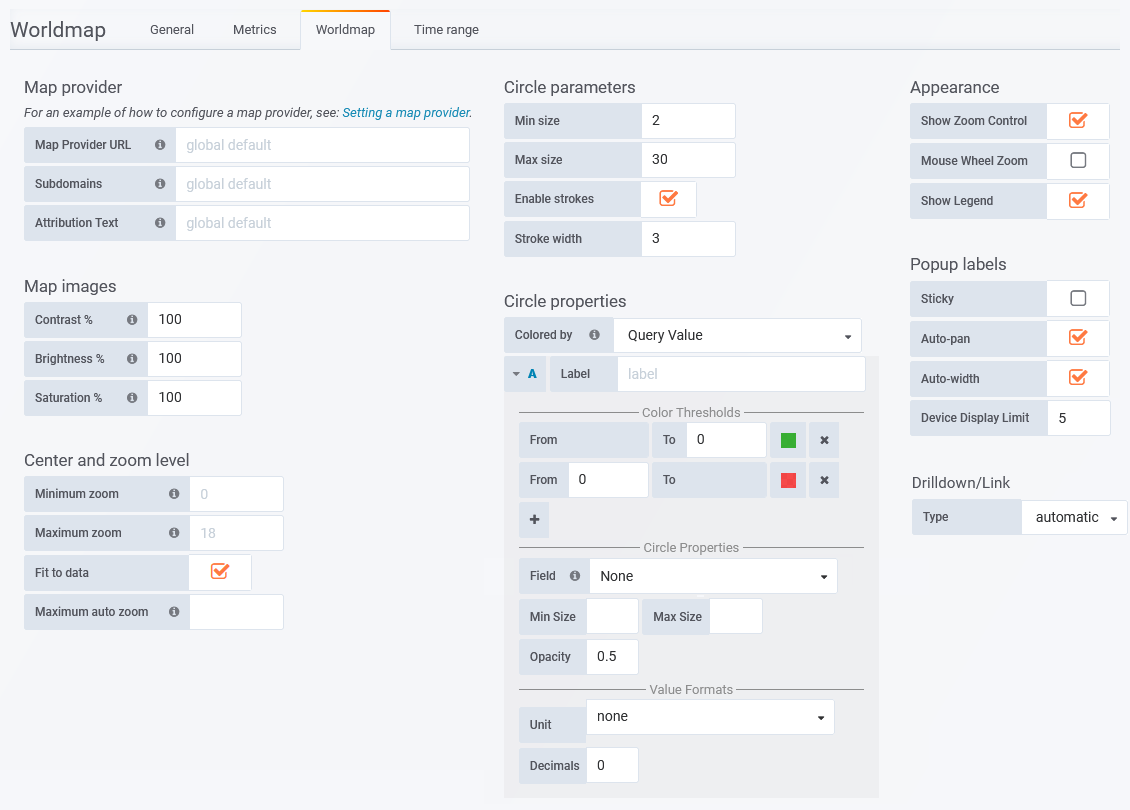
The Worldmap tab is used to configure the display of the data specified in the Metrics tab.
Map provider
This section is used to override the default map provider and is only available when Dashboard Preferences > Worldmap Preferences > Allow Custom Map Providers is enabled.
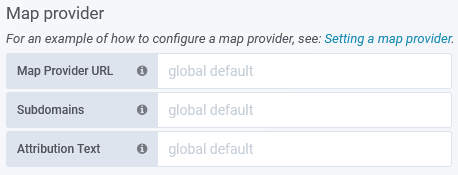
- Map Provider URL – Specify the URL used to access an alternate tile map service. The URLs for these services feature a number of notable parameters to identify the resource being displayed. These parameters are:
- {s} – (optional) a comma-separated list of subdomains, typically used by externally hosted services to spread the request load across multiple resources
- {x} – the X-coordinate of the map tile
- {y} – the Y-coordinate of the map tile
- {z} – the zoom level of the map
The order and location of these parameters within the URL may vary between providers. Refer to your map service provider’s documentation for the appropriate URL or utilize one of the example configurations provided below.
Note: Statseeker requires that the {x}, {y}, and {z} parameters are specified in lower-case.- If your provider documentation specifies the server URL as: https://maps-for-free.com/layer/relief/z{Z}/row{Y}/{Z}_{X}-{Y}.jpg
- Statseeker requires the URL to be specified as: https://maps-for-free.com/layer/relief/z{z}/row{y}/{z}_{x}-{y}.jpg
- Subdomains – optionally, list the map provider subdomains to use. Each value in this string will be considered a valid subdomain for the {s} parameter in the Default Map Provider URL. This is a string of comma-separated values, no spaces. See your map service provider’s documentation for requirements.
Example: a,b,c or mapsub1,mapsub2,mapsub3
- Attribution Text – enter any licensing attribution content required by your map service provider, see your map service provider’s documentation for requirements
Example Map Provider URL Configurations
| Map | Map Provider URL | Attribution Text | Subdomains |
| OpenStreet:Default | http://{s}.tile.openstreetmap.org/{z}/{x}/{y}.png | © OpenStreetMap | a,b,c |
| ArcGIS:NatGeo | https://services.arcgisonline.com/ArcGIS/rest/services/NatGeo_World_Map/MapServer/tile/{z}/{y}/{x} | Sources: National Geographic, Esri, DeLorme, HERE, UNEP-WCMC, USGS, NASA, ESA, METI, NRCAN, GEBCO, NOAA, iPC | |
| maps-for-free | https://maps-for-free.com/layer/relief/z{z}/row{y}/{z}_{x}-{y}.jpg | © OpenStreetMap contributors | |
| Esri:Topo | https://services.arcgisonline.com/ArcGIS/rest/services/World_Topo_Map/MapServer/tile/{z}/{y}/{x}.jpg | Sources: Esri, HERE, Garmin, Intermap, increment P Corp., GEBCO, USGS, FAO, NPS, NRCAN, GeoBase, IGN, Kadaster NL, Ordnance Survey, Esri Japan, METI, Esri China (Hong Kong), (c) OpenStreetMap contributors, and the GIS User Community | |
| OpenTopo | https://{s}.tile.opentopomap.org/{z}/{x}/{y}.png | map data: © OpenStreetMap contributors, SRTM | map style: © OpenTopoMap (CC-BY-SA) | a,b,c |
| CartoDB Positron – light theme | https://{s}.basemaps.cartocdn.com/rastertiles/light_all/{z}/{x}/{y}.png | © OpenStreetMap © CartoDB | a,b,c,d |
| CartoDB Positron – dark theme | https://{s}.basemaps.cartocdn.com/rastertiles/dark_all/{z}/{x}/{y}.png | © OpenStreetMap © CartoDB | a,b,c,d |
Map images
Contains presentation options for the assigned map background images.
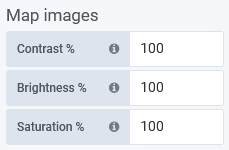
- Contrast – alter the contrast of the map background from the default value (100%)
- Brightness – alter the brightness of the map background from the default value (100%)
- Saturation – alter the color saturation of the map background from the default value (100%)
Center & Zoom Level
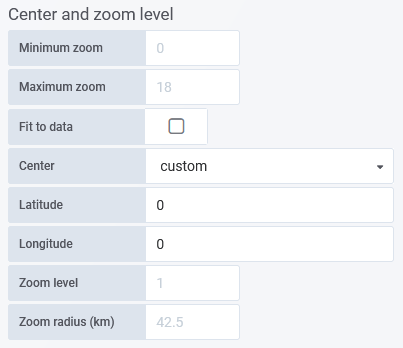
- Minimum Zoom – minimum zoom allowed, applied to both automatic and manual map scaling
- Maximum zoom – maximum zoom allowed, applied to manual map scaling
- Fit to data – scale map to fit current data
- Center – requires Fit to data = disabled, the location to be centered in the panel
- Latitude – requires Center = Custom, specify the latitude of the custom map center
- Longitude – requires Center = Custom, specify the longitude of the custom map center
- Zoom level – requires Fit to data = disabled, default zoom level
- Zoom radius (km) – requires Fit to data = disabled, default zoom level. When supplied, this value will overwrite Zoom level.
- Maximum auto zoom – override Maximum zoom when Fit to data is enabled
Appearance
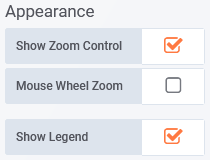
- Show Zoom Control – toggle display of zoom controls
- Mouse Wheel Zoom – toggle mouse-wheel zoom
- Show Legend – toggle legend
Circle Parameters
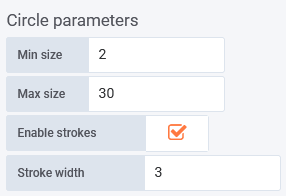
- Min size – minimum size for a circle in pixels
- Max size – maximum size for a circle in pixels
- Enable strokes– toggle to stroke circle boundary
- Stroke width – width of stroke in pixels
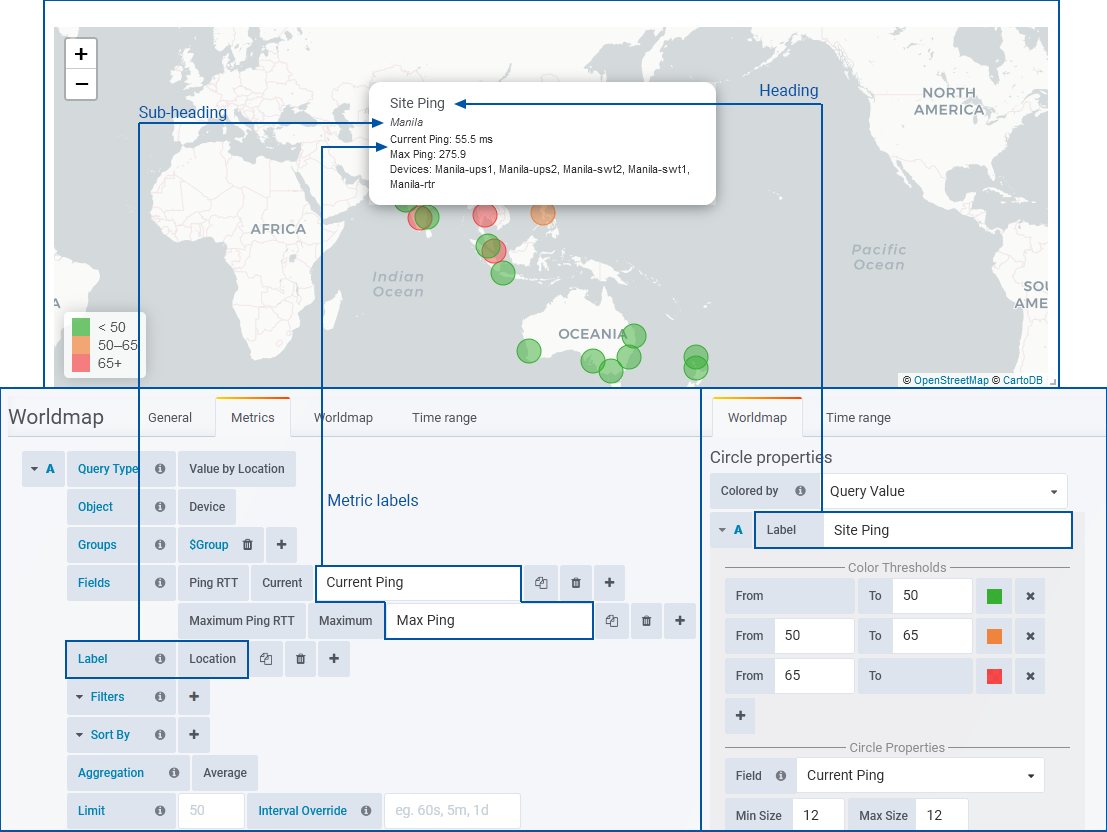
Circle Properties
Query specific settings and overrides for the appearance of the plotted points.
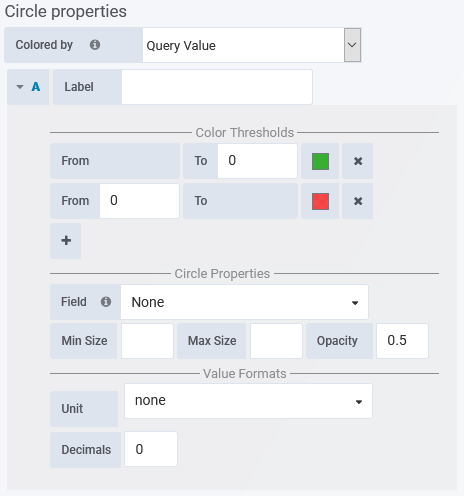
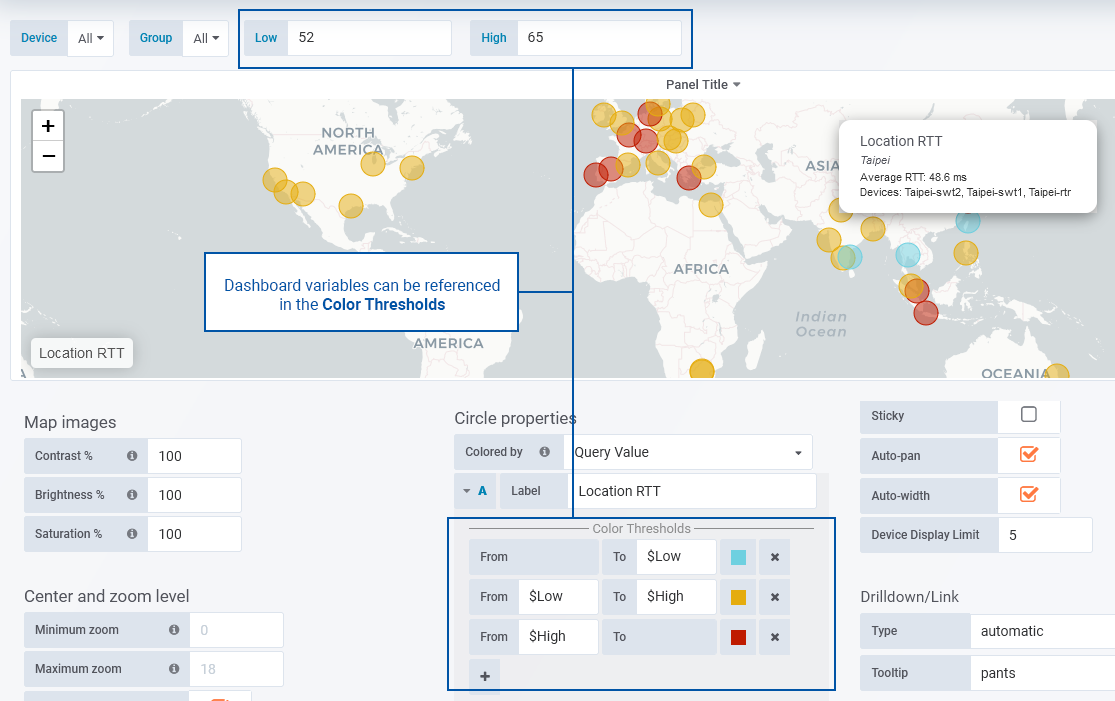
- Colored by –
- Query – a single color is applied to every circle (hot-spot) for that query
- Query Value – the circle color can be configured to vary according to the value for that circle
- Query Selector
 – expand/collapse additional circle property settings for that query, the letter displayed indicates which query (defined in the Metrics tab) the settings apply to
- Label – alternate label (instead of the full metric name) used in circle popups, and in the legend for multiple query panels
- Color – requires Colored by = Query, the color assigned to all circles for that query
- Color Thresholds – requires Colored by = Query Value, assign a set of value ranges, and a color to each
- Circle Properties
- Field – the specified field is used to calculate the size of the circle, defaults to the first field specified in the query configuration in the Metrics tab
- Min Size – minimum size for circle
- Max Size – maximum size for a circle
- Opacity – range 0 – 1 circle opacity
- Value Formats
- Unit – unit displayed in the pop-up for the query values
- Decimals – decimals displayed in the pop-up for the query values
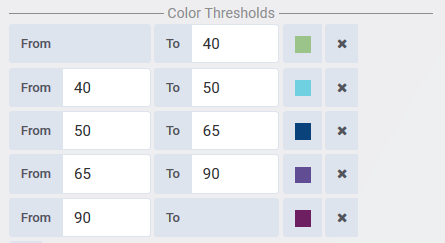
- The range limits should overlap as shown in the example above
- Overlapping ranges are lower limit inclusive and upper limit exclusive
- When the panel features a single query, the ranges are also displayed in the panel legend
Popup labels
Labels that appear on mouse-over of map nodes/circles.
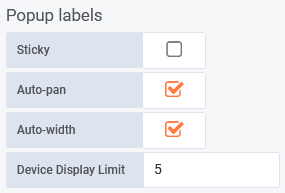
- Sticky – sticky labels require a click to hide
- Auto-pan – auto-pan panel to display full popup content
- Auto-width – resize popups to better fit content
- Device Display Limit – maximum number of records to display for a given circle
Up to 3 fields contribute to the labels displayed in a popup:
- Worldmap tab > Circle Properties > Label field – main heading
- Metrics tab > Label field – sub-heading, in the absence of a main heading, this value becomes the main heading
- Metrics tab > Fields – metric labels
Drilldown / Link
This setting allows you to apply links to each data point displayed on the map.
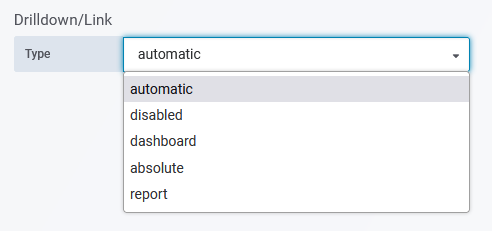
The available link types are:
- automatic – (default value) each data point links through to a tabular report detailing the device name, sysName, and specified metric value for each device aggregated into that data point
- disabled – no active link
- dashboard – each data point links through to a specified dashboard
- absolute – each data point links through to a specified URL
- report – each data point links through to a specified report
Additional options are available when using the dashboard, absolute, or report link types. These options allow the specification of the target and for parameters to be added to the link URL:
- Dashboard/URL/Report – the Dashboard/URL/Report to link to
- Variable name – passes a space-separated list of device names (those devices aggregated in the data point) to the specified variable
- e.g. Variable name = List: adds var-List=<Device_1>%20<Device_2>%20<Device_…>%20<Device_N> as a URL parameter to the destination dashboard, this will override/replace all/any other instances of var-List= in the URL (requires Include Variables = true)
If left blank, the list is passed to var-label
- URL Params: – specify additional parameters, a list of Worldmap-specific values is provided in the field tooltip
- ${_TITLE} – the query title
- ${_LABEL} – the combined values of all supplied label fields
- ${_COUNT} – the entity/event count (only valid for ‘Count by Location’ queries)
- ${_DEVICE_LIST} – list of device names associated with the data point
- ${_ID_LIST} – list of device IDs associated with the data point
- ${_LATITUDE} – latitude associated with the data point
- ${_LONGITUDE} – longitude associated with the data point
- ${__field_<FIELD_ALIAS>} – the field alias (not valid for ‘Count by Location’ queries)
This is the value displayed in Circle Properties > Field, with spaces replaced by underscores.
Example:
Ping RTT – Current should be specified as ${__field_Ping_RTT_-_Current}
- Include time range: – when enabled, the worldmap timefilter is passed through, and where possible, applied to the link target
- Include variables: – when enabled, the values of dashboard variables are passed through to the link target. where they are applied to variables with the same name
- Open in new tab: – when enabled, the link target is opened in a new browser tab
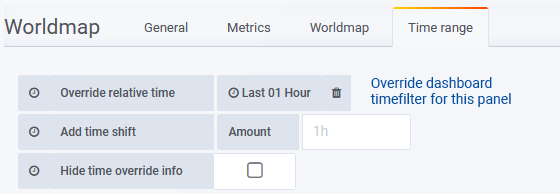
Time Range
Apply an override to the dashboard-wide timefilter. Panels with time range overrides refresh, but do not alter their timefilter, when a user:
- Alters the dashboard time filter settings
- ‘Zooms in’ on a graph panel on the same dashboard, changing the timefilter applied to the dashboard
Using panel-specific timefilter overrides allows you to easily create dashboards that compare the same data (entity and metric) for different time ranges:
- Today vs yesterday
- This week so far vs last week
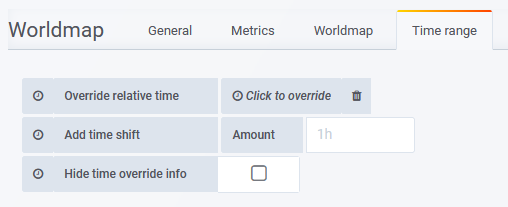
- Override relative time – specify a time range for the panel
- Add time shift – Amount – override the ‘now’ point with respect to the timefilter being applied to the panel
- Hide time override info – when unchecked, the current time override setting is displayed in the top-right of the panel header
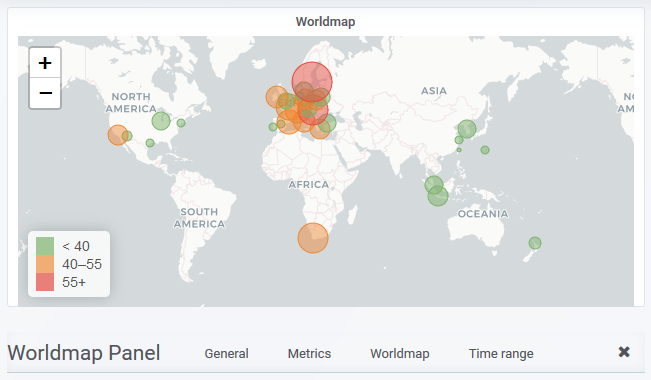
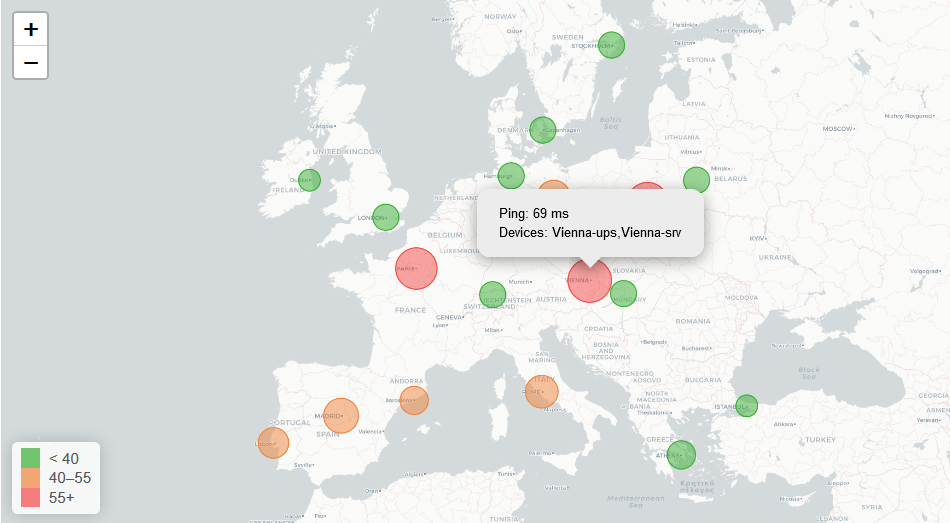
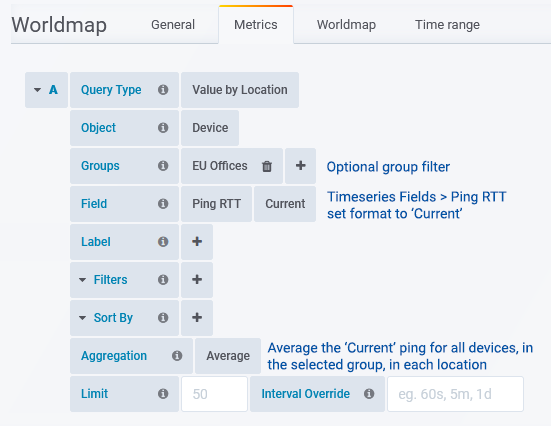
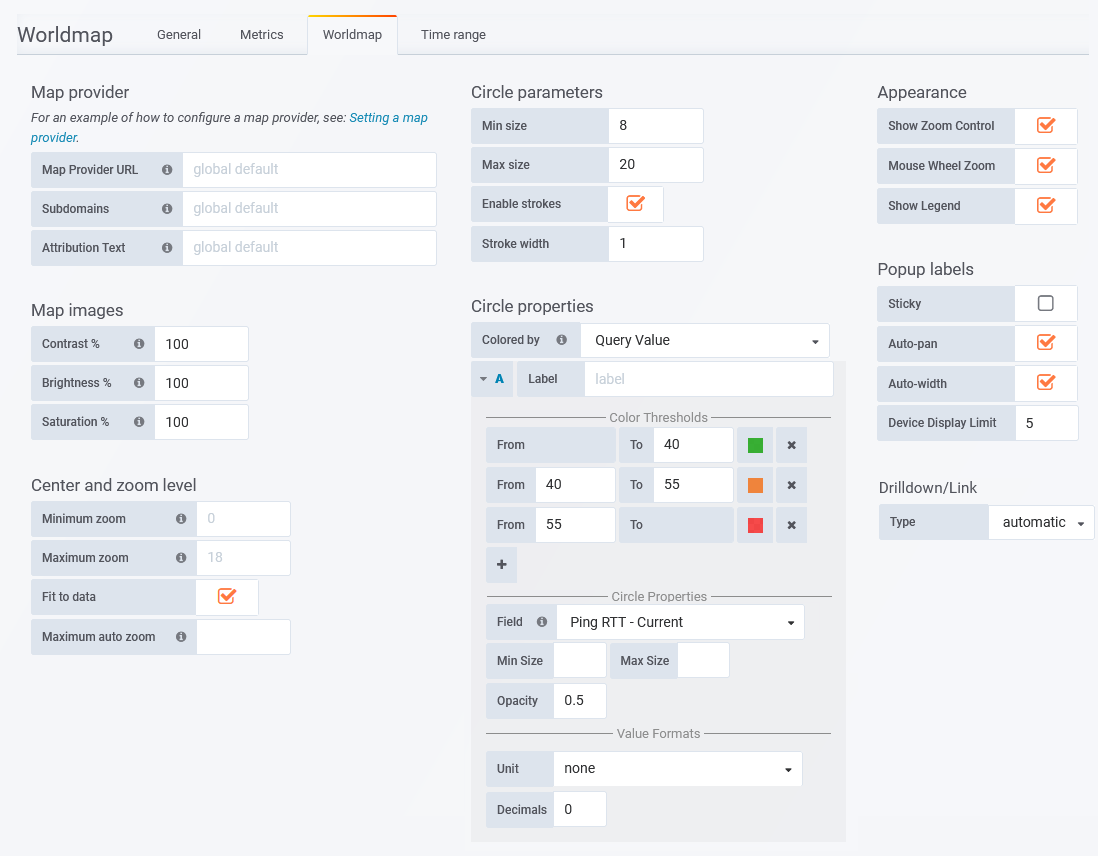
Example: Current Ping
This can also be achieved:
- For individual or bulk devices from Manage Devices
- As a bulk update via auto-grouping, see Using Auto-Grouping to Apply Bulk Configuration Changes
- Via the API
Presenting the current ping time, averaged across all devices, for select locations.
Metrics Tab
Worldmap Tab
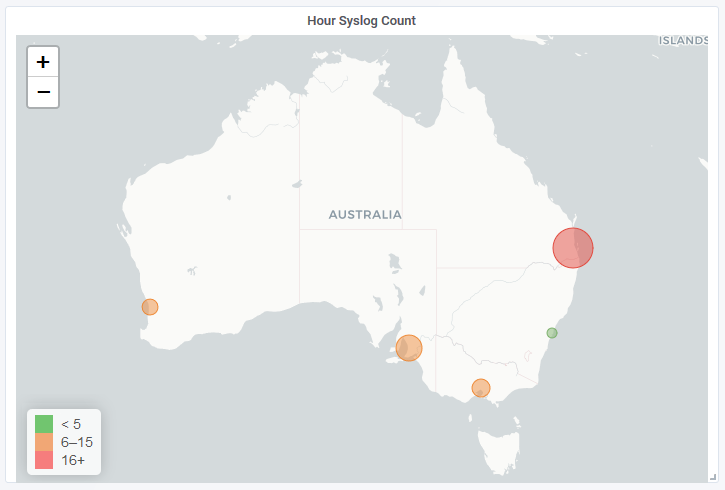
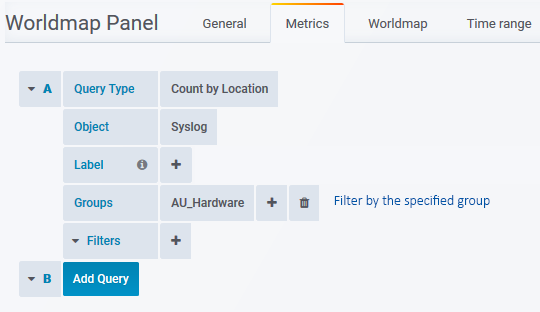
Example: Syslog Count
This can also be achieved:
- For individual or bulk devices from Manage Devices
- As a bulk update via auto-grouping, see Using Auto-Grouping to Apply Bulk Configuration Changes
- Via the API
Indication of the number of syslog messages for a select group of devices over the last hour.
Metrics Tab
Worldmap Tab
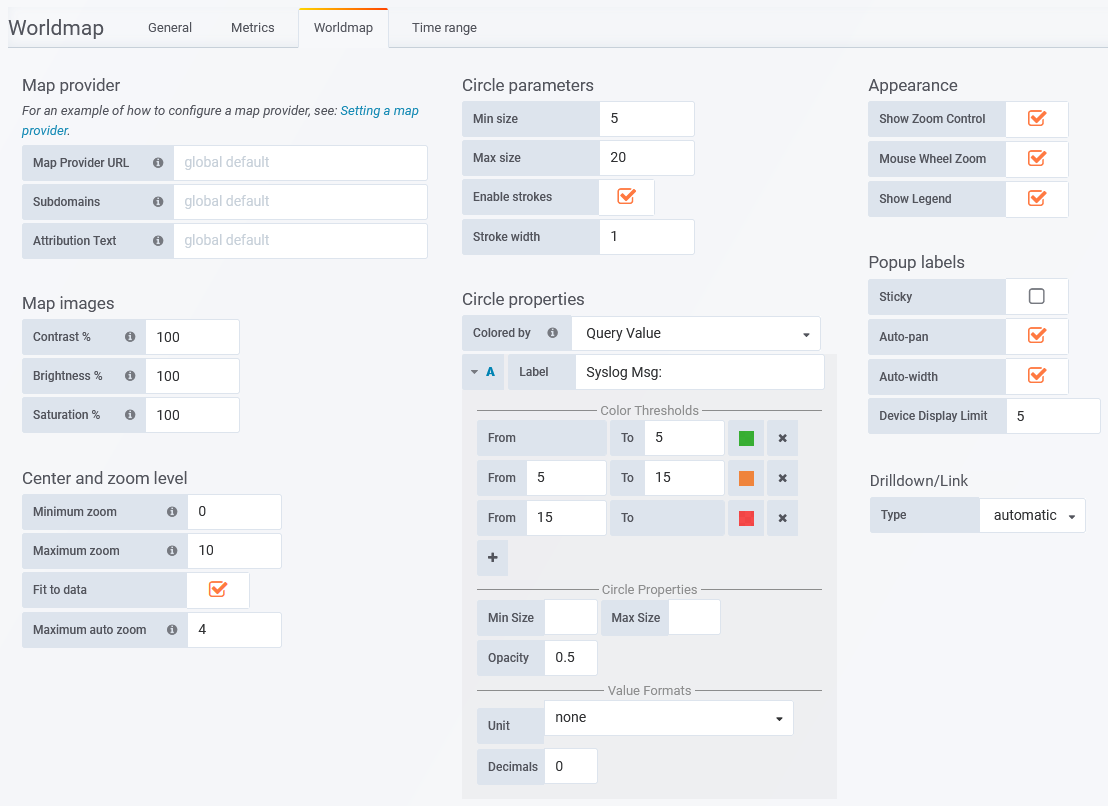
Time range Tab
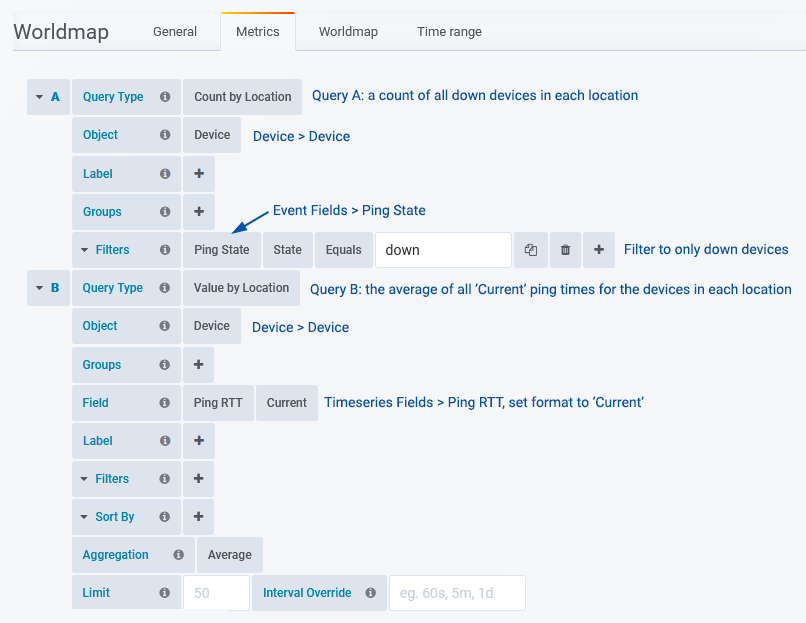
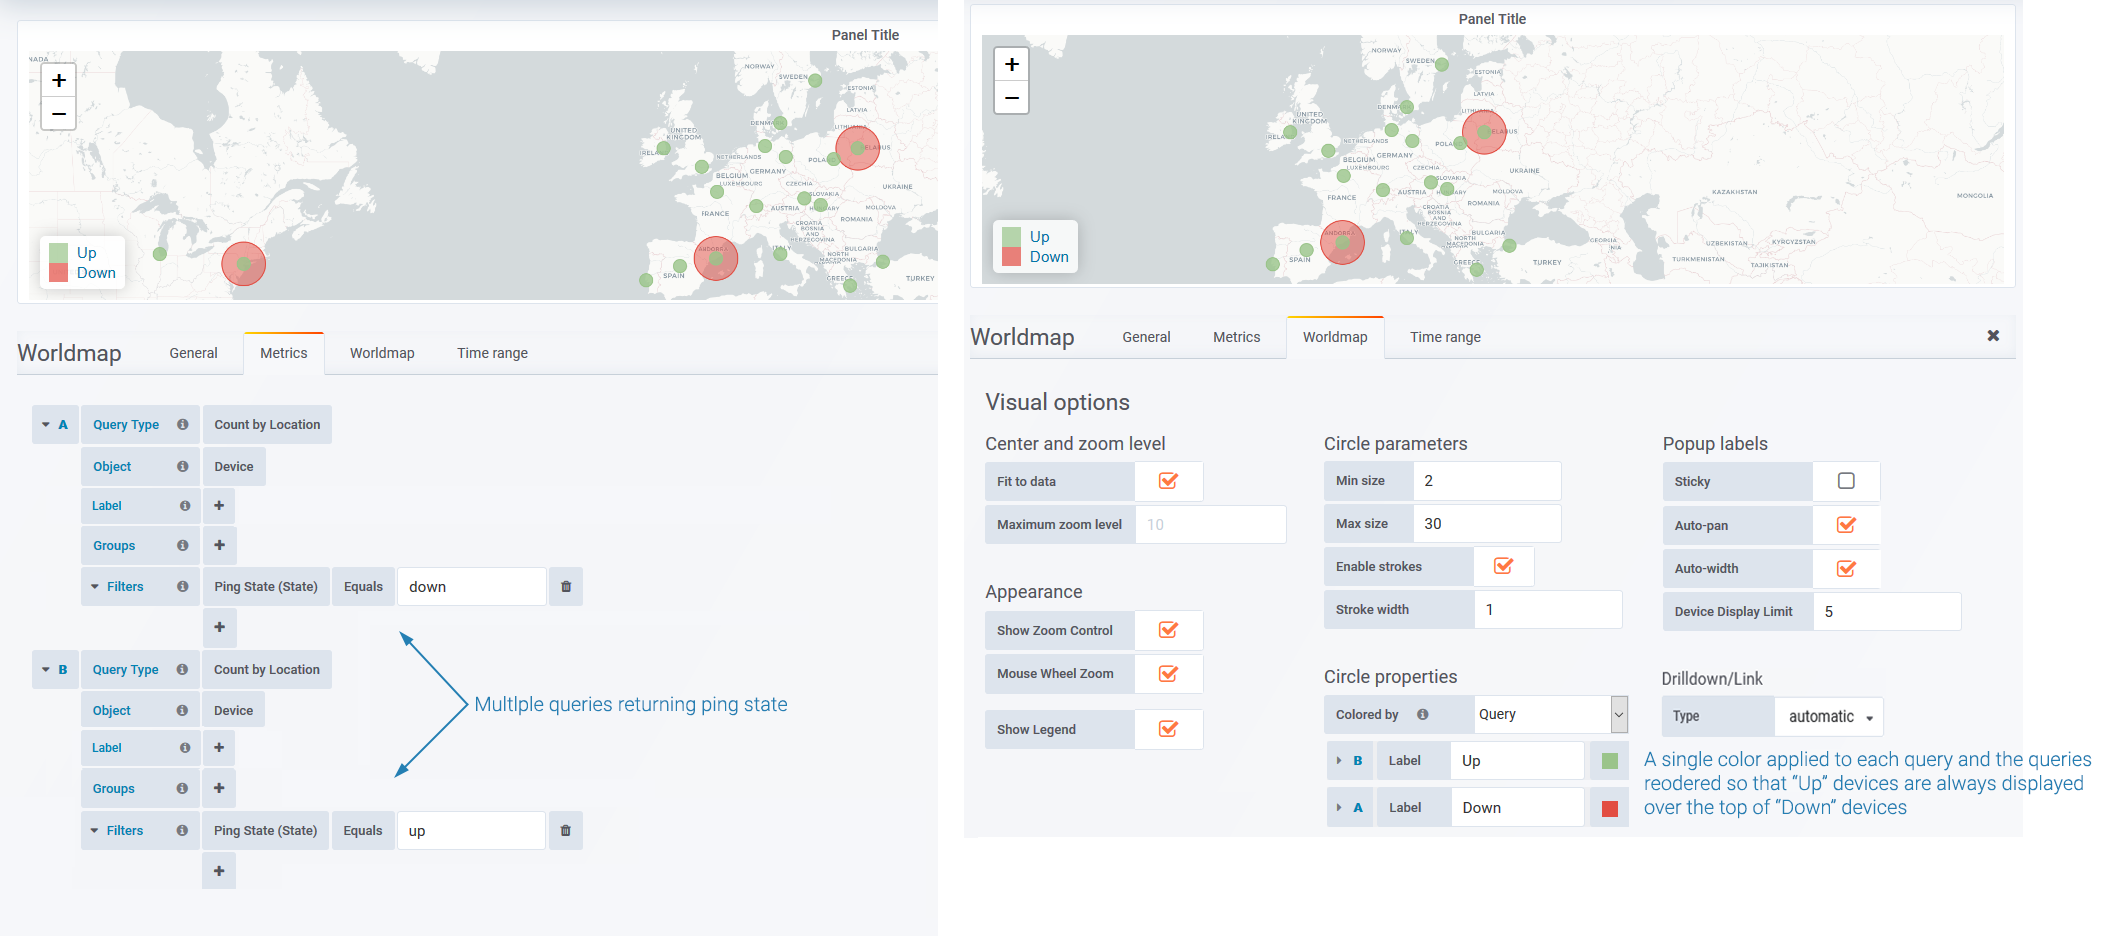
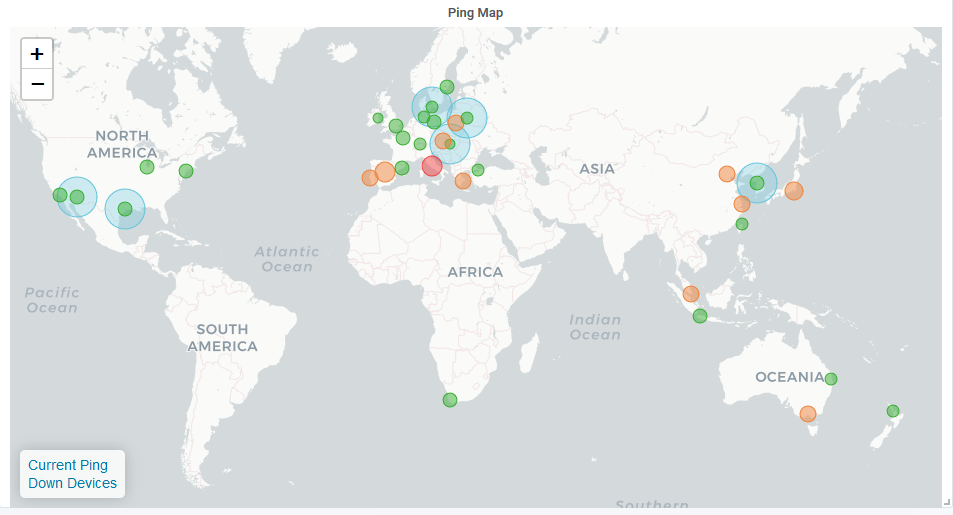
Example: Multi-Query Map
This can also be achieved:
- For individual or bulk devices from Manage Devices
- As a bulk update via auto-grouping, see Using Auto-Grouping to Apply Bulk Configuration Changes
- Via the API
This map panel has been configured to display indicators from two different queries and features query-specific node sizing and coloring. The two series being graphed in the panel are:
- Number of ‘down’ devices
- Average ping for all devices in the location, at the current time
Metrics Tab