Index
Overview
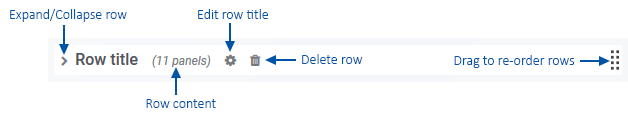
The collapsible Row allows you to group your dashboard panels. This can improve visibility and access to elements in dashboards with a large number of panels, and the use of rows can improve the performance of very busy dashboards.
Dashboards within collapsed rows are not refreshed with the rest of the dashboard, instead, they are refreshed when the row is opened. Collapsing rows containing unneeded panels can greatly improve the refresh time for other panels when using very long reporting periods.
Adding and Removing Panels
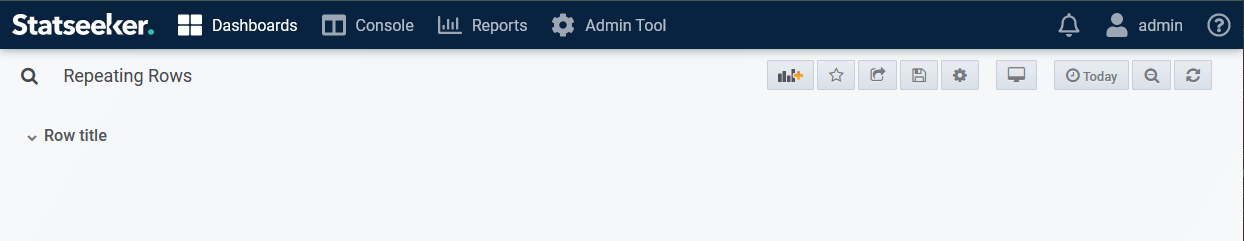
Rows are placed onto the dashboard expanded. When a row is collapsed, all panels under the row are added to the row and hidden within the collapsed row.
To add a panel to a row:
- Expand the row
- Move the panel to be under the row
- Collapse the row
To remove a panel from a row:
- Expand the row
- Move the panel to be above the row, or under another row
Repeating Rows
Rows and their content can also be duplicated for every value in a variable. This can be seen in the default Interface Overview dashboard. If you open this dashboard and then collapse the initial Summary row, then you will see something like the image below.
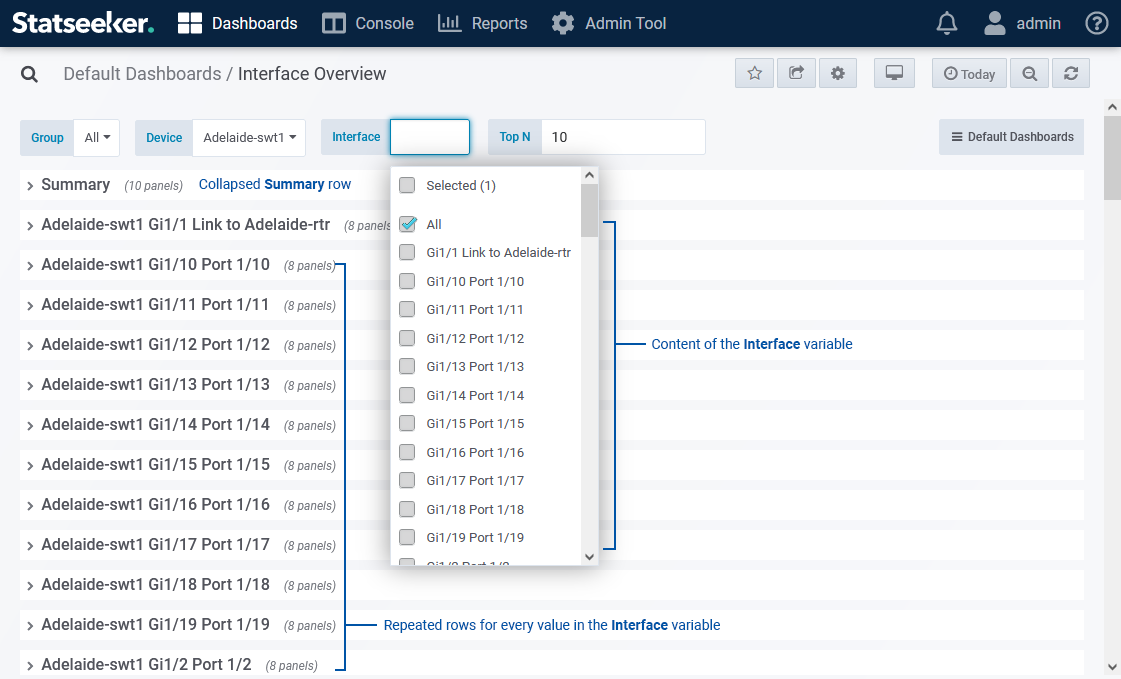
The Summary row contains summarized data from the device (traffic volumes, errors, and discards) and highlights notable ‘Top N’ interfaces (those with the highest traffic volumes, errors, and discards).
The repeated rows below the Summary row contain some of the same panels, but the content of these panels is filtered to the specific interface specified by the Interface variable. Once this has been done, you are able to use an option in the Row panel settings to duplicate the row, including the panels contained with the row, for each value in a variable. Specifying the Interface variable results in:
- A row for every interface on the selected device
- If a panel within the row is filtered by the Interface variable, then the content of the panel is filtered to the specific interface for that row
It may be preferable to collapse the row prior to duplication.
- When a dashboard is loaded, an API call is sent for each displayed panel, the response data is used to populate the panel
- Dashboards do not request data for panels in collapsed rows
- When a collapsed row is expanded, a call is made to populate the panels within the row
Consider our example of the Interface Overview dashboard. If all of the interface rows were expanded, and the selected device was a 48 port switch, then on load the dashboard needs to send an individual request to return data for each of 394 panels, resulting in an extended load time.
With the interface specific rows collapsed, on load the dashboard needs to send an individual request to return data for just the 10 panels in the Summary row. If the Summary row content highlights an interface of note, then that specific interface row can be expanded and populated very quickly.
Configuring Repeating Rows
The process to configure repeating rows can be summarized as:
- Add a Row panel
- Save the dashboard
- Add a dashboard variable
- Must enable Include All option
- The Sort applied will determine the order of repeated rows
- Add panels to the Row
- Within the Row panel settings:
- Set Repeat for: to the variable
If the specified variable is set to All, then the row will then be repeated for every value in the selected variable. If the panels contained within the row reference the variable as a filter, then that panel content will be filtered by the variable value specific to that row.
If the specified variable is set to a value other than All, then a single row for that selected value will be displayed.
Example Repeating Row Configuration
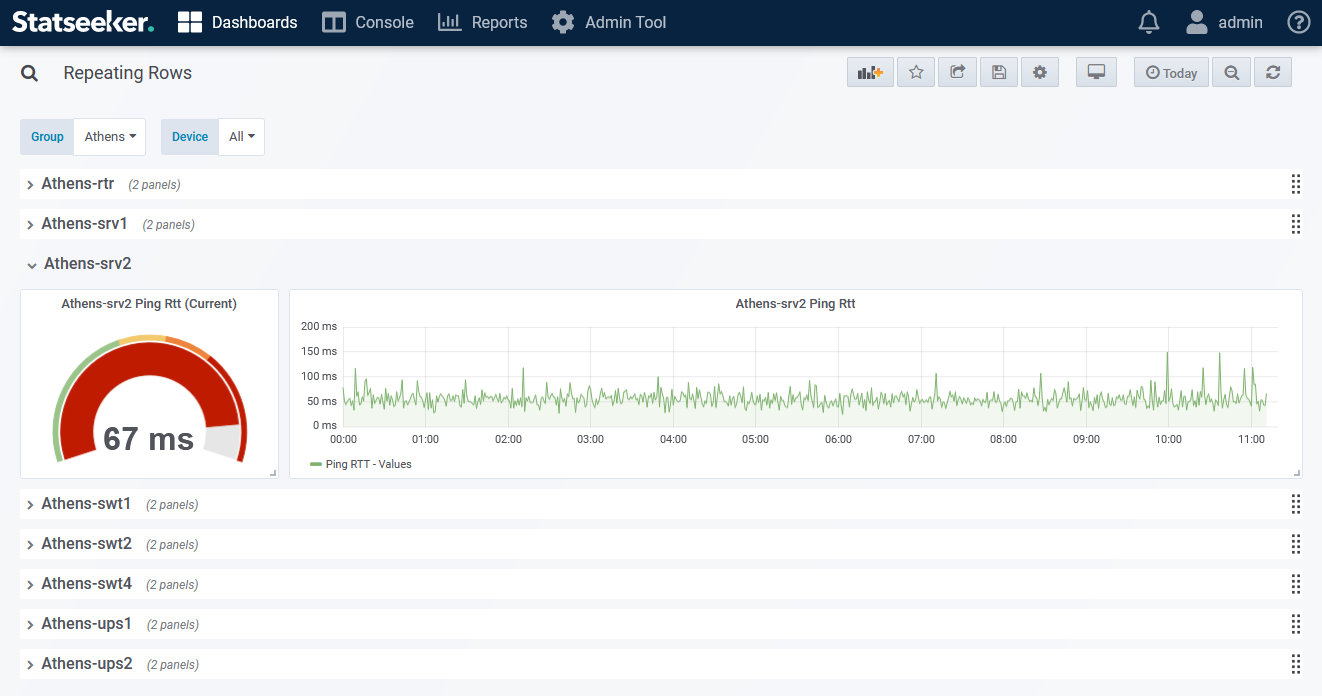
In this example we will create a dashboard which uses repeating rows to present the current and historical Ping Rtt values for every device in a selected group.
- Add a Row panel
If this is a new dashboard which hasn’t previously been saved, then you will need to save the dashboard prior to adding variables. if you aren’t familiar with using and referencing dashboard variables, see Dashboard Variables prior to proceeding.
- Add a Group variable, see Example: Group Selector for details
- Add a Device variable, see Example: Device Selector for details
- Set Group filter to your group variable
- Enable Include All option
- Return to the dashboard view
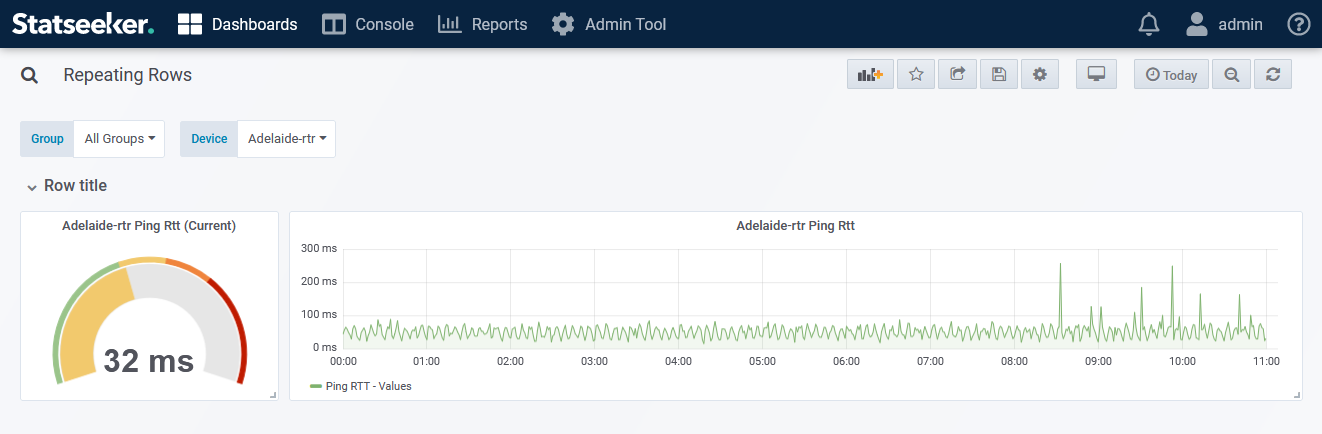
- Add and configure panels for the row content as needed
- Drag the panels below the expanded row
- Collapse the row to encapsulate the panels within the row
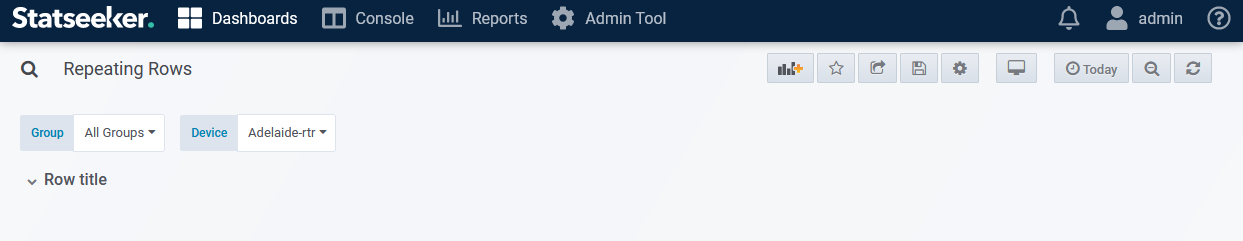
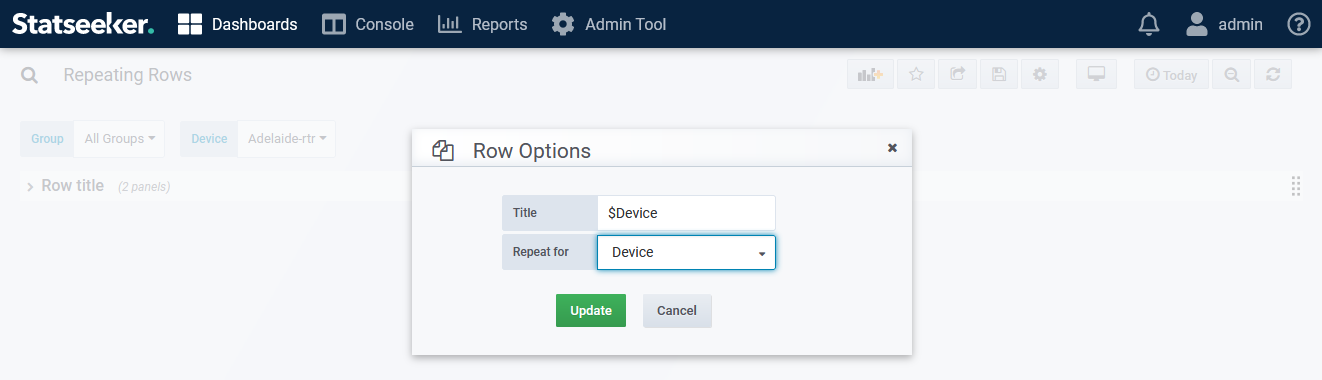
- Select row settings
- Reference the repeating variable name in the row Title
- Set Repeat for to the repeating variable
- Set the Device variable to All and Save the dashboard
Selecting a Group in the Group variable will then filter the dashboard, presenting a collapsed row for each device within the selected group. Each row will be titled accordingly and when expanded will present data specific to the selected device.