Index
Monitoring Cisco ACI Environments
Overview
Statseeker’s Cisco ACI monitoring package enables monitoring of ACI environments from your Statseeker server. This allows you to apply Statseeker’s data collection, storage, analytics, and alerting functionality to your ACI SDN deployments.
Requirements
There are no additional hardware requirements, but your Statseeker server and license may need to be updated to enable Cisco ACI monitoring. Statseeker’s Cisco ACI Monitoring requires:
- A Statseeker Subscription license
- That Cisco ACI Monitoring be enabled for your Statseeker license
For assistance with upgrading your Statseeker server and/or license, please contact your Regional Sales Representative.
ACI Configuration
If ACI Monitoring is enabled for your Statseeker license, then the default ACI reports will be visible in the Console, and a range of ACI data types will be available in Custom Reporting. These reports will remain blank until you configure Statseeker to communicate with your ACI deployment.
To configure the ACI package, you need to direct Statseeker to the APIC and provide credentials for communicating with the APIC.
- Select Administration > Statseeker Custom Services > ACI Configuration
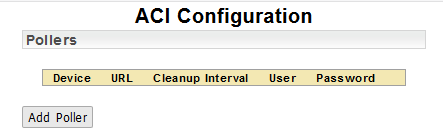
Once on the ACI Configuration screen:
- Click Add Poller
- If the APIC is already known to Statseeker, you can select from the Device dropdown; otherwise, select Add new device and provide the necessary details for Statseeker to contact the APIC
- Click Save
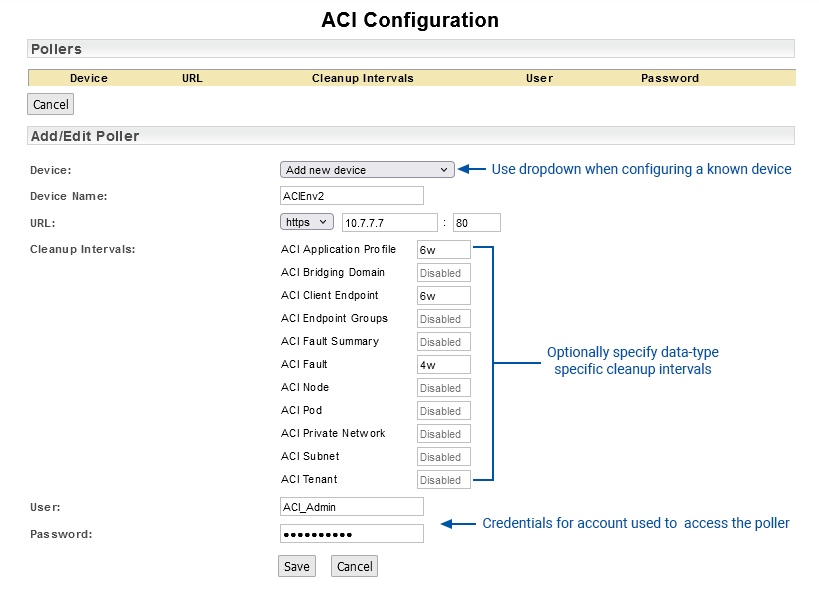
The configuration allows for a single URL per ACI environment.
- If your APICs are sharing a virtual IP, then use that
- If your APICS are not sharing a virtual IP, then enter the IP for any one of your APIC servers
A single APIC will provide Statseeker with all the details required to discover all of the nodes (controllers, spines, and leaves) used by that ACI deployment.
The Cleanup Interval refers to a timeframe for keeping references to entities that are no longer transmitting data. The nature of ACI will lead to services being moved and additional entities being made available to satisfy demand. Both of these actions can lead to your ACI monitoring referencing entities that are no longer active. These references can be kept indefinitely for historical reporting or discarded after not transmitting any data for the period specified by the Cleanup Interval.
The syntax to use specifying a Cleanup Interval is <integer><unit>, where unit is one of:
- s – seconds
- m – minutes
- h – hours
- d – days
- w – weeks
- y – years
Example: 4w
- Click Save
The APIC configuration will be saved. If you have multiple ACI deployments, you can configure the monitoring of those environments by adding another poller. Again, add the IP address for a single APIC per ACI environment.
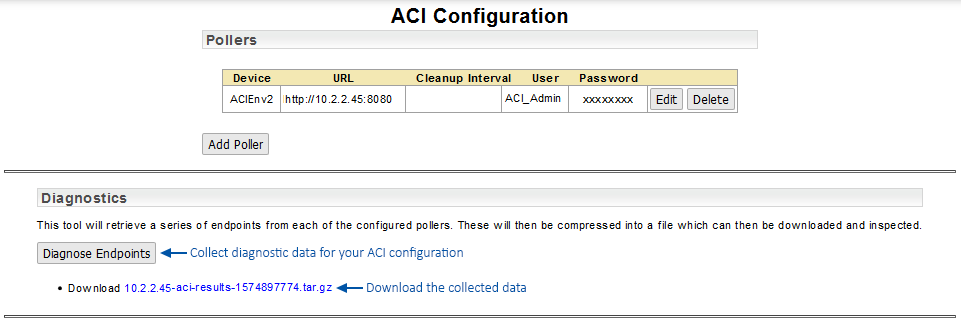
ACI Endpoint Downloader
The ACI Configuration screen also features an option to download your APIC endpoint configuration for diagnostic and troubleshooting purposes. The collected data is returned from your APIC in JSON format and compressed for transport. You can unpack the data for review or send it through to Statseeker Support if needed.
Cisco ACI Dashboards
Statseeker offers four default ACI Monitoring dashboards, located in the Default ACI Dashboards folder.
- ACI Summary Dashboard – a summary of all monitored ACI environments with views of system and node health and various fault breakdowns
- ACI Tenant Dashboard – details on all ACI Tenants and an overview of Tenant health
- ACI Bridge Domain Summary Dashboard – an overview of Bridge Domain configuration and health, with detailed breakdowns by Bridge Domain
- ACI Faults Dashboard – details on current and historical faults with breakdowns by APIC, Domain, and Fault Type
These are default dashboards and cannot be edited in any way, including altering permissions at the dashboard or folder level.
ACI Summary Dashboard
The ACI Summary dashboard provides a high-level summary of your monitored ACI environments, detailing:
- ACI environment configuration
- Current and historical health with a breakdown by environment and Node
- An ACI Fault summary and various fault breakdowns
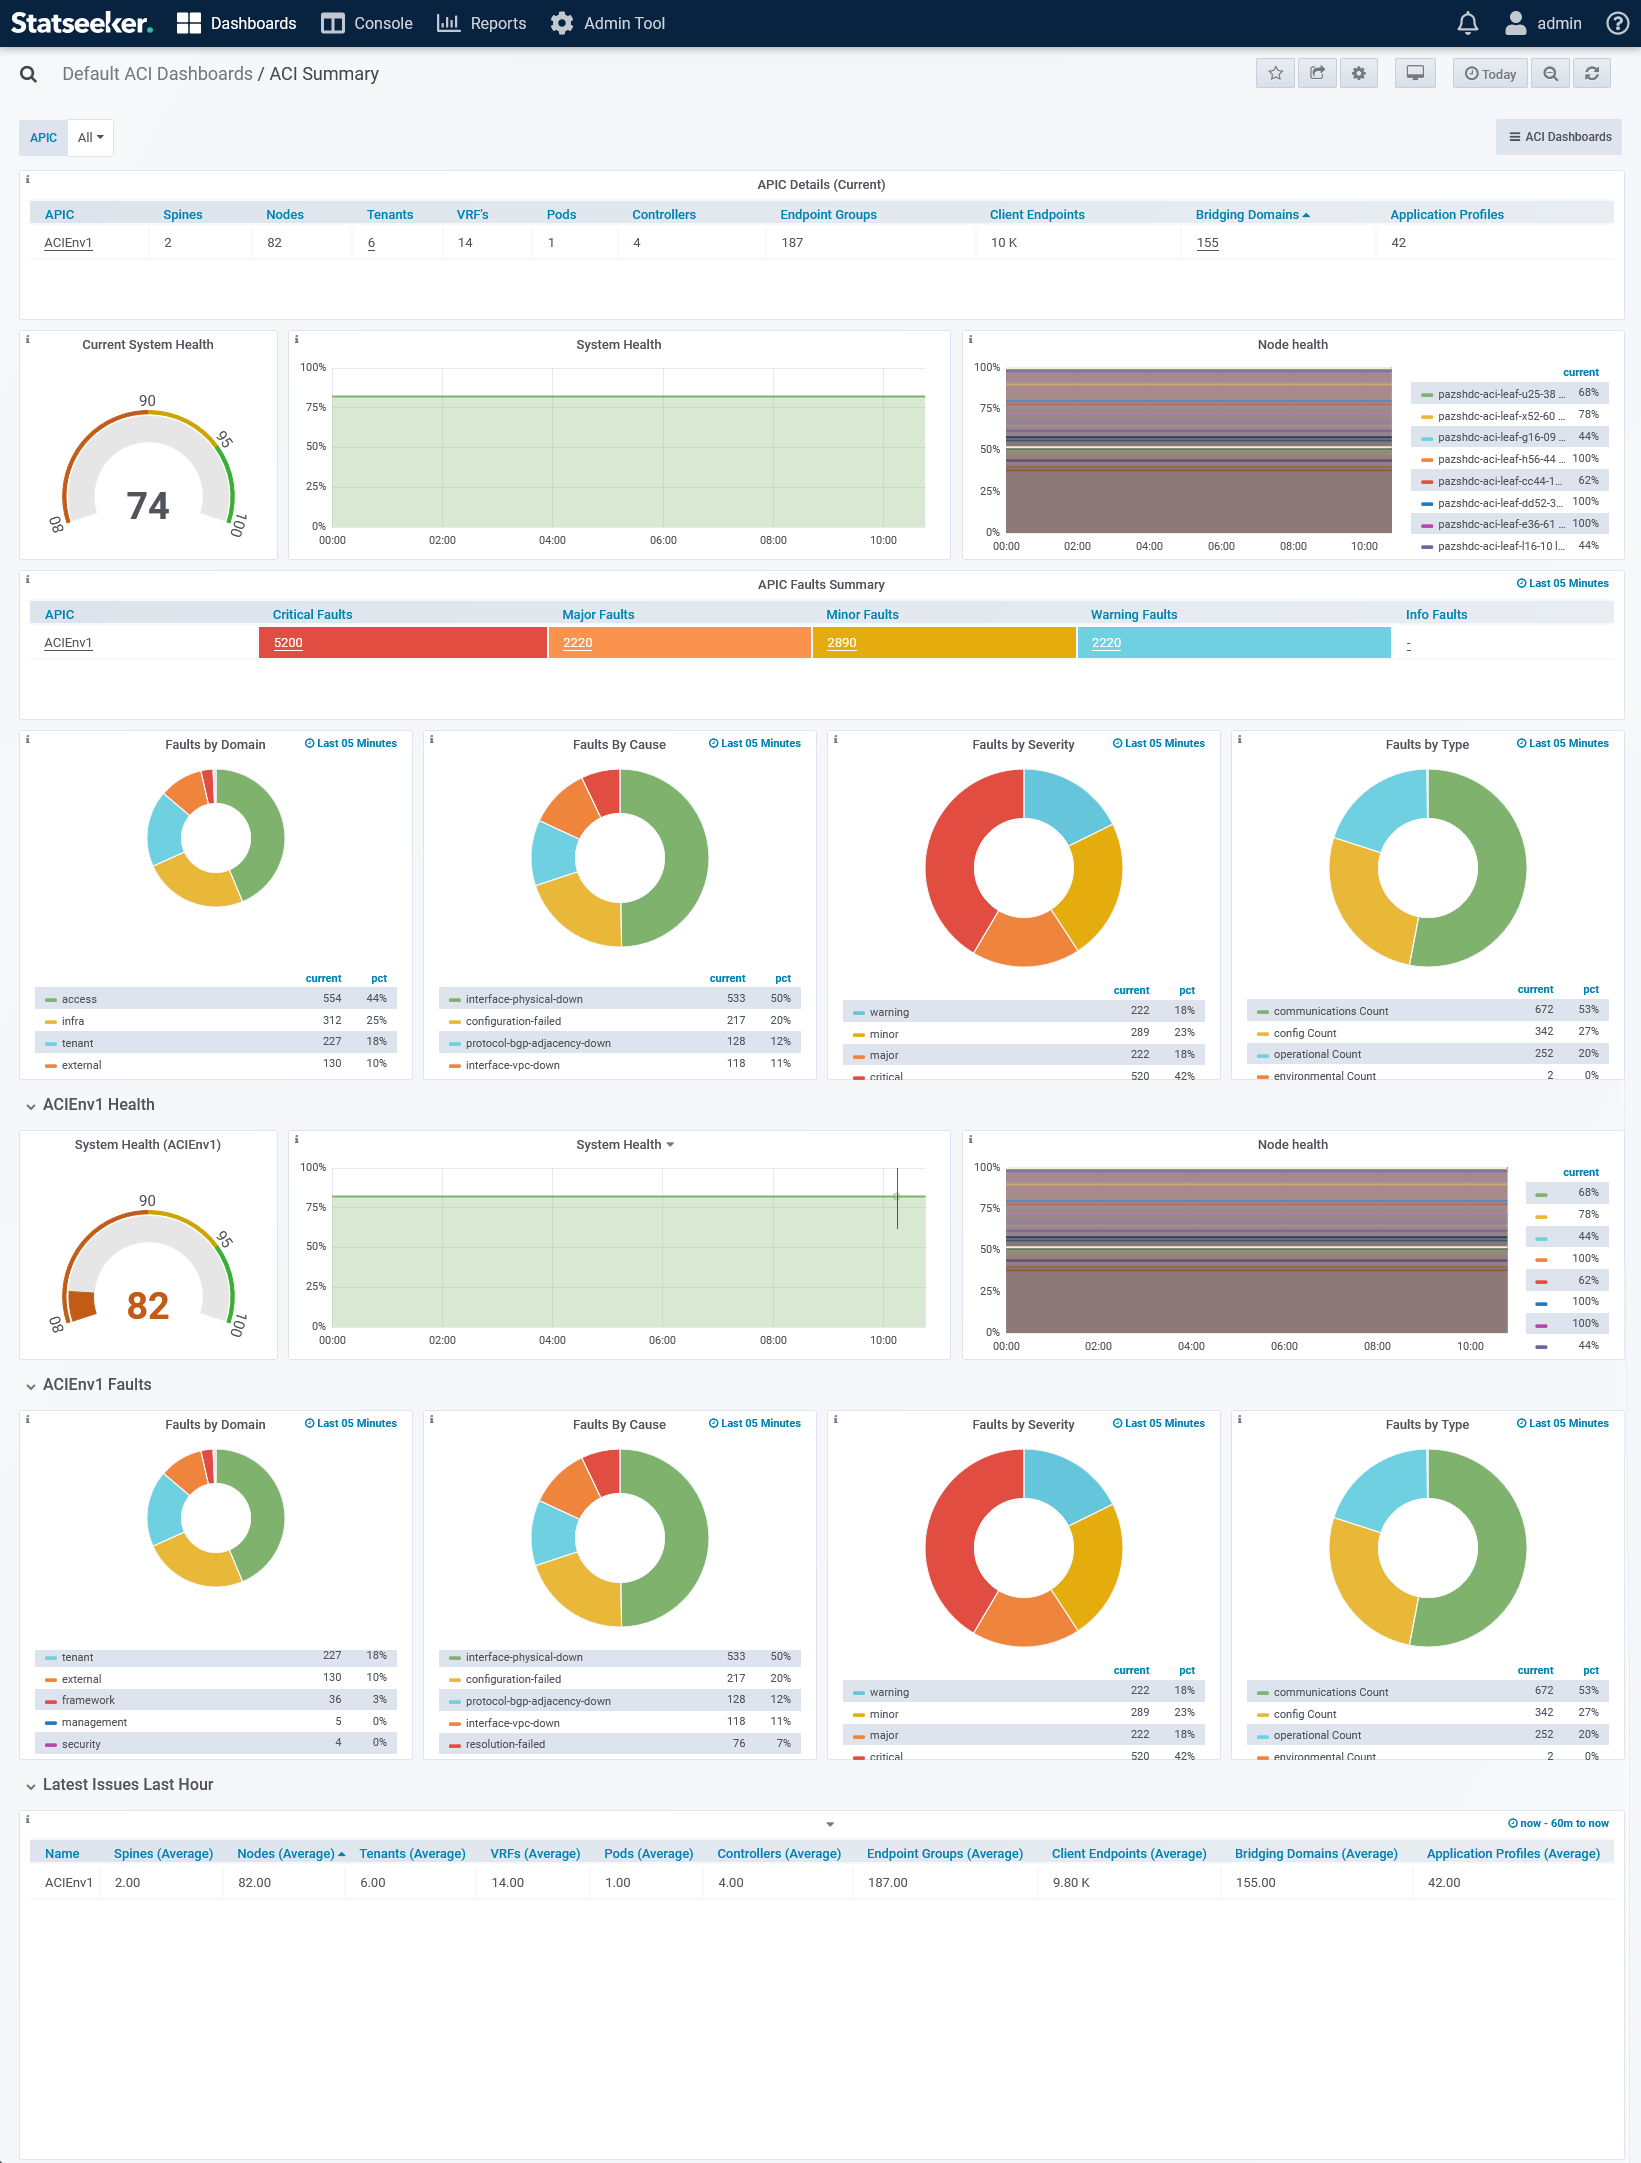
The dashboard offers links to:
- ACI Faults, Tenants, and Bridge Domain Summary dashboards
- The Device Viewer, filtered to a selected APIC
ACI Tenant Dashboard
The ACI Tenant dashboard provides a summary of your monitored Tenants, detailing:
- Tenant configuration
- Current and historical health aggregated by APIC and broken down by Tenant and Application
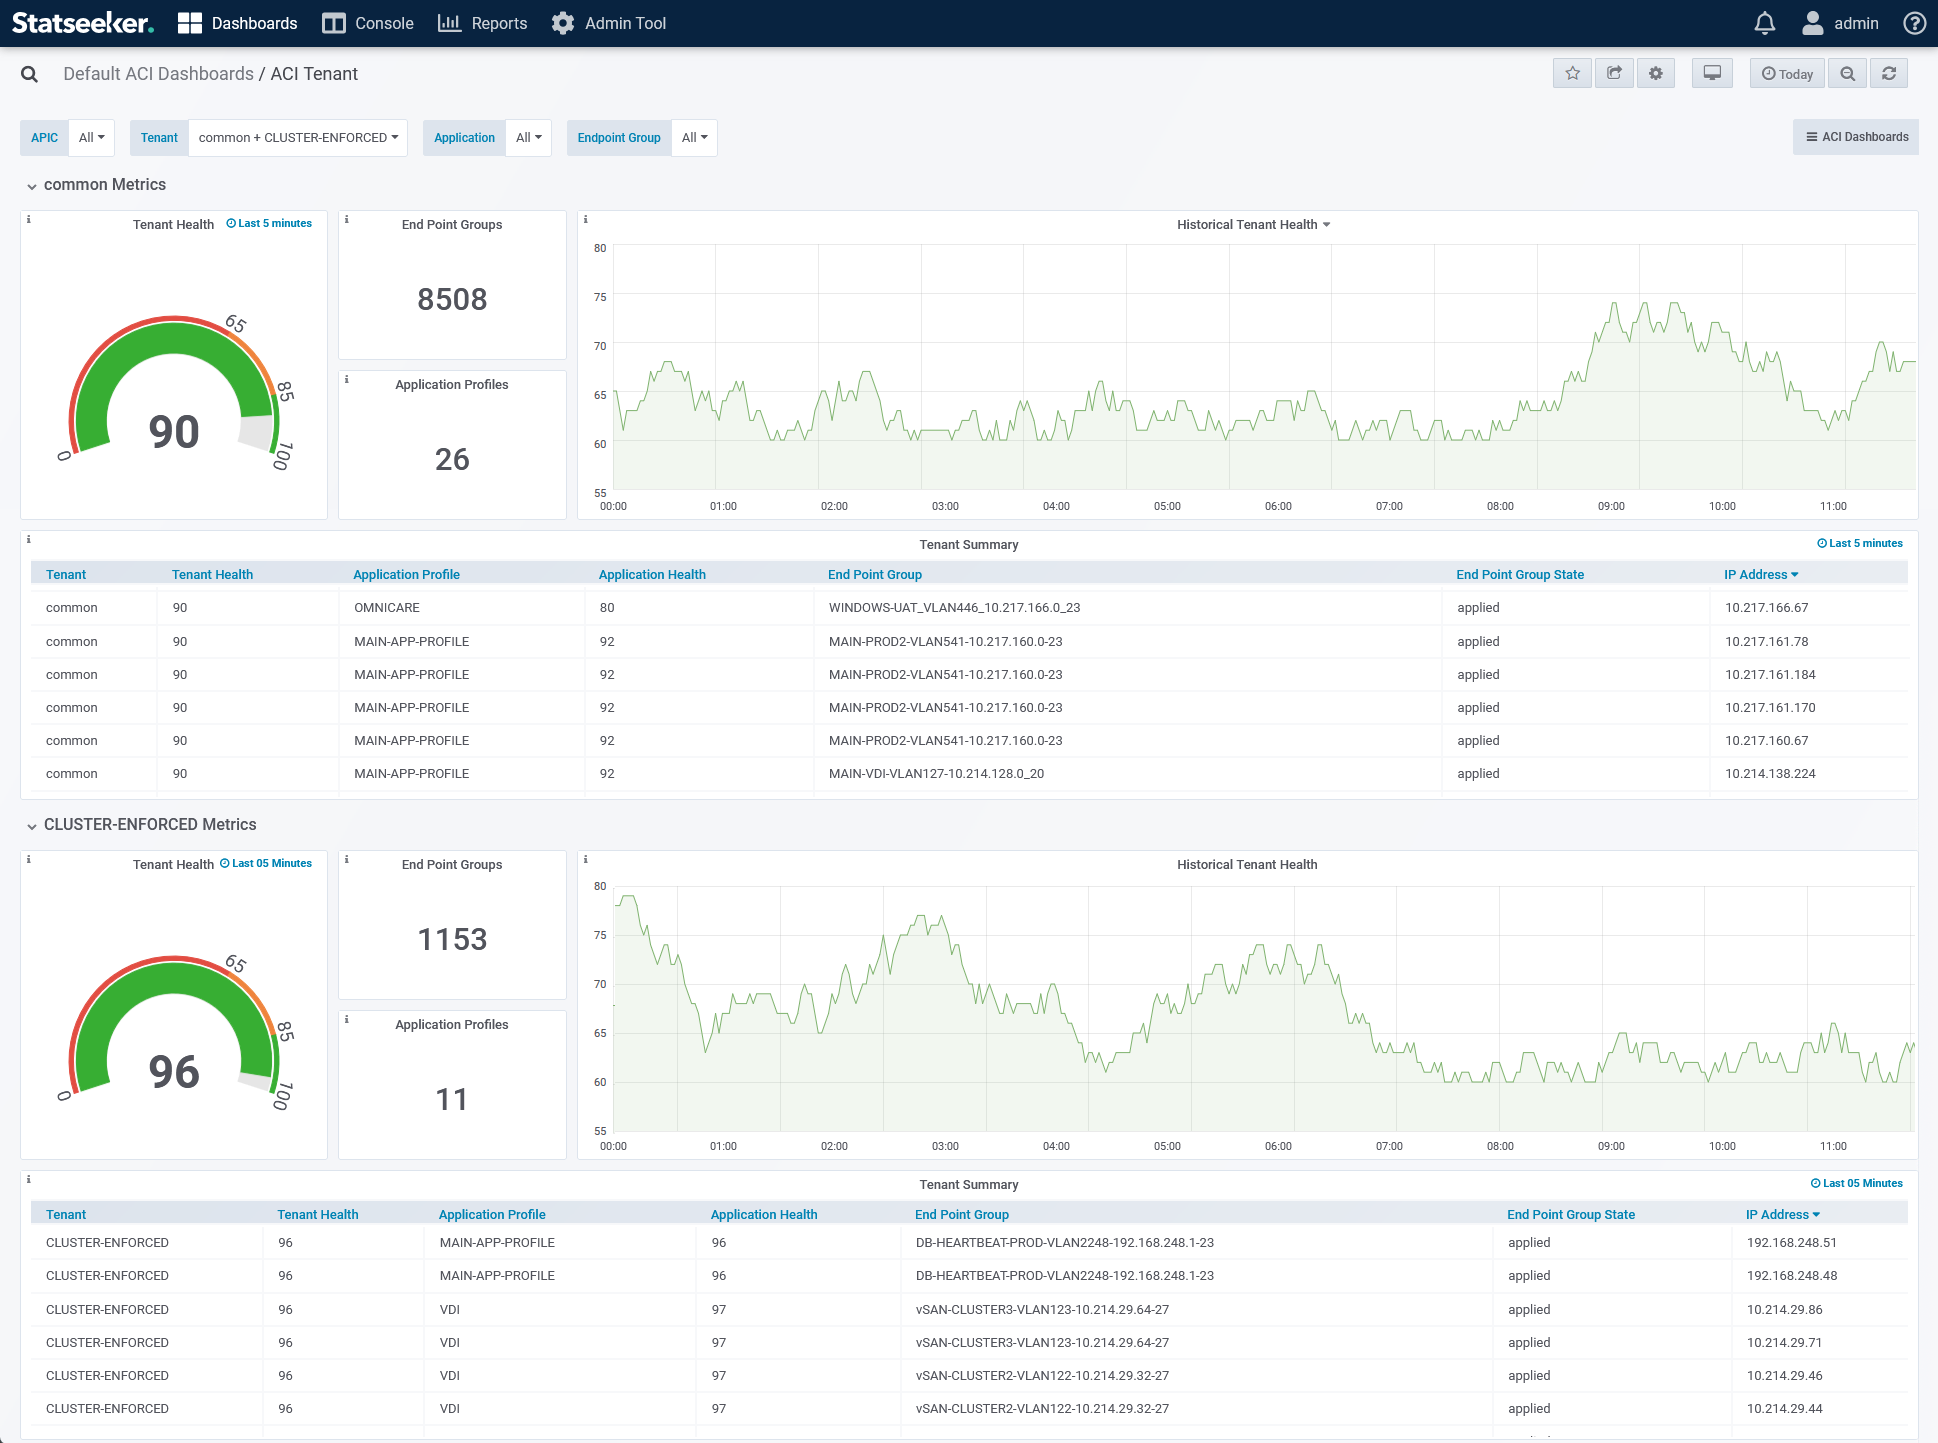
The dashboard offers links to ACI Faults, Bridge Domain Summary, and ACI Summary dashboards.
ACI Bridge Domain Summary Dashboard
The ACI Bridge Domain Summary dashboard provides a summary of your monitored Bridge Domains, detailing:
- Bridge Domain configuration
- Current and historical health aggregated by APIC and broken down by Bridge Domain
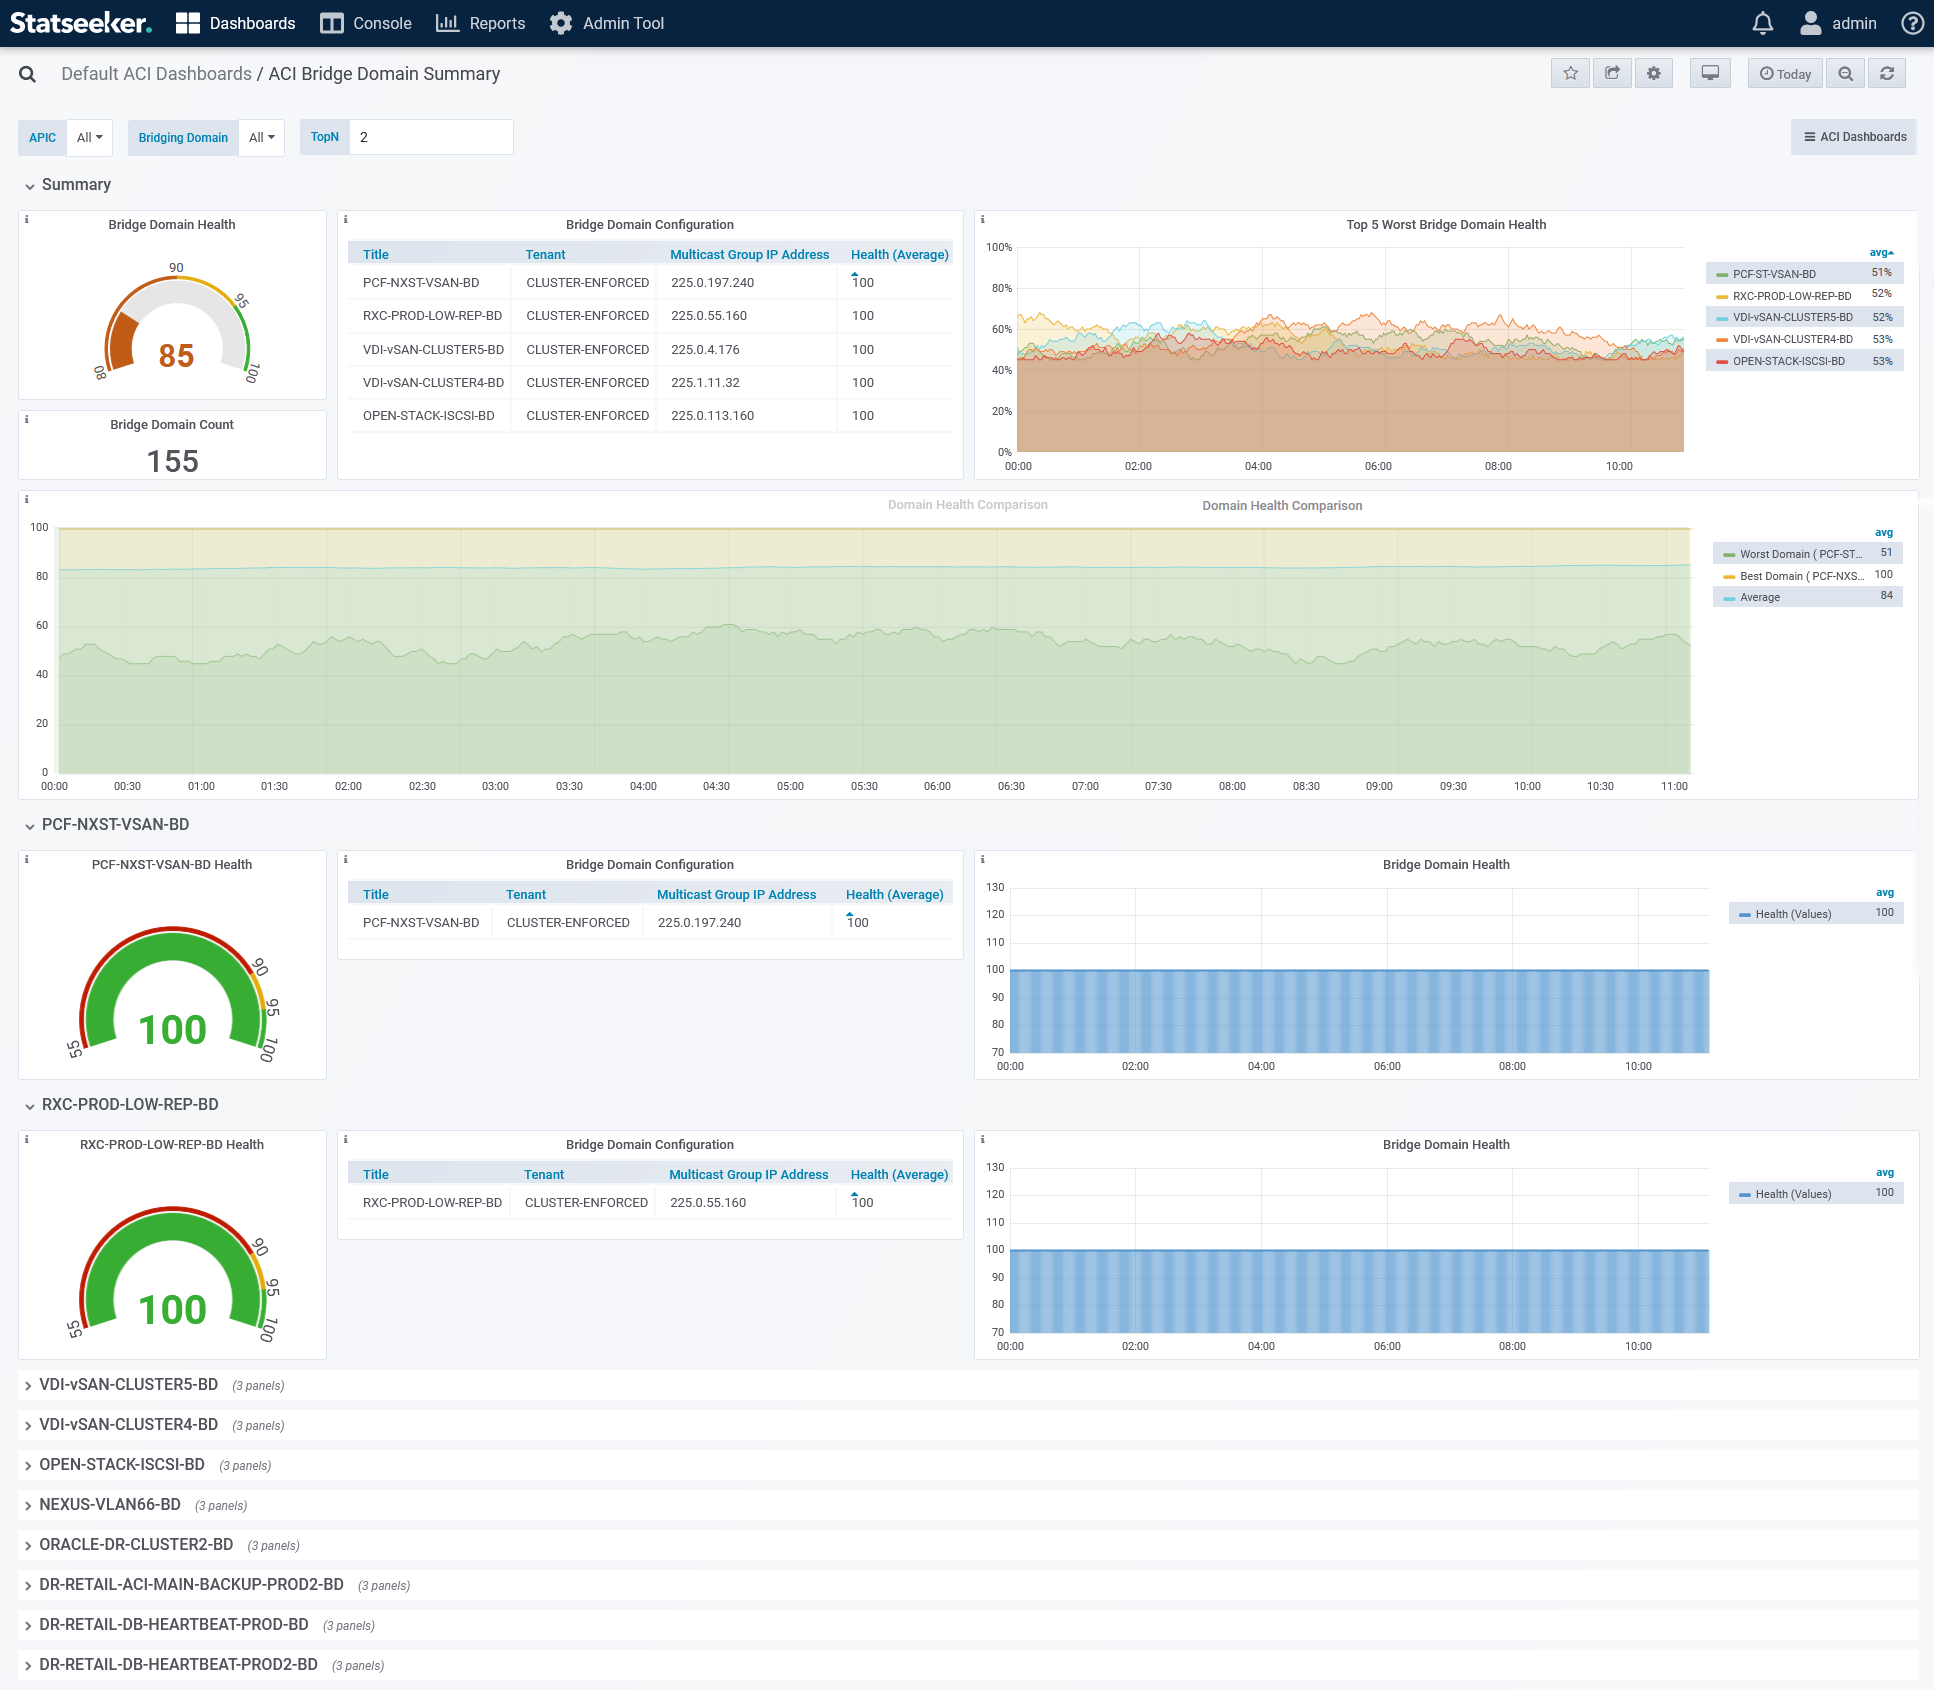
The dashboard offers links to ACI Faults, Tenants, and ACI Summary dashboards.
ACI Faults Dashboard
The ACI Faults dashboard provides details on current and historical fault records generated within the ACI environment.
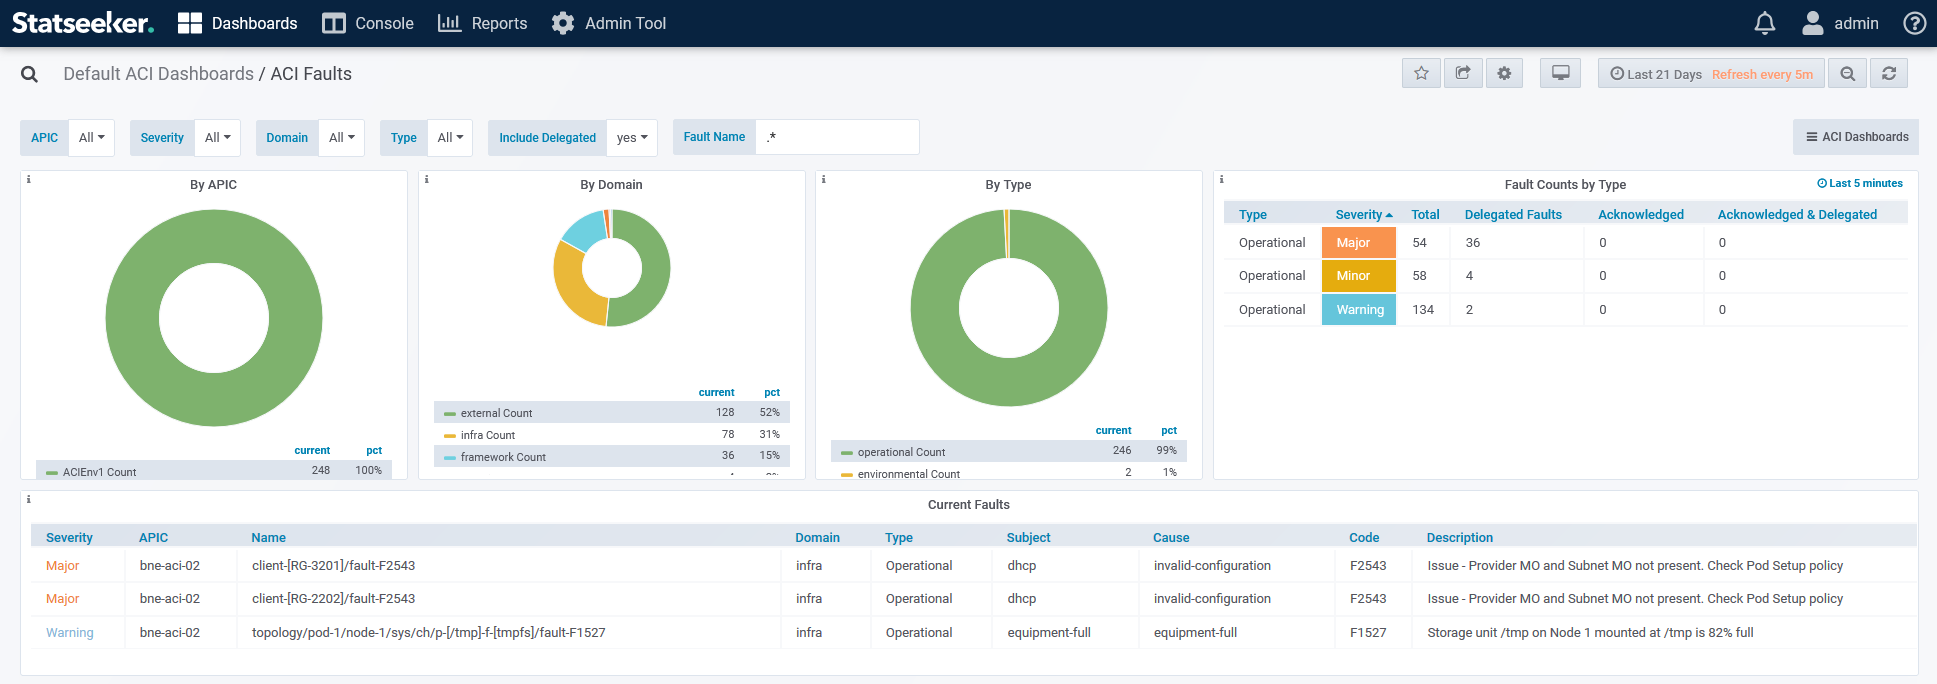
The dashboard offers links to ACI Bridge Domains, Tenants, and ACI Summary dashboards.
Cisco ACI Reports
Statseeker offers four default ACI Monitoring reports:
- ACI Summary Report – a summary of all monitored ACI environments with details on the configuration and health of APICs, Nodes, Bridge Domains, and Endpoints
- ACI RS Client Endpoint to Path Endpoint – details the relationship between client and path endpoints within the monitored ACI fabric
- ACI Fault Domain Report – ACI Fault Summary by domain and severity
- ACI Fault Type Report – ACI Fault Summary by fault type and severity
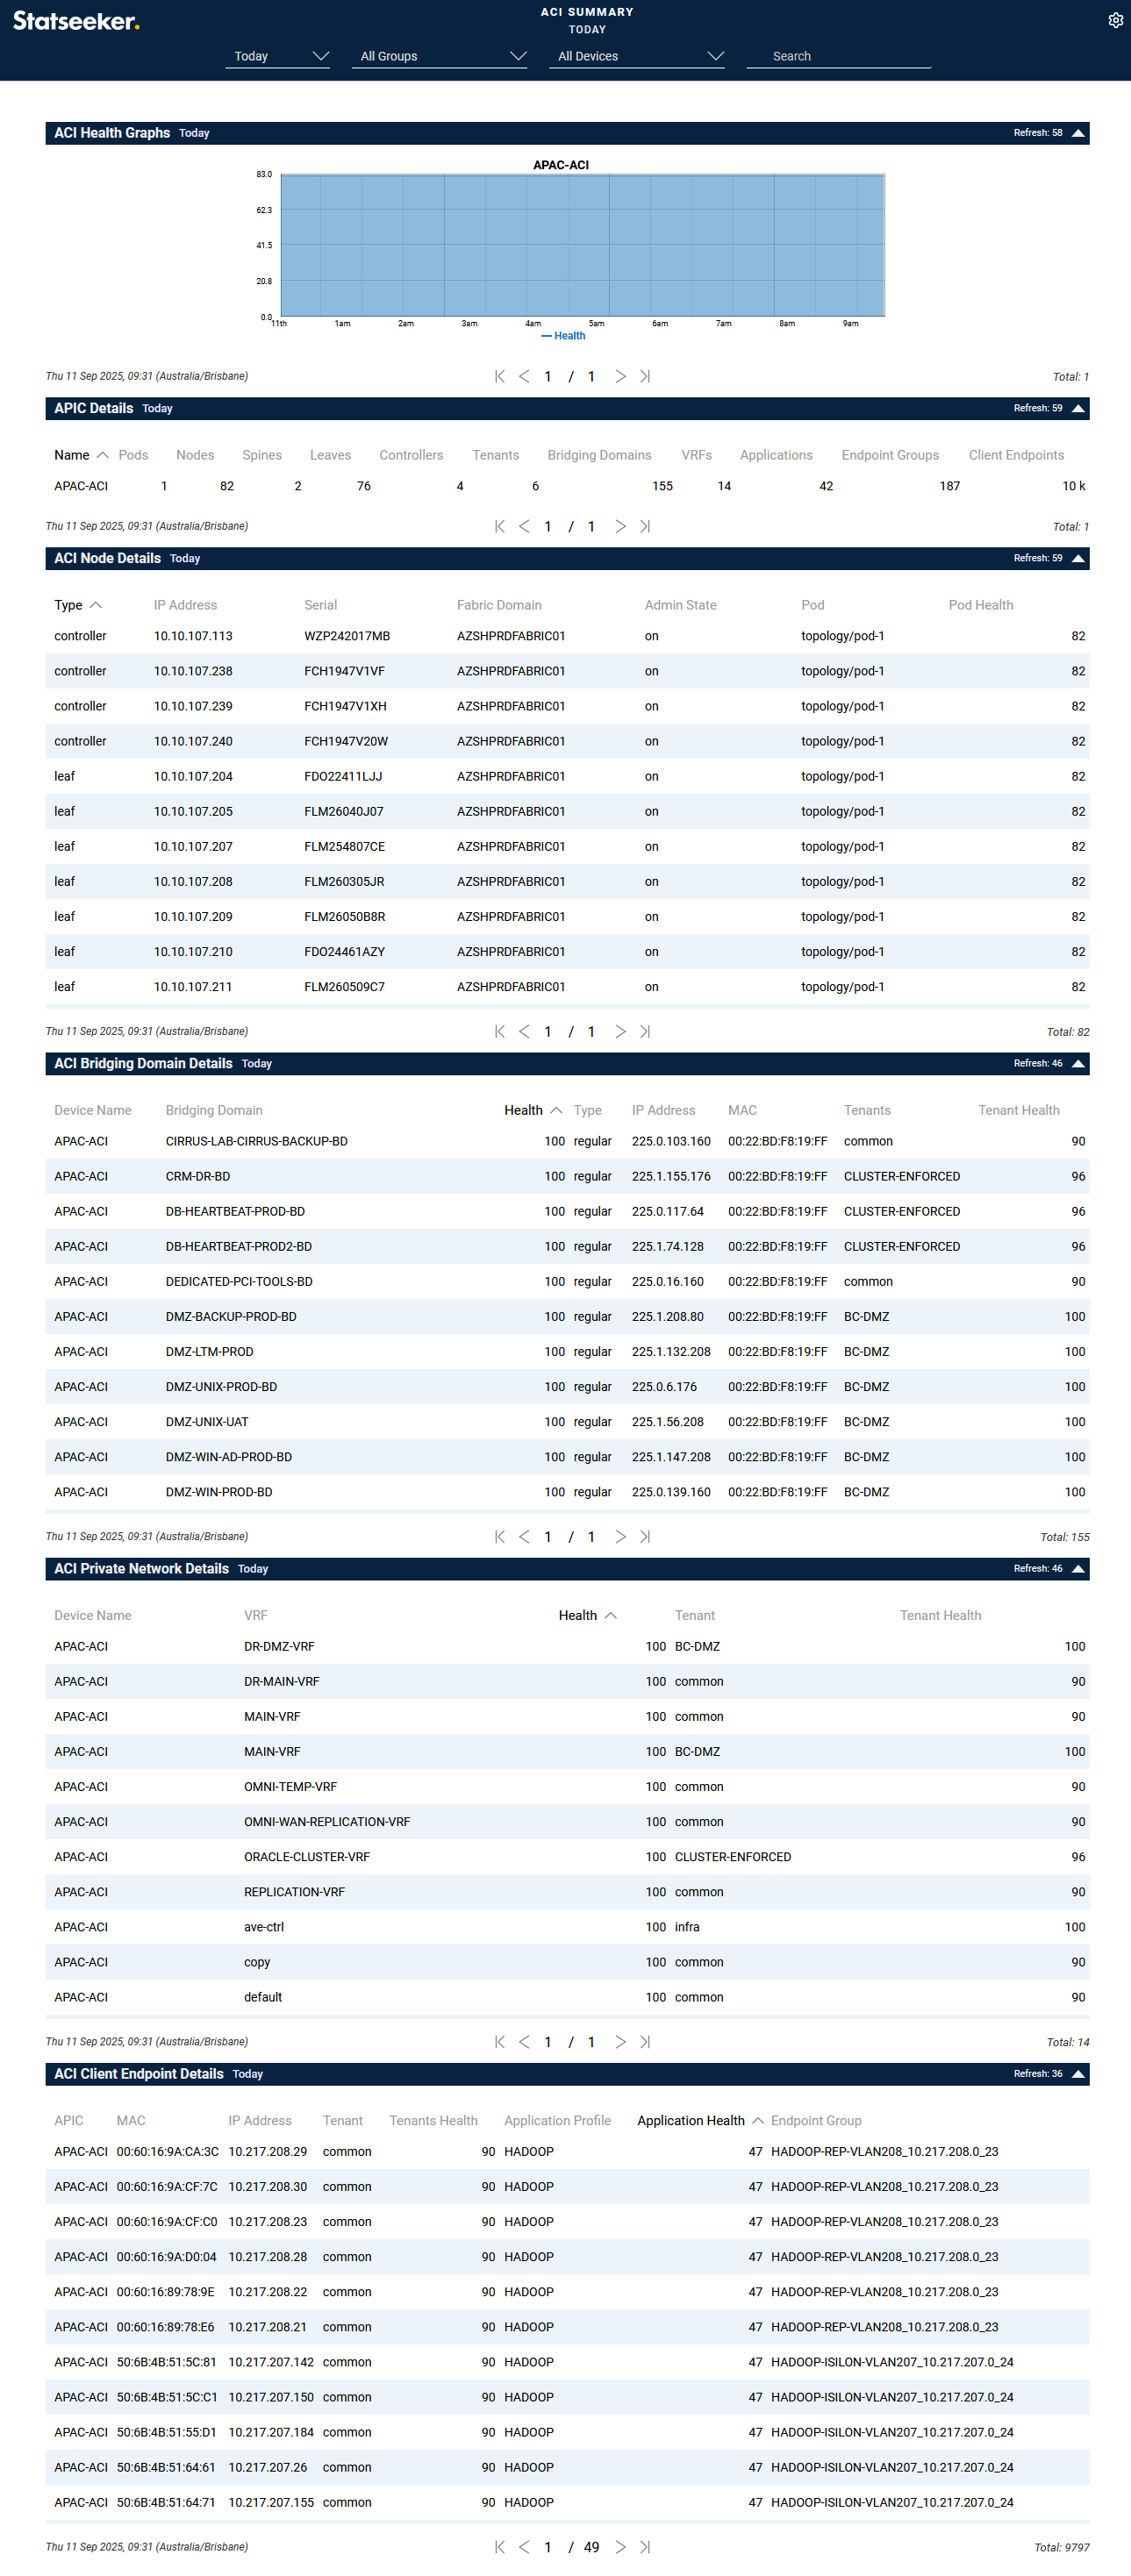
ACI Summary Report
This summary report covers all monitored ACI environments with details on the configuration and health of APICs, Nodes, Bridge Domains, and Endpoints.
The report offers links and drilldowns to:
- The Device Details Report for each APIC
- Pod health graphs
- Bridge Domain configuration details and health graphs
- Tenant health graphs
- Virtual Routing and Forwarding (VRF) health graphs
- Application health graphs
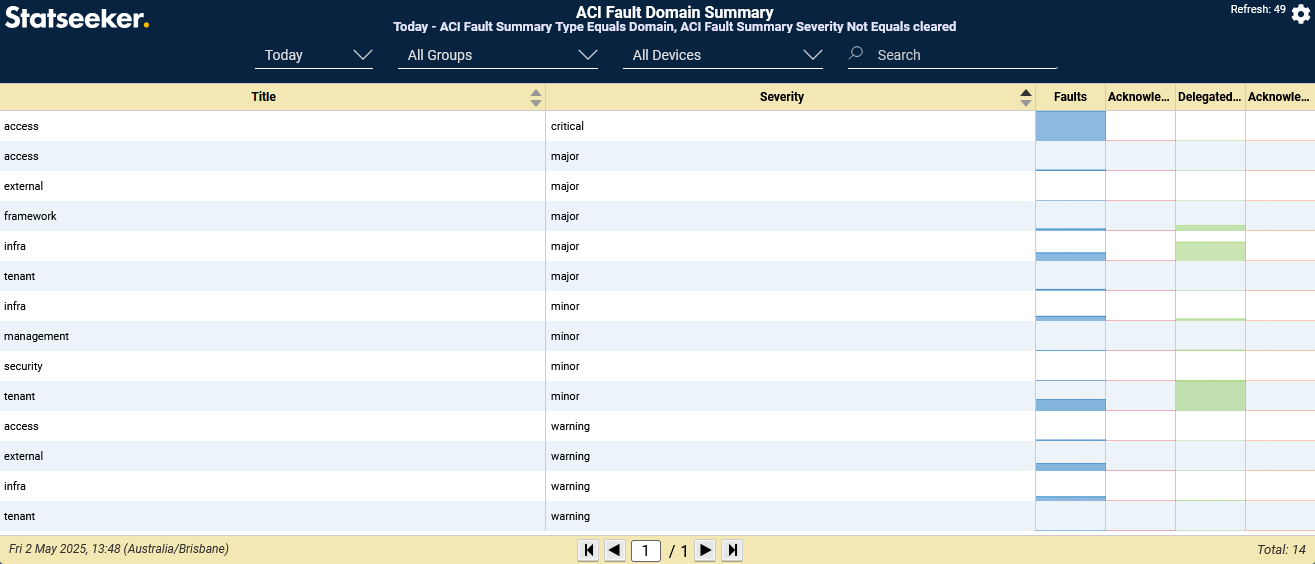
ACI Fault Domain Summary
The ACI Fault Domain Summary breaks down fault records by domain and severity combinations. The report offers links and drilldowns to:
- ACI Fault Details reports (filtered)
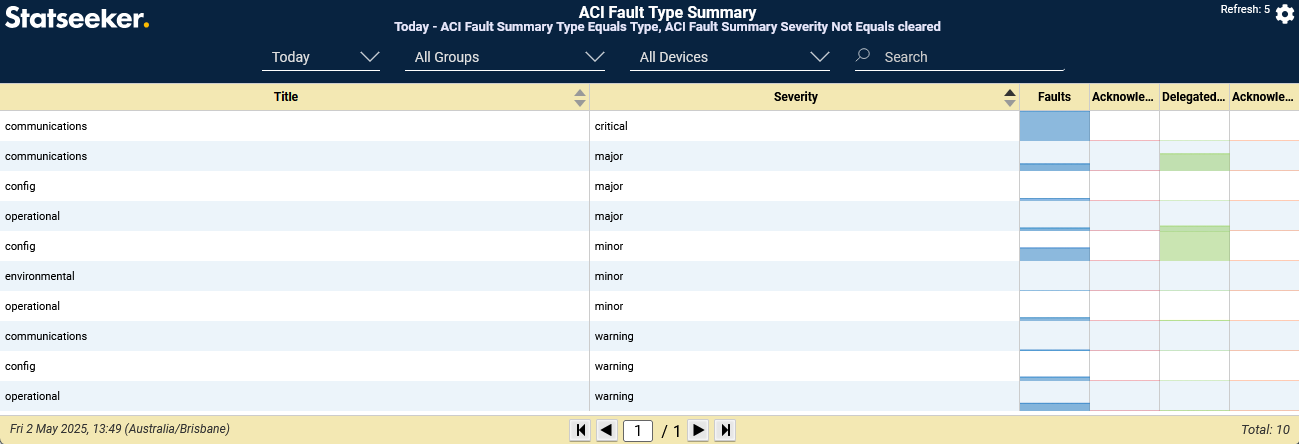
ACI Fault Type Summary
The ACI Fault Type Summary breaks down fault records by fault type and severity combinations. The report offers links and drilldowns to:
- ACI Fault Details reports (filtered)
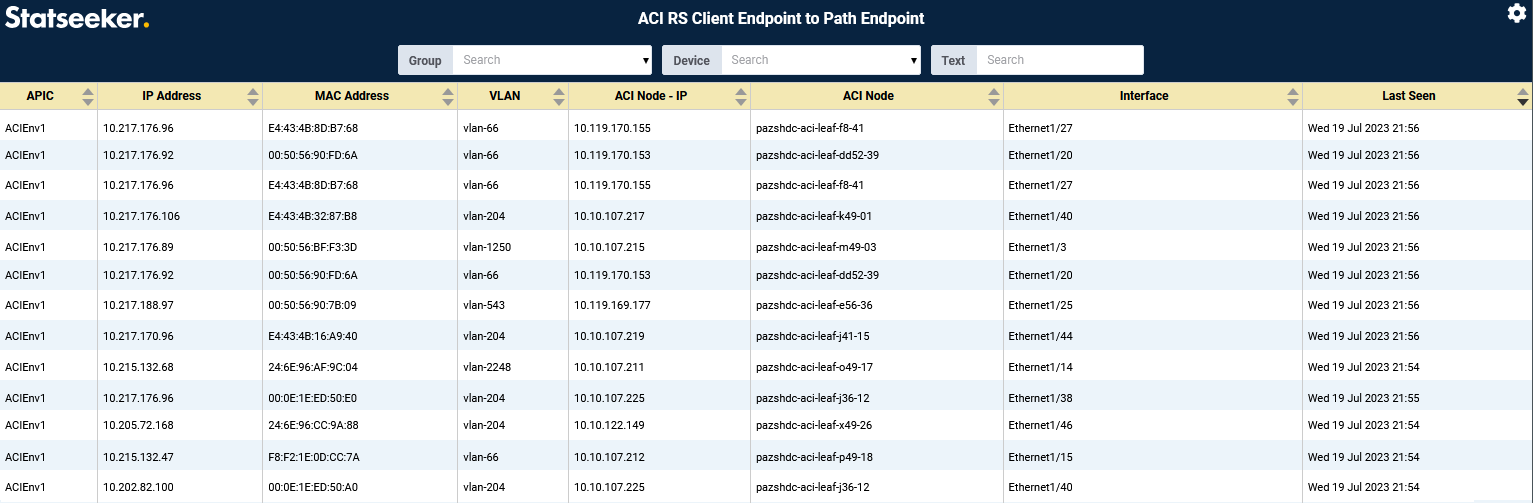
ACI RS Client Endpoint to Path Endpoint
The ACI RS Client Endpoint to Path Endpoint report details the relationship between client and path endpoints within the monitored ACI fabric.