
Index
- Dashboard Overview
- Dashboards Home
- Default Dashboards
- Dashboard Manager
- Users and Dashboard Permissions
- Roles: Admin, Editor, Viewer & Restricted
- Network Visibility
- Folders and Permissions
- Create and Configure Dashboard Users
- Dashboards
- Templates
- Playlists
- Snapshots
- Preferences
Overview
The Statseeker Dashboard Home page is the default view when accessing Statseeker via the web interface. This page offers access to the existing dashboards that the user has permission to view, as well as the ability to create new dashboards and edit existing dashboard configurations. Dashboards are an editable view comprised of one or more ‘panels’, each panel containing a Statseeker report (graph, table, gauge, etc.).
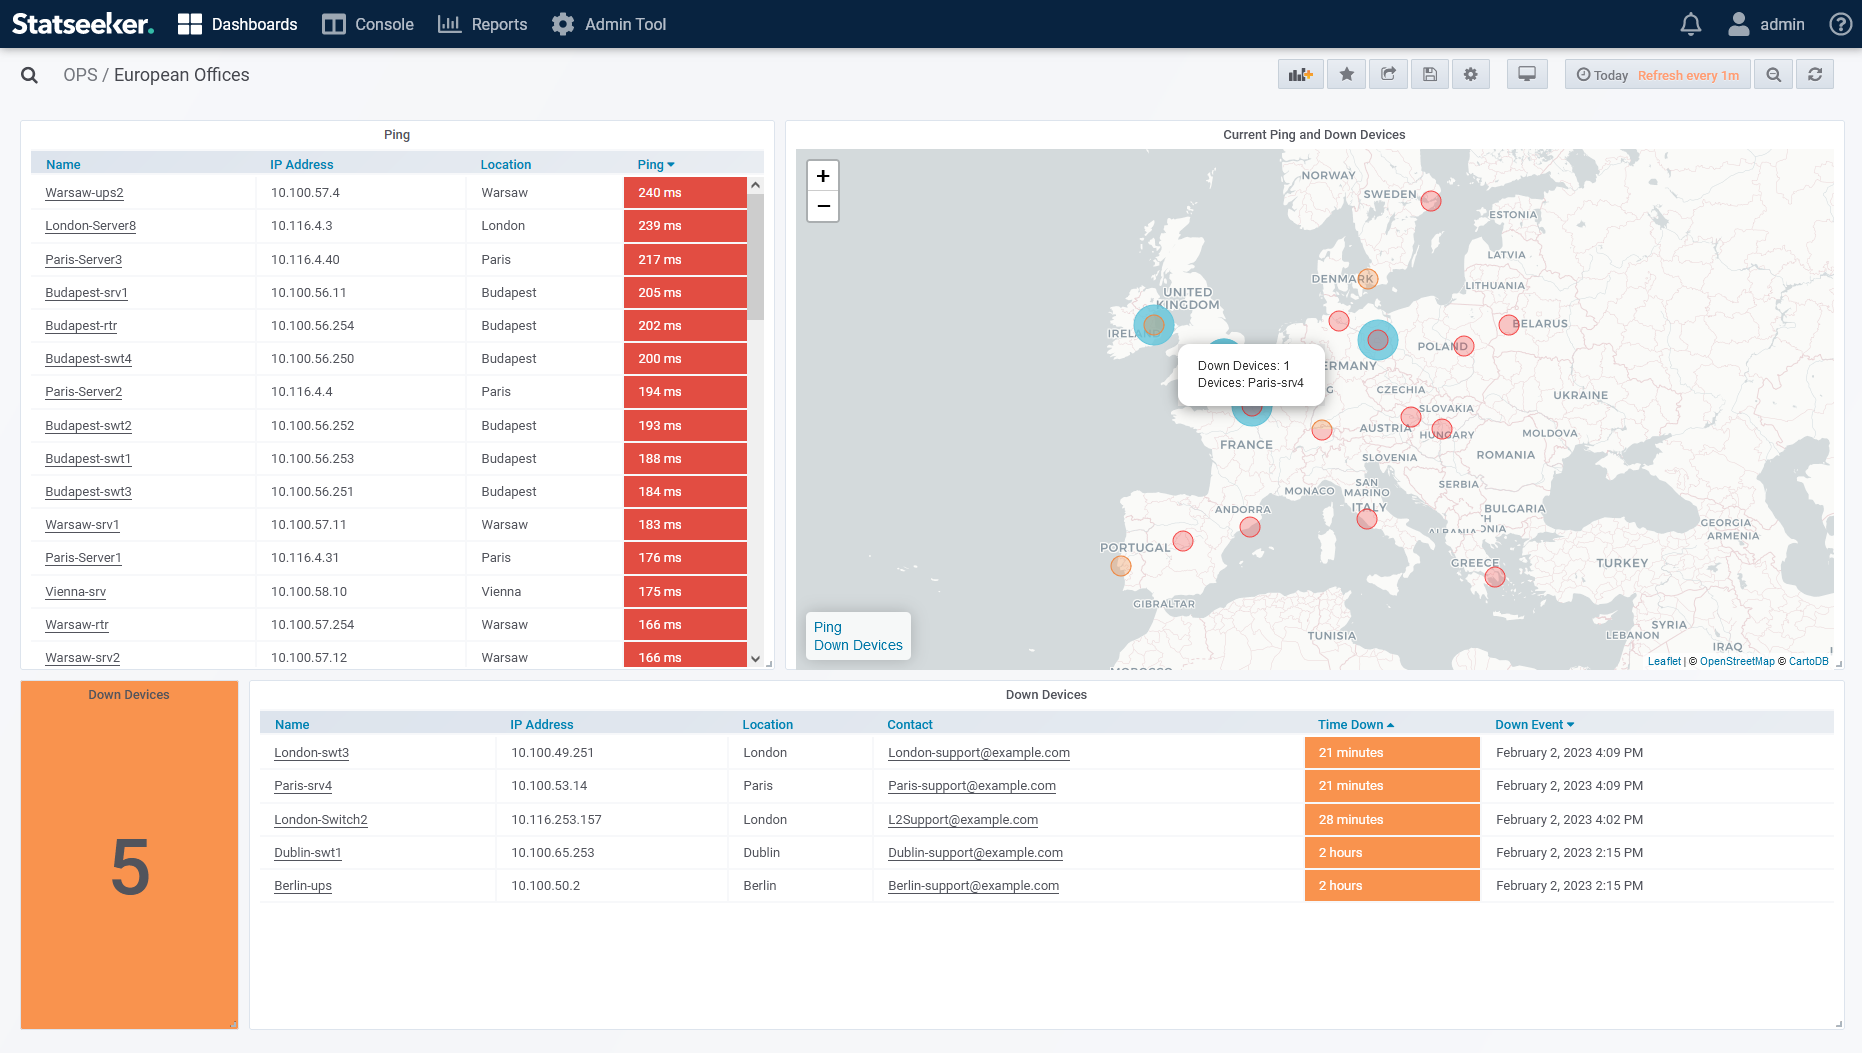
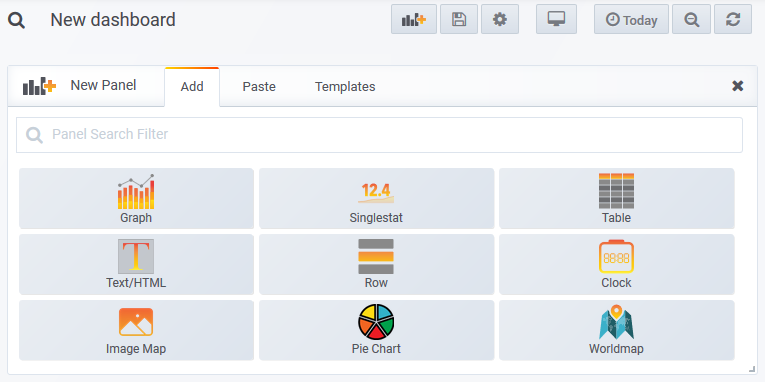
The panels are individually configured and can be moved around and resized within a dashboard, as well as copied to other dashboards. Statseeker offers a range of panel types:
- Graph – graph one or more metrics
- Singlestat – a single summary value for a data series (min, max, average, sum, etc.), which can optionally be represented as a gauge
- Table – a data table
- Pie Chart – can be used to present timeseries, configuration, or asset data
- Worldmap – display data related to geographical locations on a configurable background
- Image Map – place nodes and links and configure to display configuration, state, or timeseries data, optionally overlay the nodes/links on a custom image background
- Text/HTML – static or variable-driven text, can also contain imported content such as Statseeker reports or 3rd-party web content
- Clock – display time in a selected timezone, or configure a countdown to a specified deadline
- Row – a collapsible row used to manage panel layout within your dashboard
Dashboards can be themed to target a particular aspect of Statseeker monitoring, configured to broadly encompass your entire network, or be as finely tuned and specific in scope as needed.
All dashboard panels can be configured to offer links to:
- Other dashboards
- Statseeker reports
- Any external web content
This linking ability enables you to use the dashboards to highlight potential hotspots and then investigate issues with a single click.
Dashboards Home
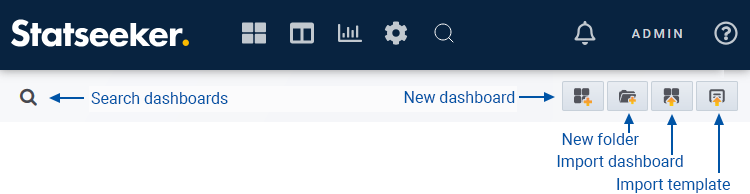
The Dashboard Home page contains sections listing your favorite dashboards, recently viewed dashboards, and the Statseeker default dashboards. The homepage also contains a news panel detailing recent updates with links to associated documentation and videos.
From the dashboard homepage, you can jump to the dashboard of your choice, search your dashboard collection, and create new dashboards.
Default Dashboards
Every Statseeker install contains several default dashboards, located in the Default Dashboards folder, available to all users. These non-editable dashboards are created and maintained by Statseeker.
If you would like to edit any aspect of the default dashboards, you will need to create an editable copy of the dashboard, see Copying Dashboards for details.
The current default dashboards are:
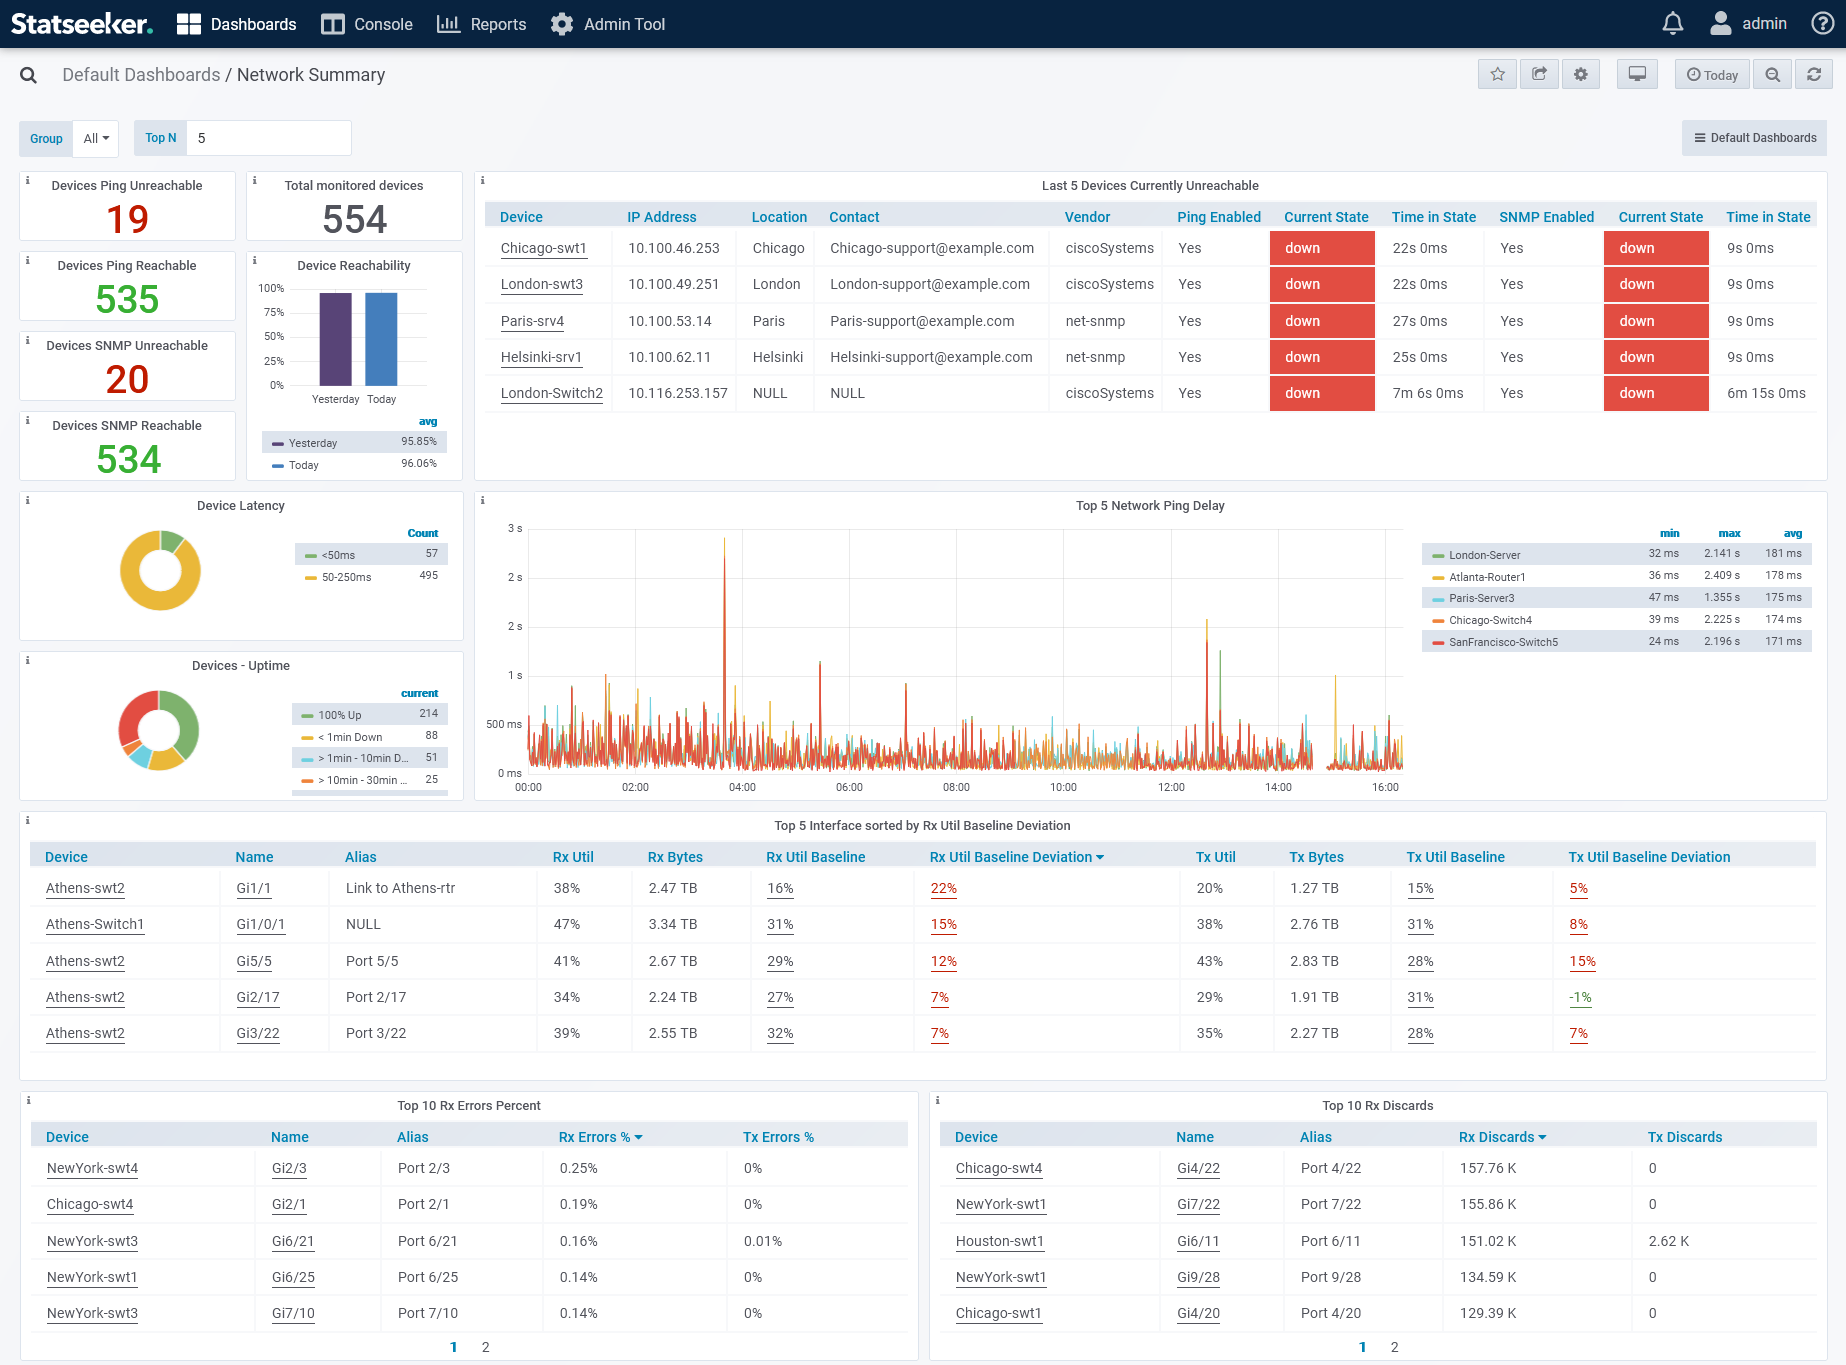
Network Summary
A high-level summary of the current state of the network (or subset thereof) with details on down devices and device-level events, ping statistics highlighting latency issues, SNMP communication failures, and identifying potential interface and link congestion. The dashboard features drill-down links to event-based reports, as well as the Device and Interface Overview dashboards
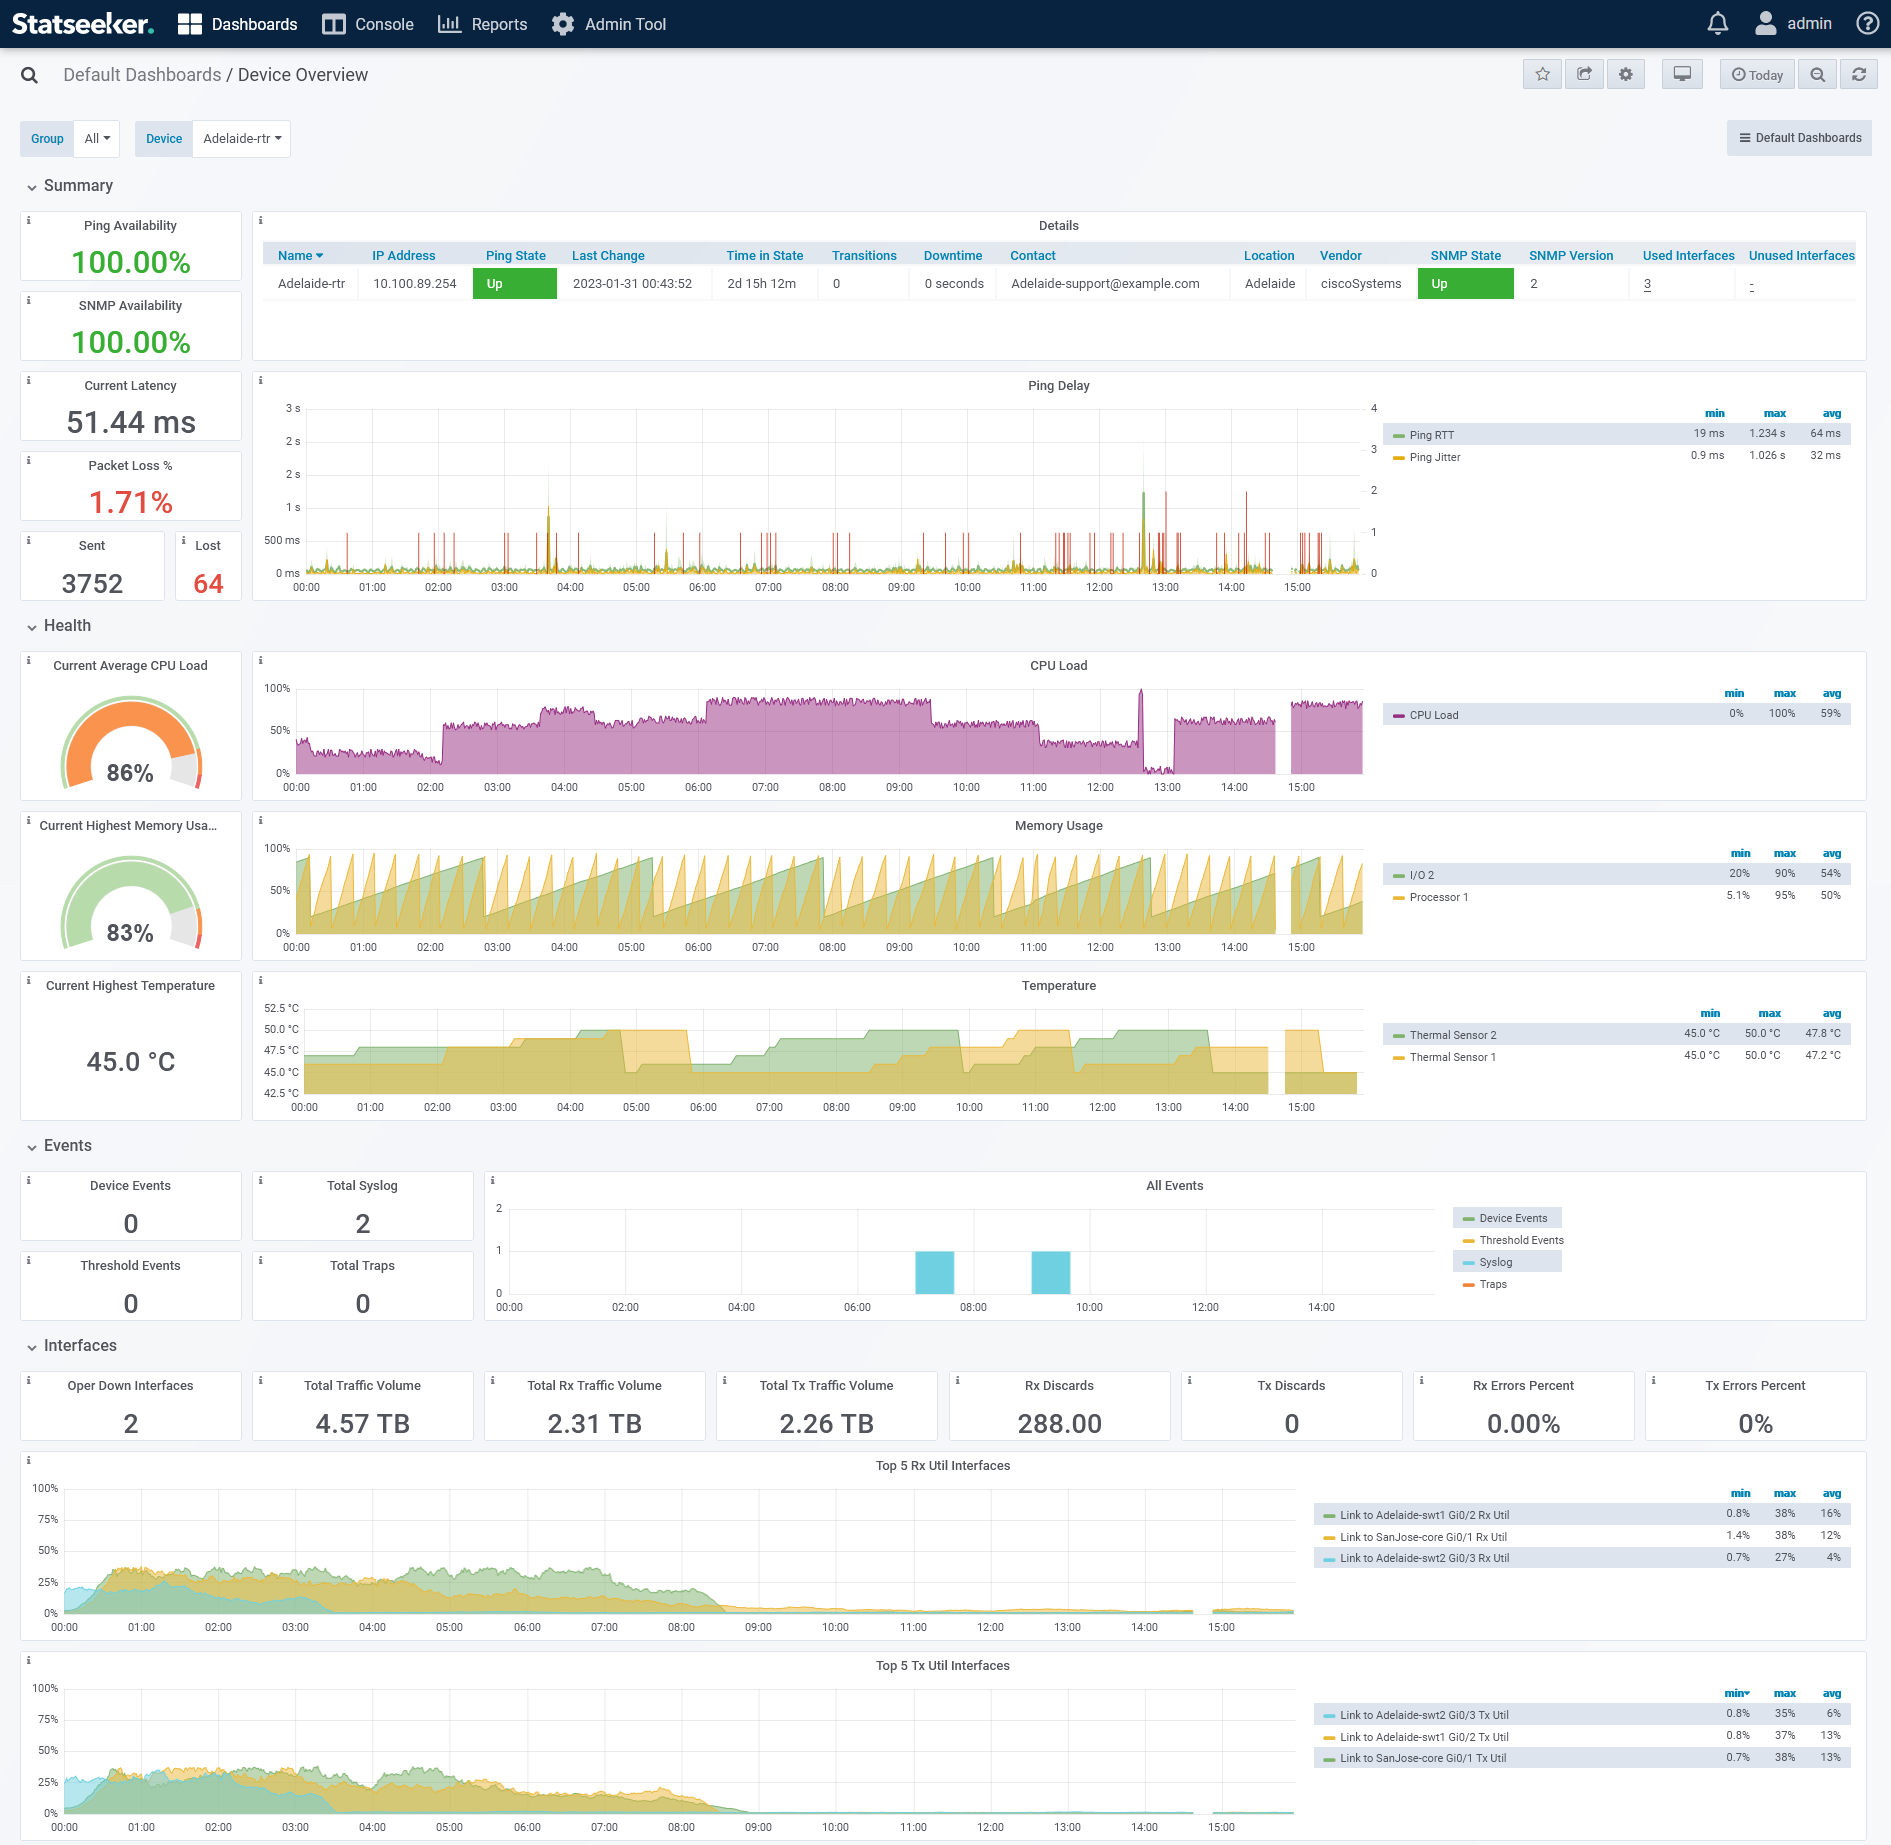
Device Overview
Provides details on a selected device, including current ping and SNMP state and availability, latency and packet loss, interface usage and traffic volumes, event records (device events, threshold breaches, syslog and trap messages), and basic device health metrics such as temperature, CPU, and memory load. The dashboard features drill-down links to event-based reports, interface utilization baseline reports, and the Interface Overview dashboard.
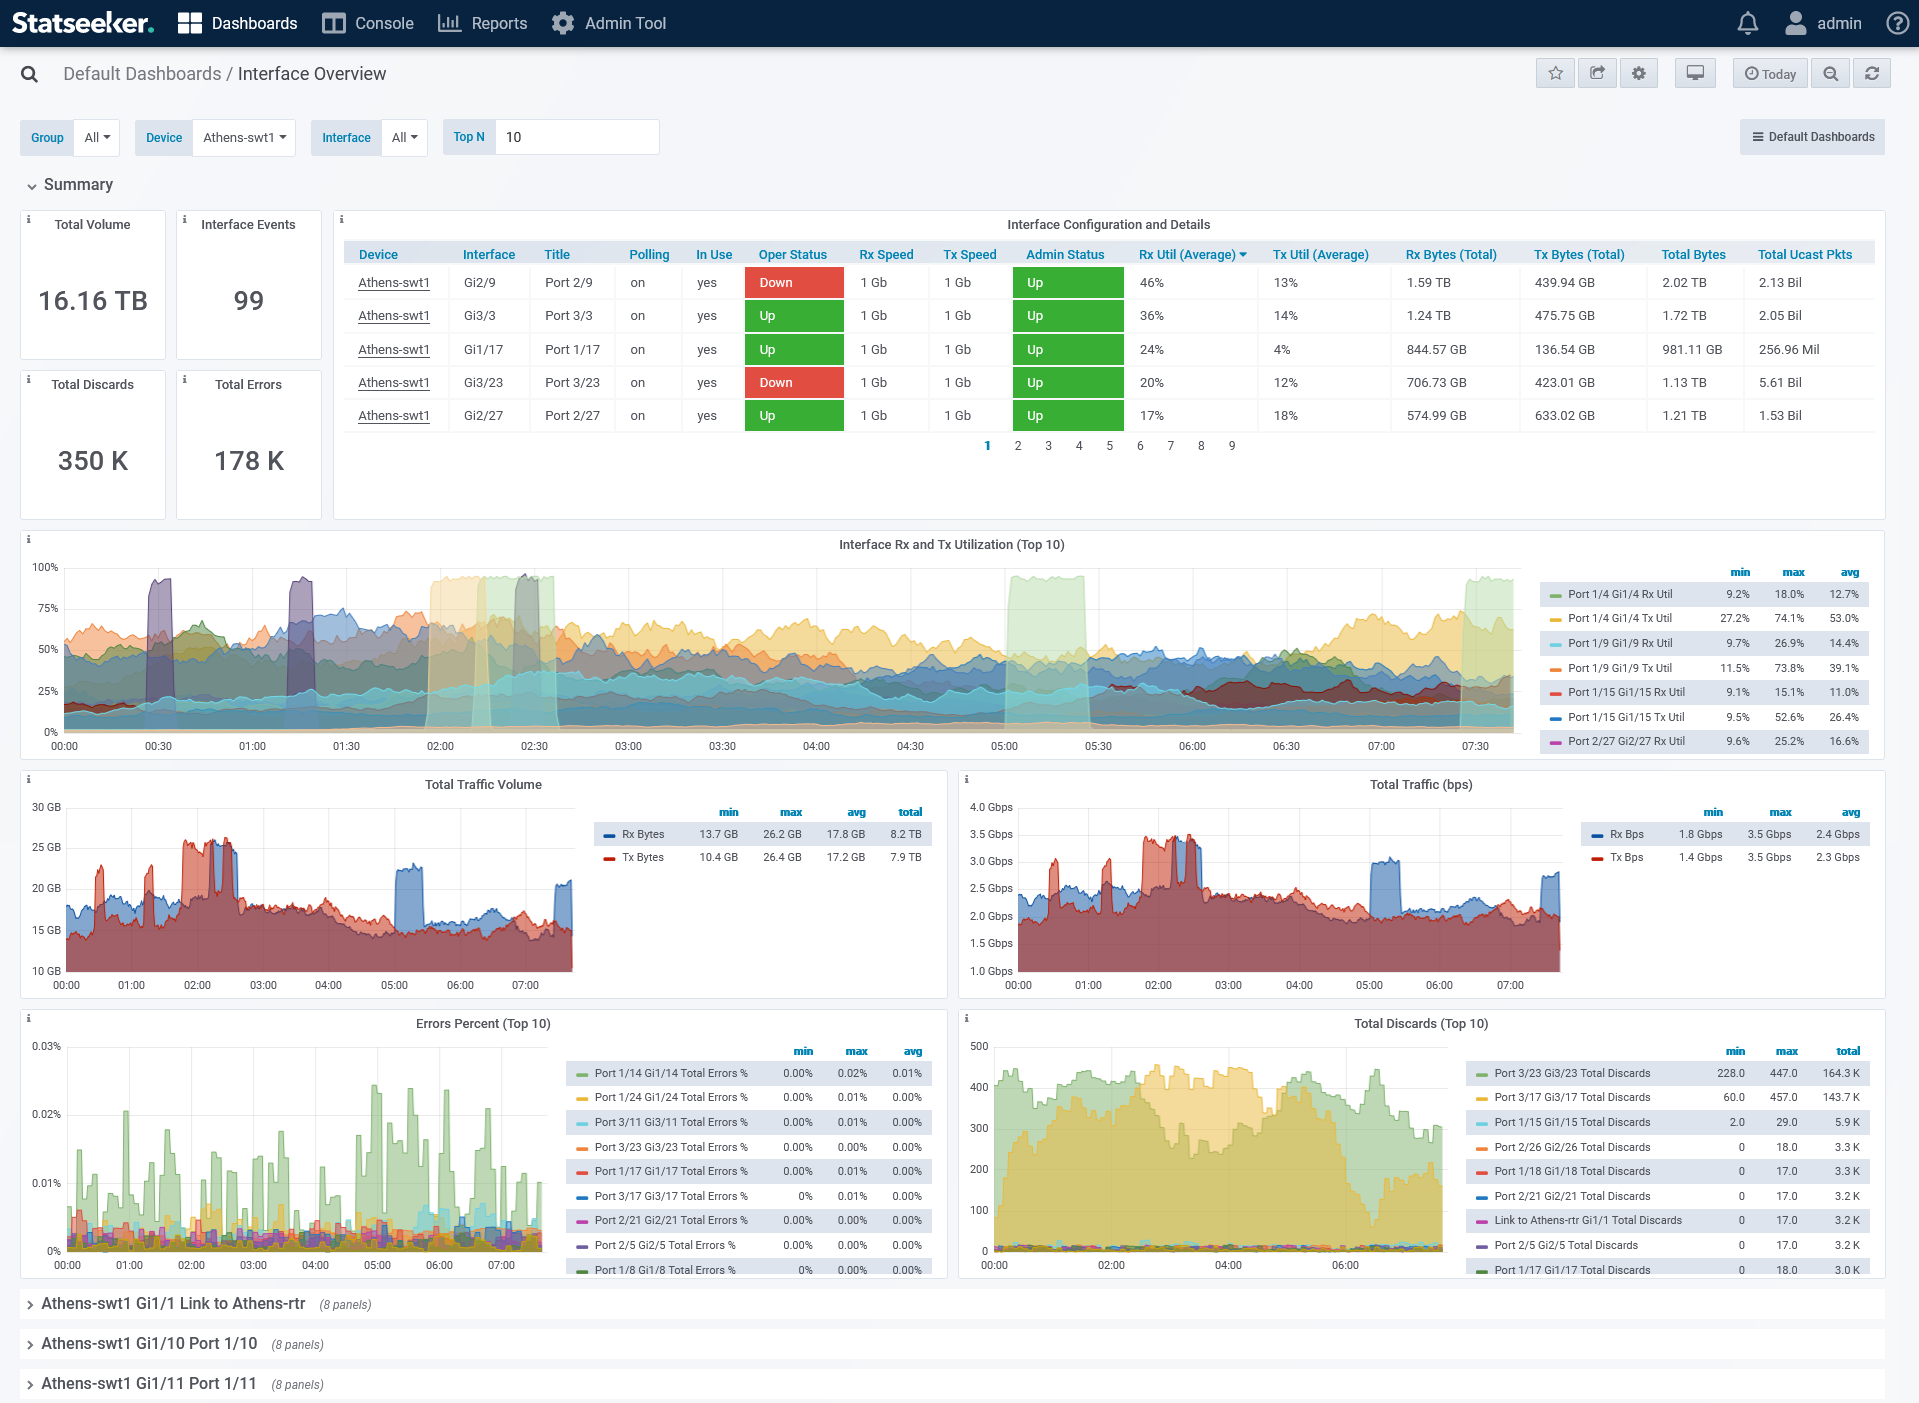
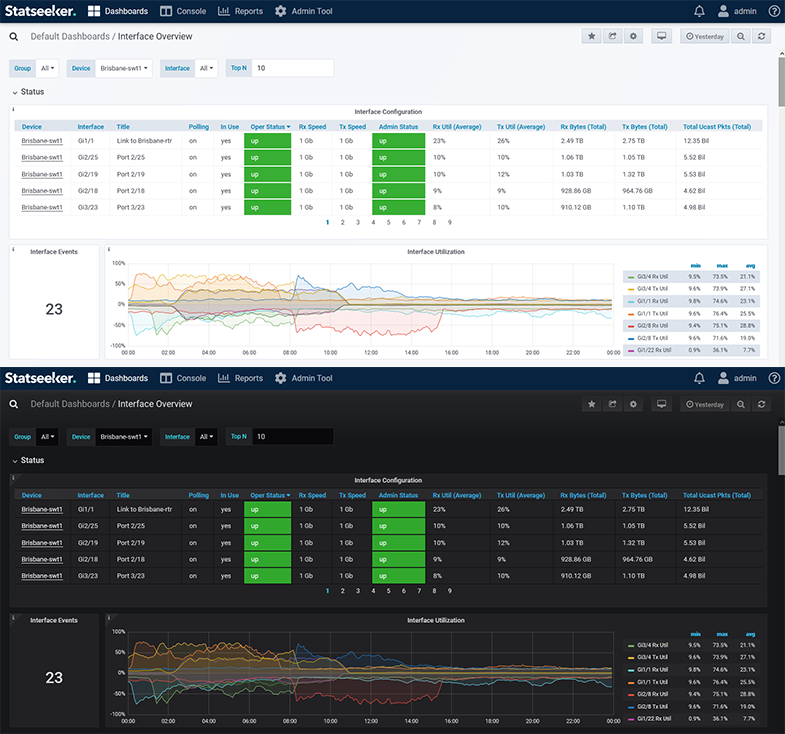
Interface Overview
Offers a detailed look at the interfaces of the selected devices, detailing interface configuration, utilization, traffic volume and rate, and errors and discards. The dashboard also offers links to the Device Overview and drilldowns to an interface events report.
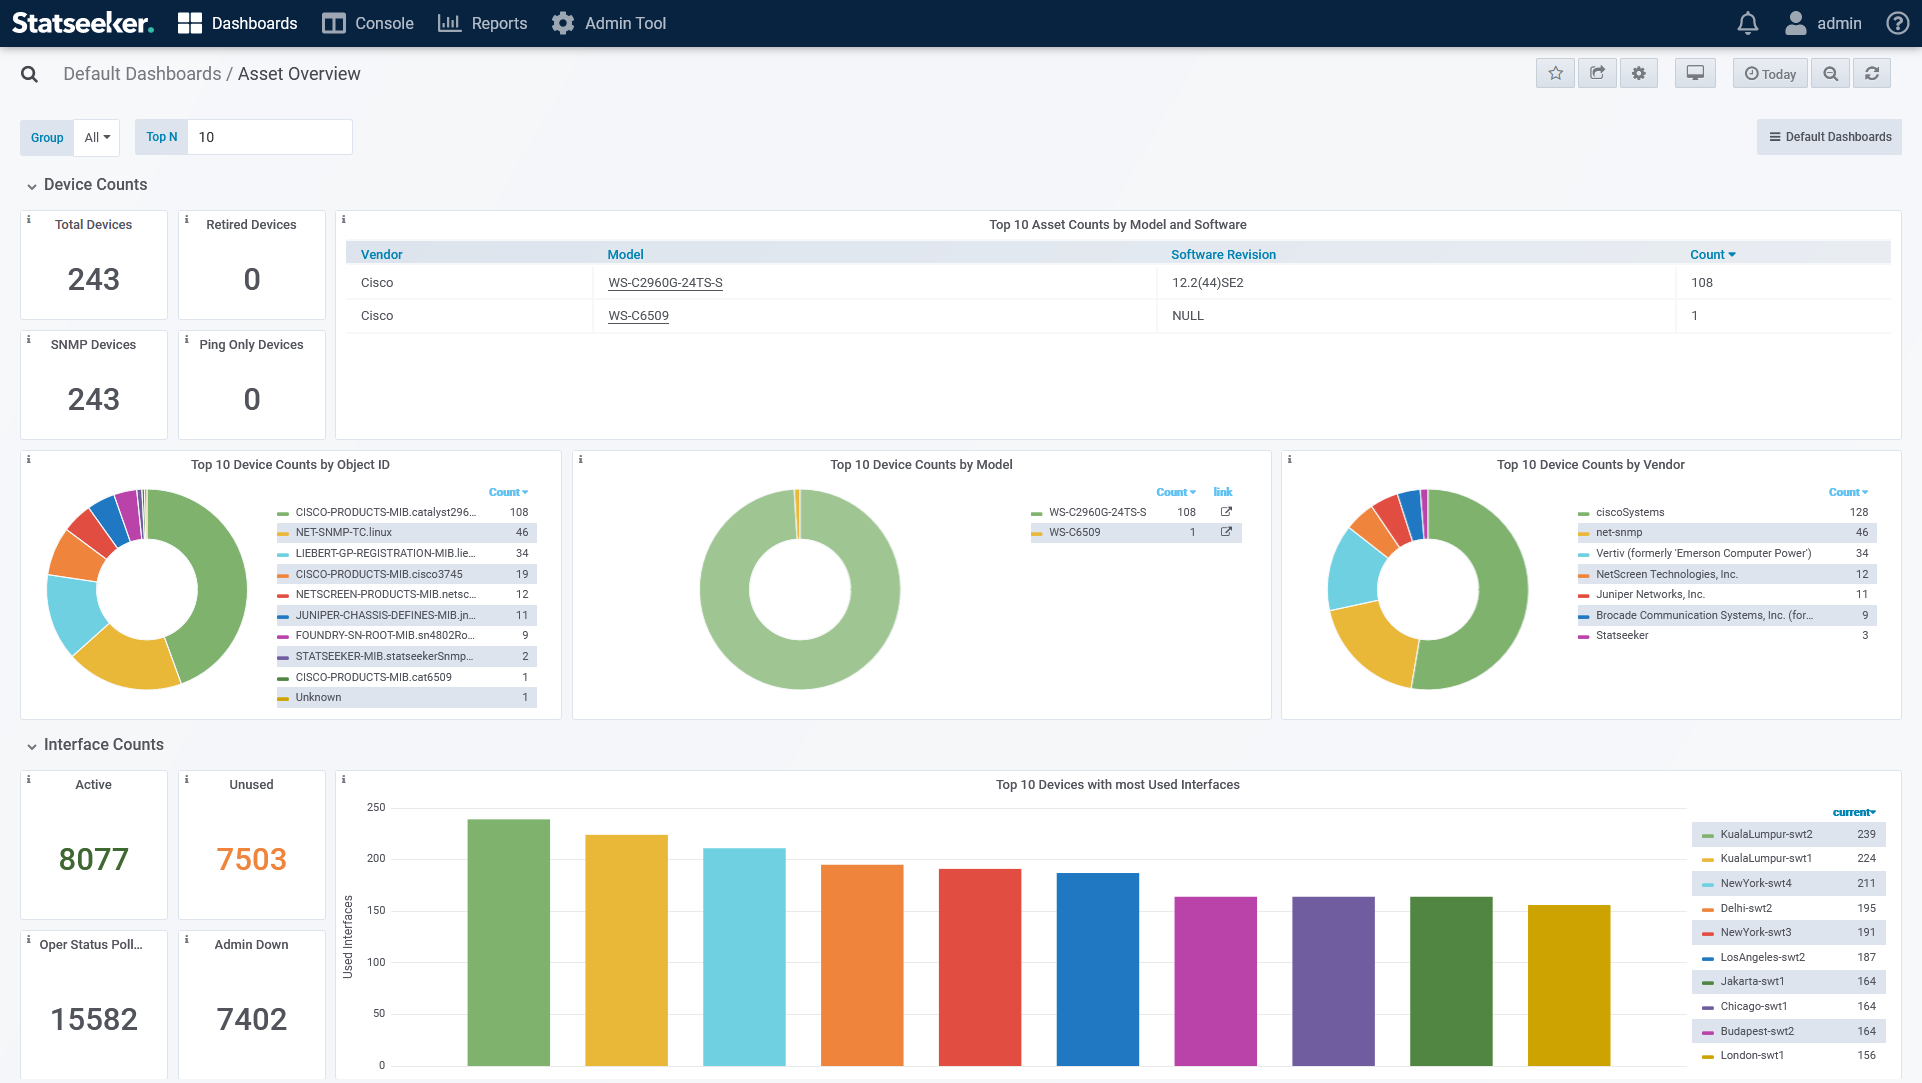
Asset Overview
An overview of the infrastructure makeup of your network, providing details on device and interface counts, MAC/IP configuration, and operational status. Most panels in the dashboard feature drill-down links to breakdowns of this data.
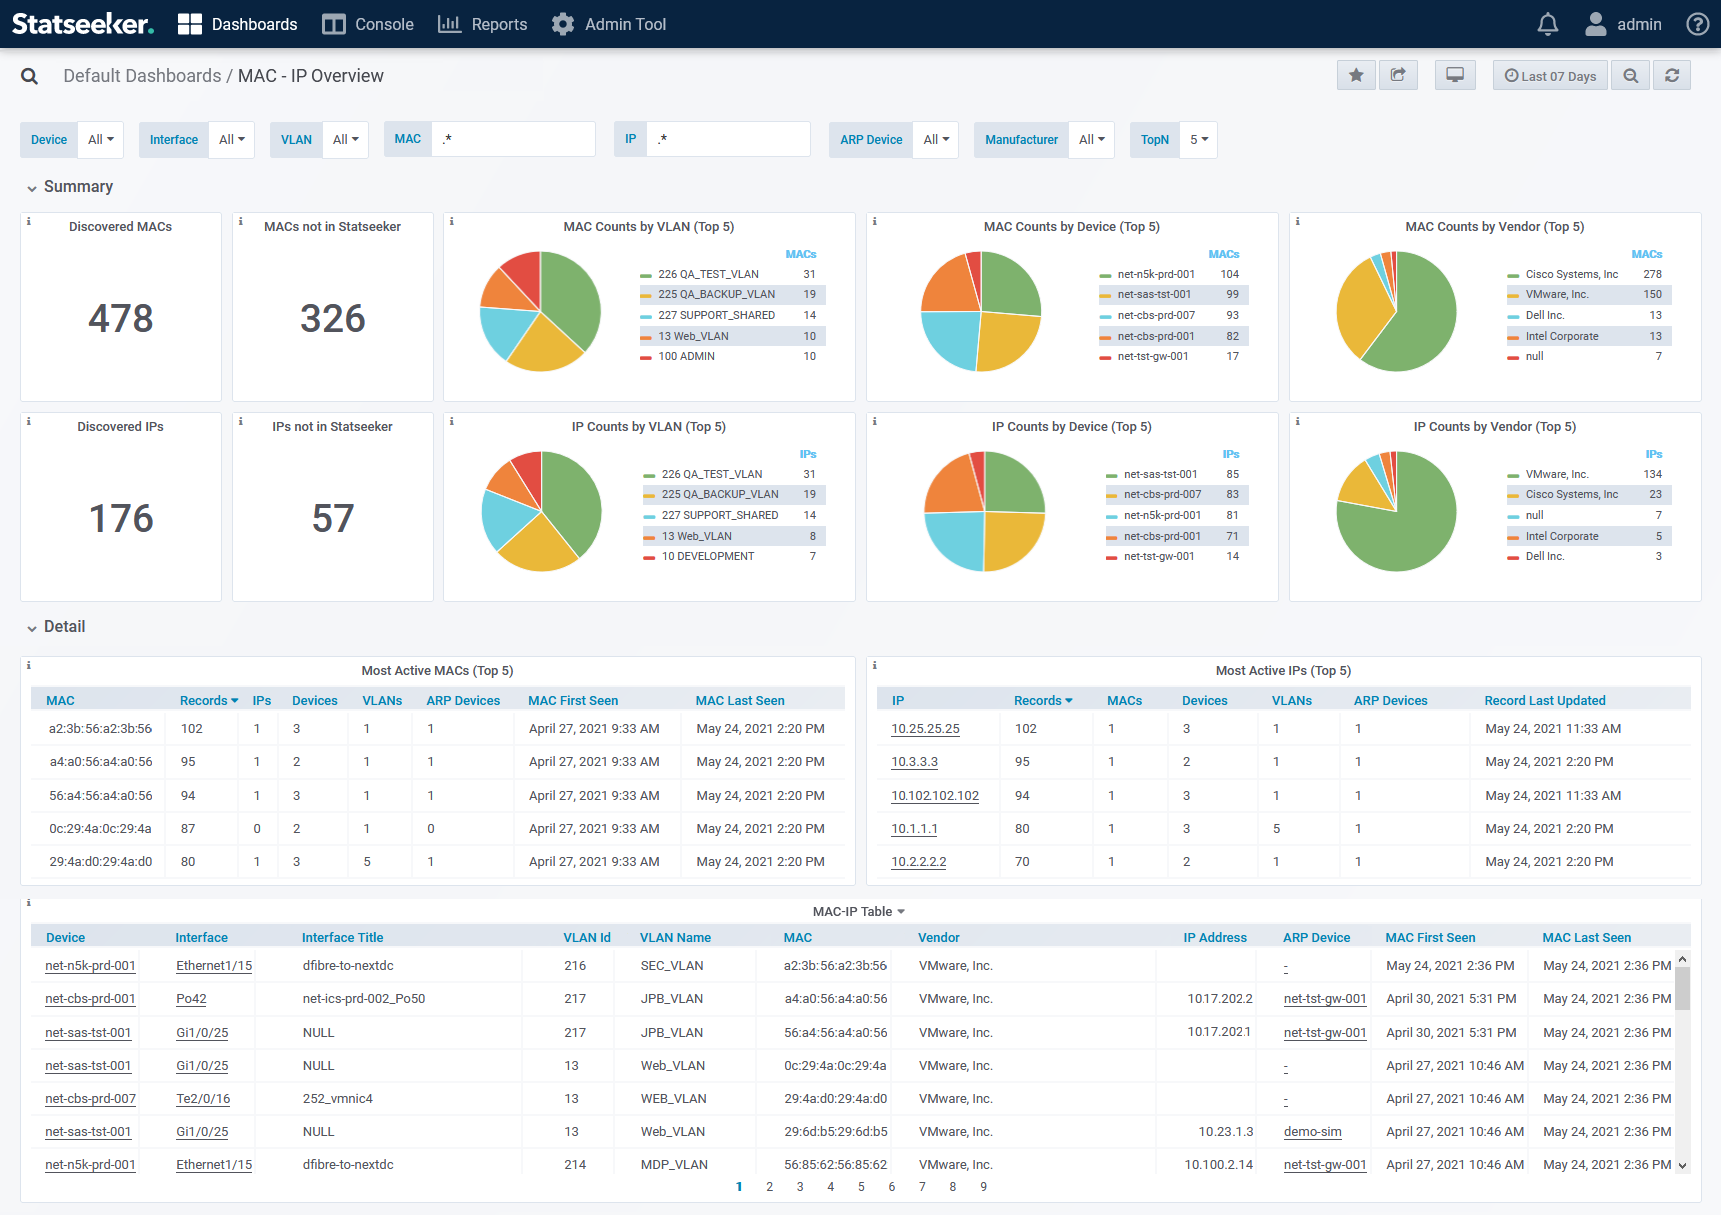
MAC-IP Overview
An overview of the network’s MAC-IP configuration with breakdowns by VLAN, device, interface, and ARP Router
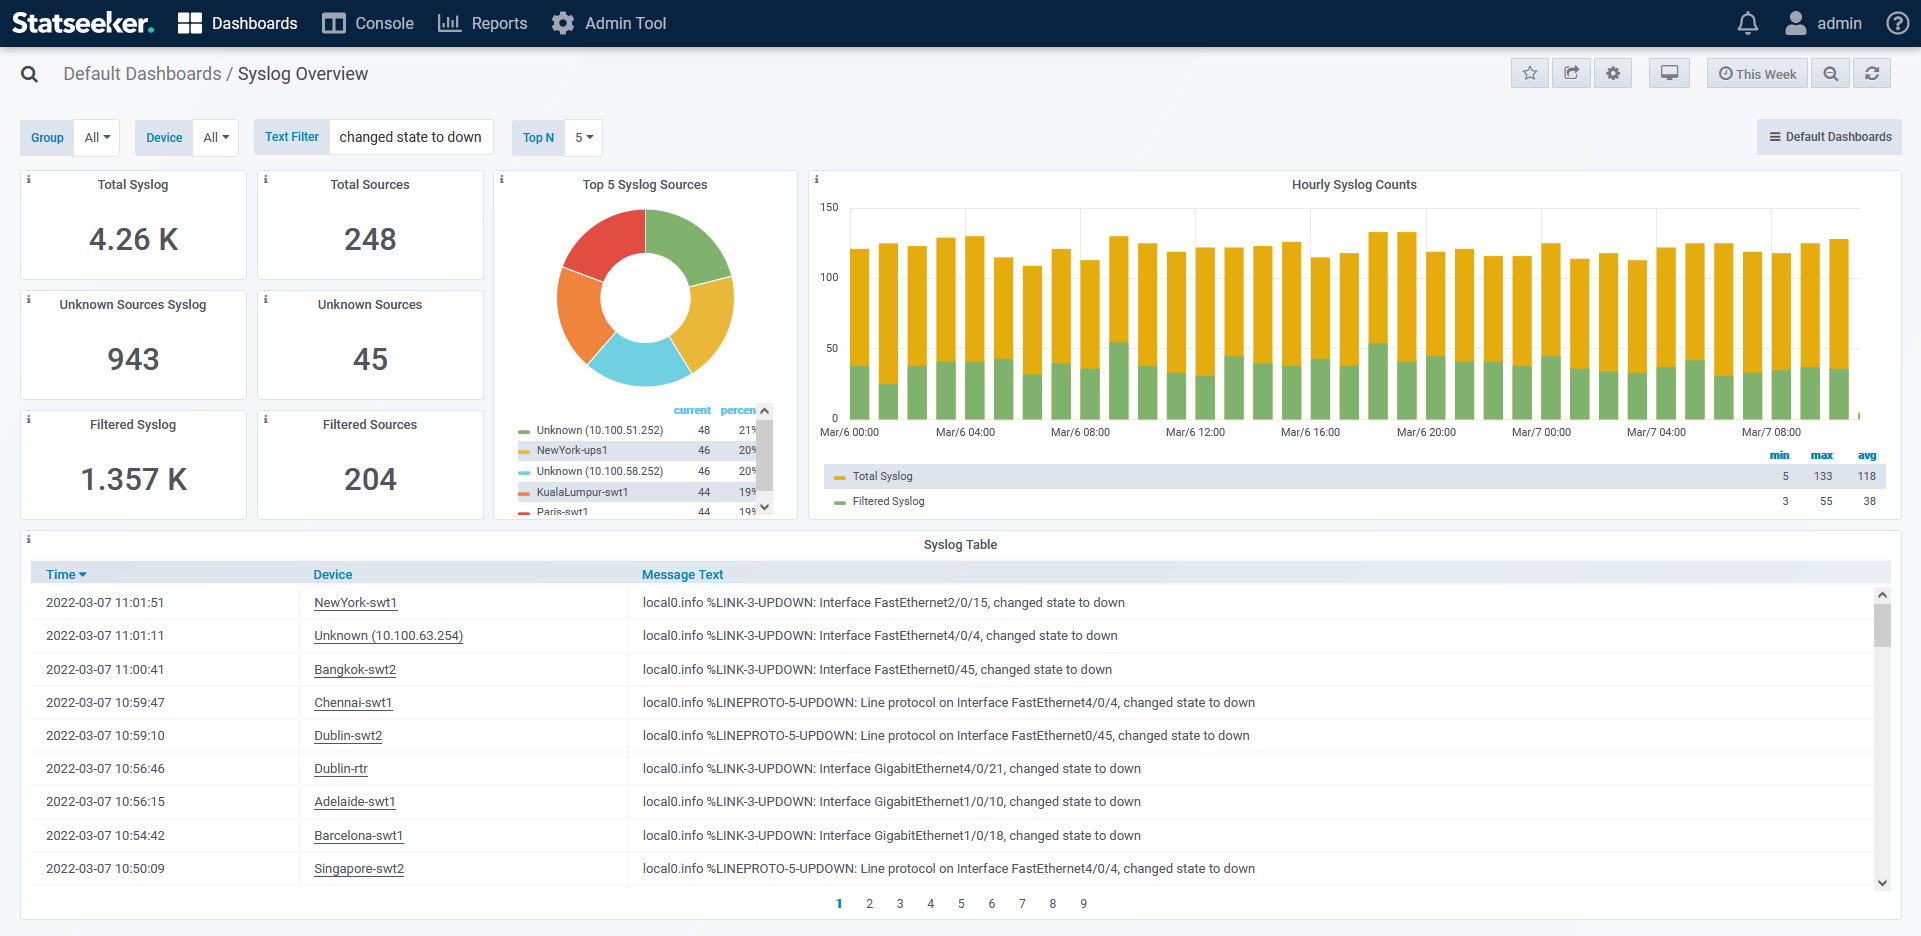
Syslog Overview
Syslog counts and message details, broken down by group, device, and source. The dashboard features drill-down links to detailed syslog reports and the Device Overview dashboard.
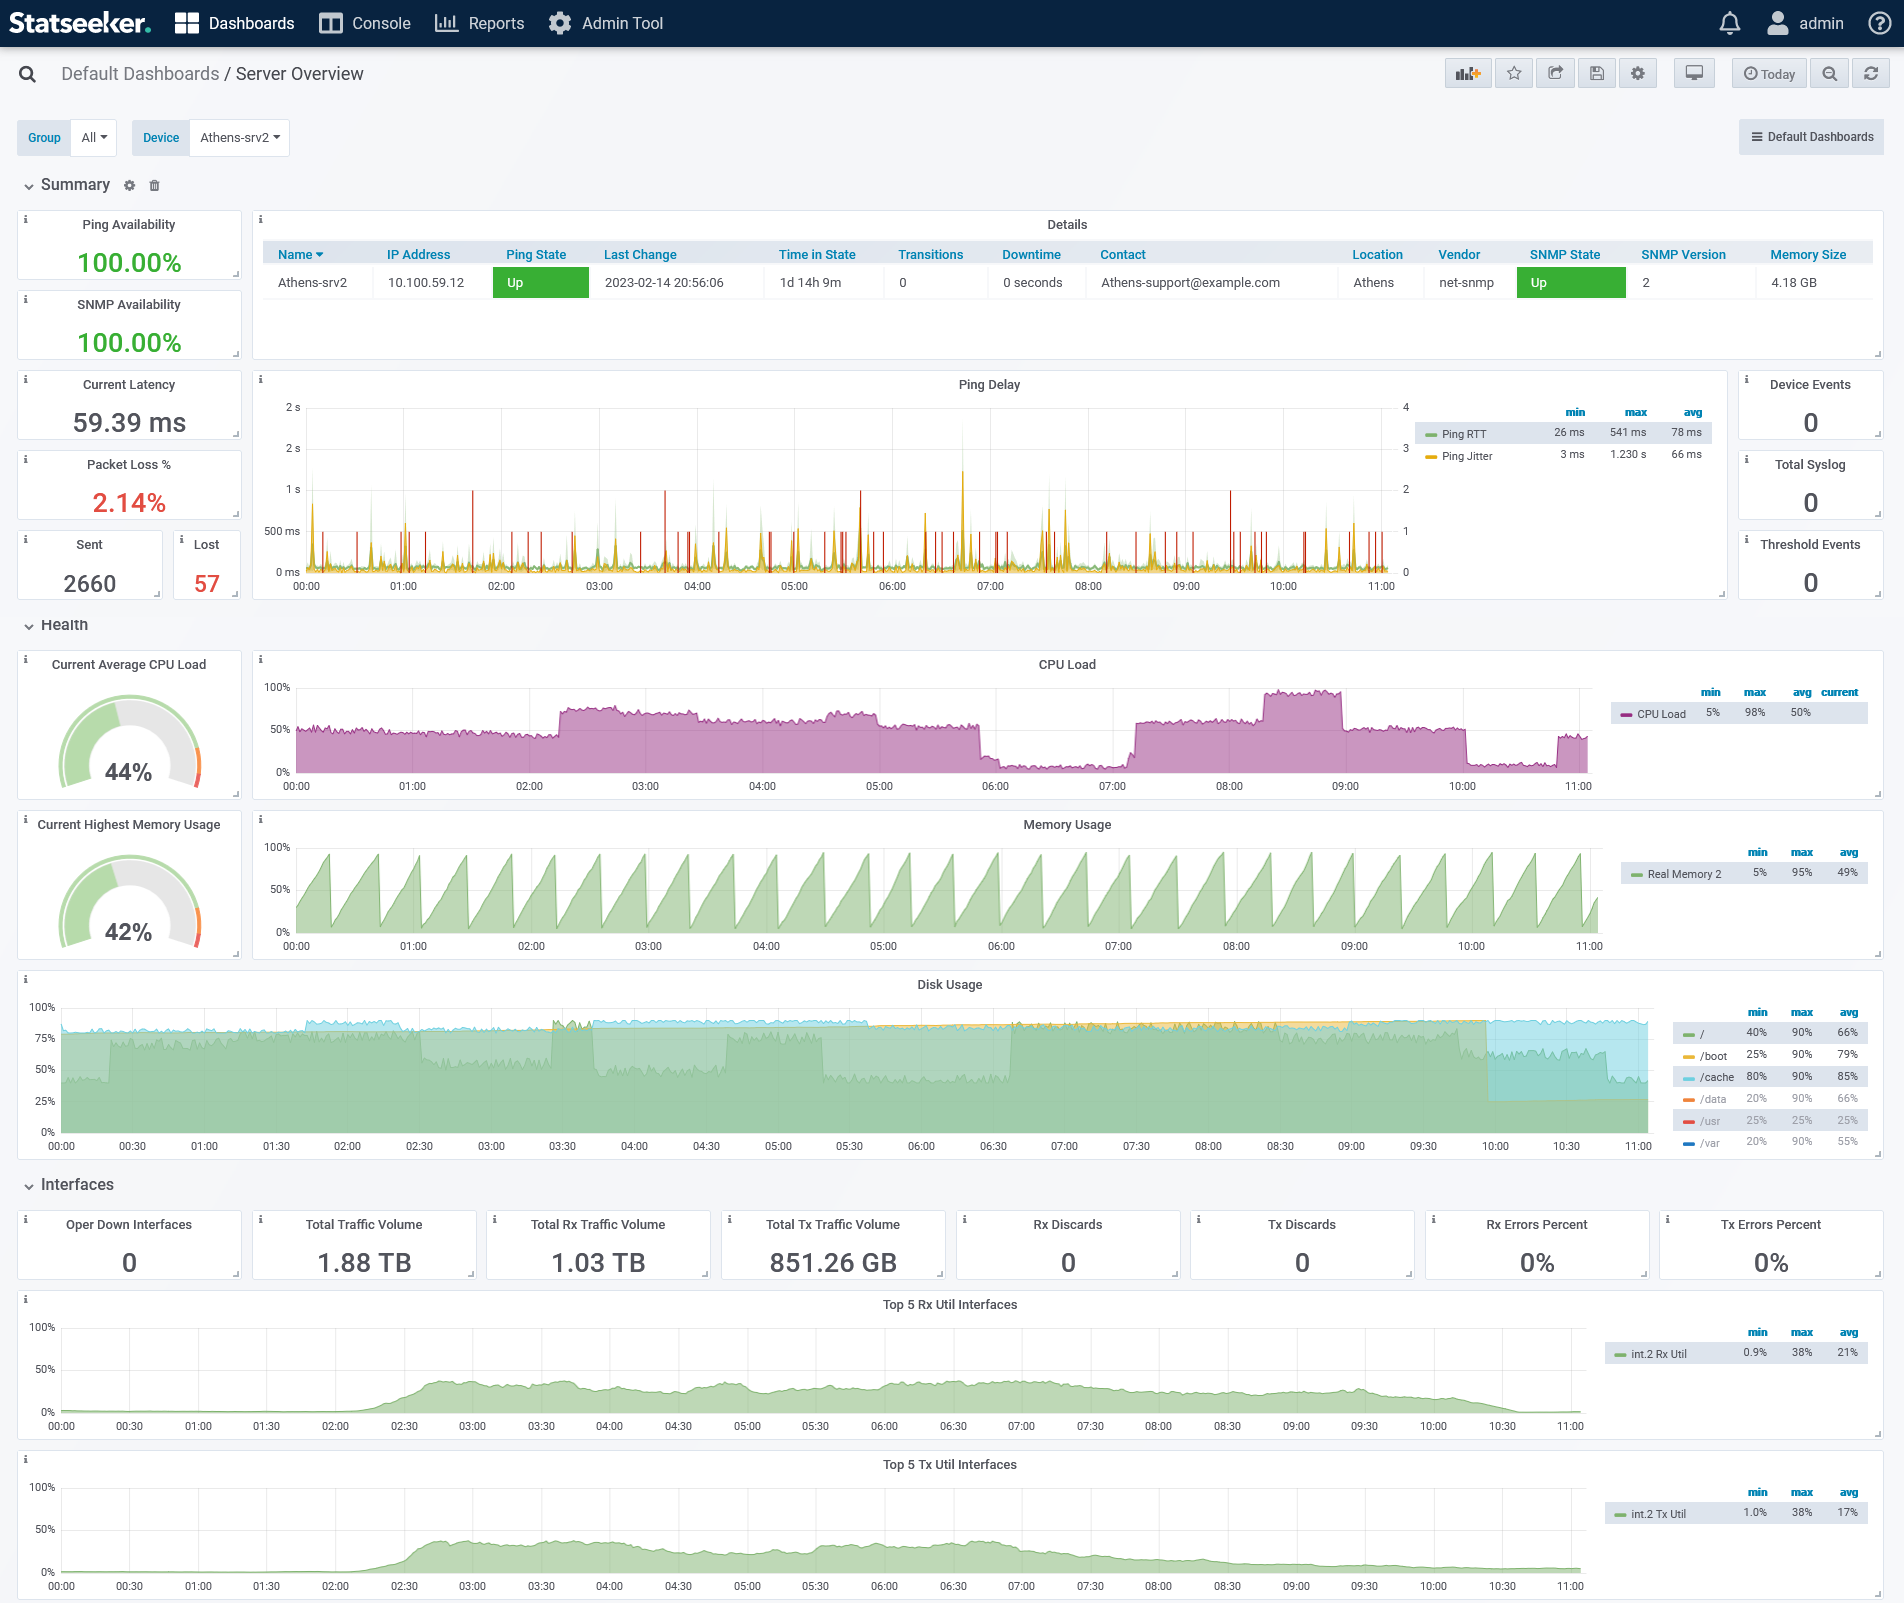
Server Overview
A single device overview providing current state and availability (ping/SNMP) and historical records for a range of server health metrics, including ping, CPU load, memory and disk usage, traffic volumes, as well as event and outgoing syslog counts. The dashboard features drill-down links to detailed device events (ping/SNMP), threshold breaches, syslog reports, and the Interface Overview dashboard.
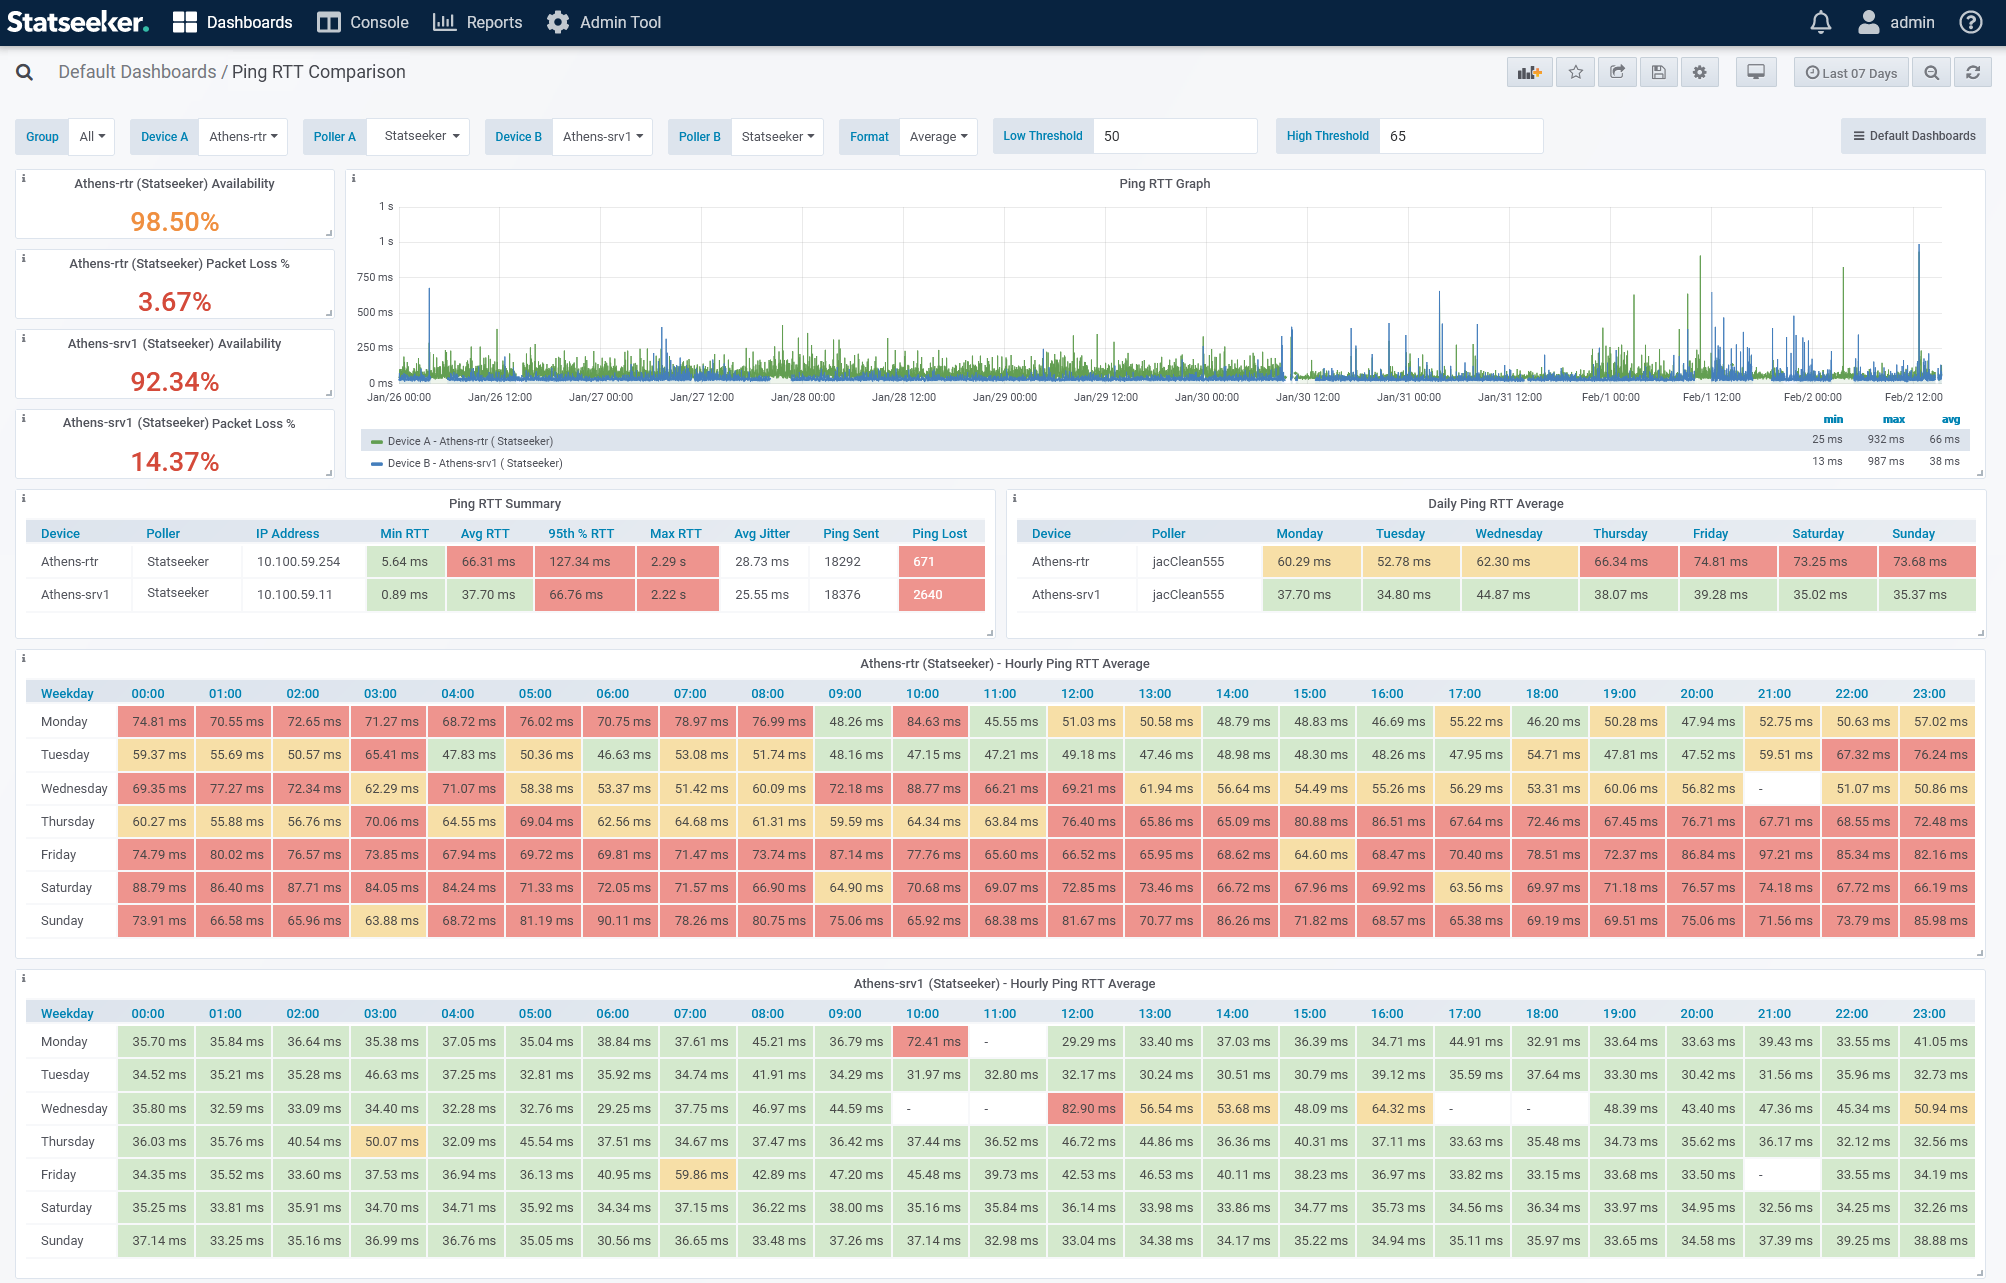
Ping RTT Comparison
Offers a detailed view into the historical Ping data for a device, directly compares that data across two devices, or compares ping data for a single device collected from various polling locations across the network. The dashboard features:
- Variable-driven coloring rules – dynamically assign threshold values to suit the specific devices being reviewed in the dashboard, and have the data colored according to those values
- Drilldowns to historical ping-outage data
Statseeker Server Diagnostic Dashboards
The Statseeker server monitors performance and health metrics for itself and all deployed Observability Appliances, presenting this data in two additional default dashboards. These dashboards are intended to assist Statseeker Support when investigating issues relating to the server and Observability Appliances.
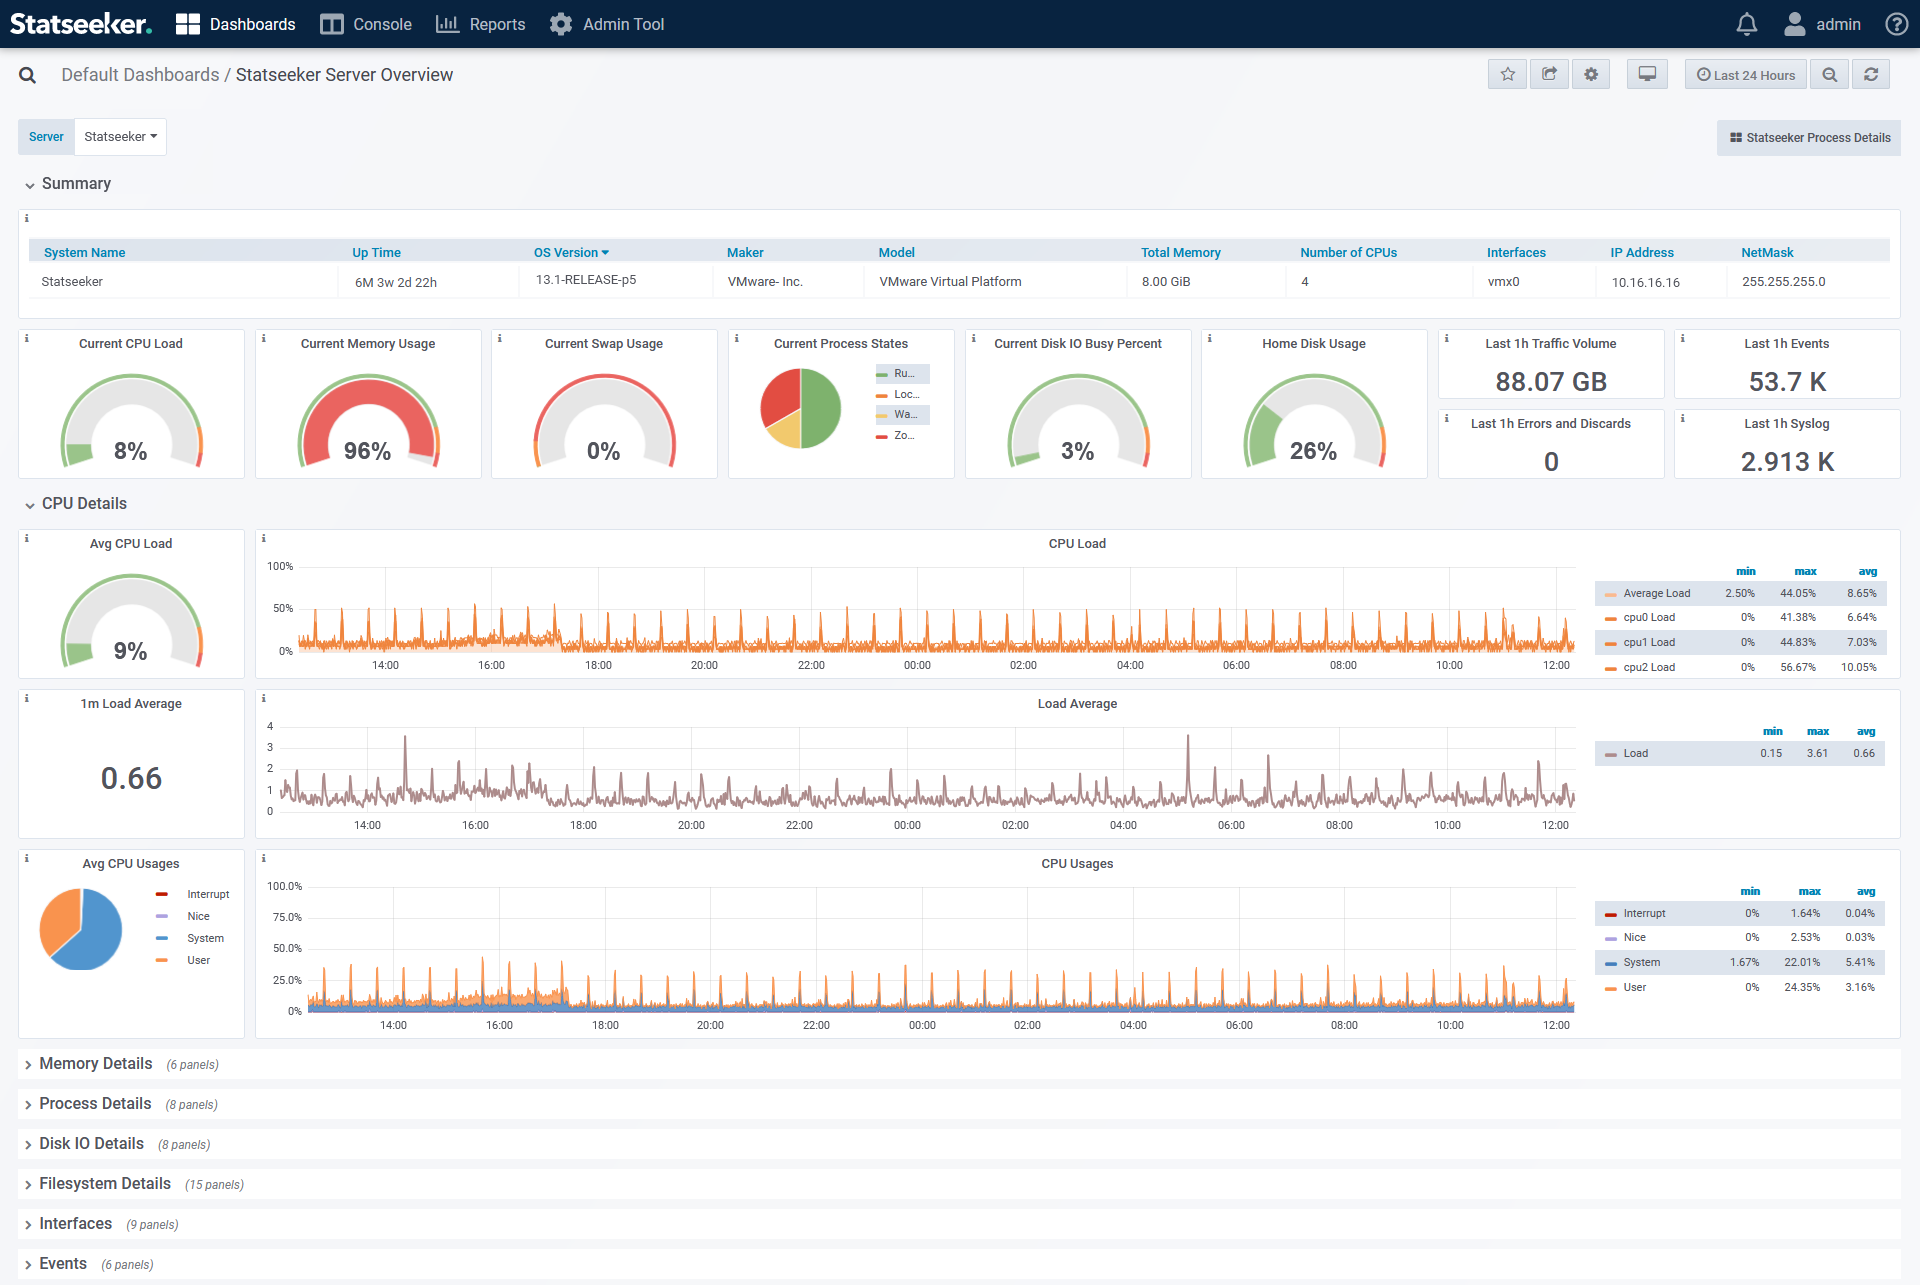
Statseeker Server Overview
This dashboard requires the Admin role to view and is accessed via Administration:
- Select Administration > Statseeker Administration > System Overview
Server/Observability Appliance configuration and health details: CPU, Memory and Disk usage, process states. Intended for diagnostic purposes by Statseeker Support.
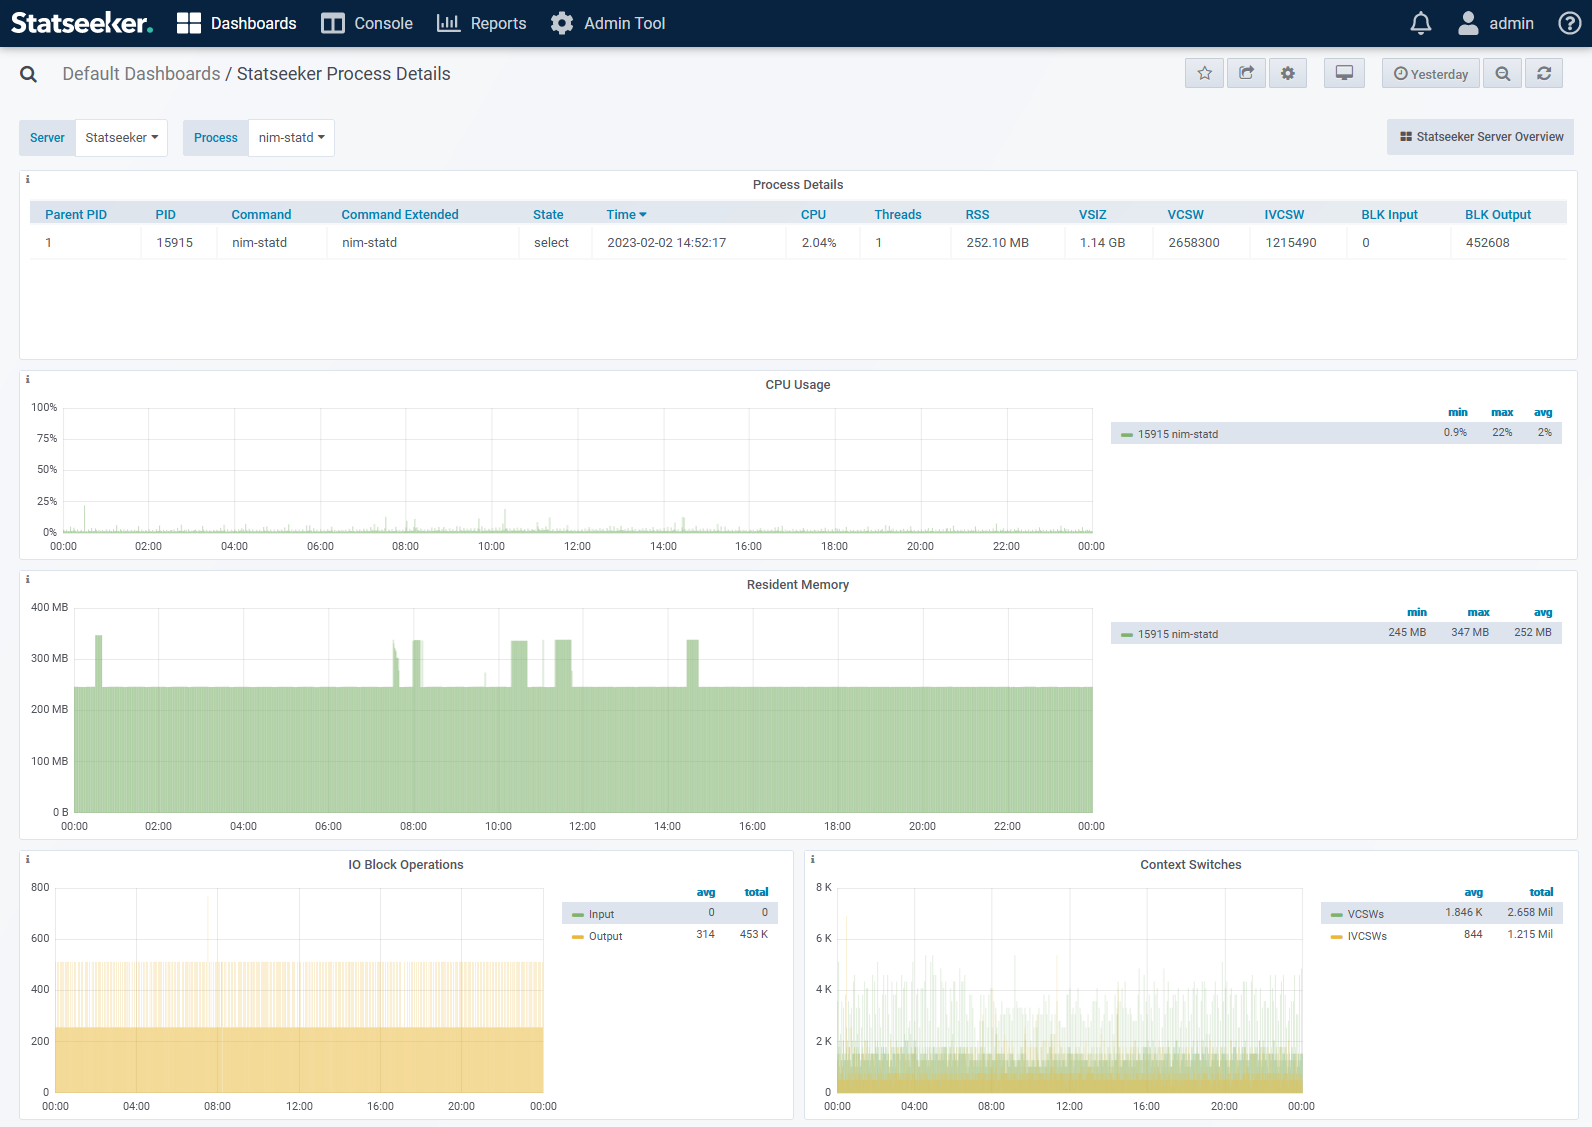
Statseeker Processes
This dashboard requires the Admin role to view and is accessed via Administration:
- Select Administration > Statseeker Administration > Process Details
Performance details on the various processes currently running on the server/Observability Appliance. Intended for diagnostic purposes by Statseeker Support.
Meraki Dashboards
If Meraki Monitoring is also licensed on the server, then an additional range of default dashboards will be located in the Default Meraki Dashboards folder. These dashboards have the same editing restrictions as those found in the Default Dashboards folder. For details on this functionality, see:
Cisco ACI Dashboards
If Cisco ACI Monitoring is also licensed on the server, then an additional range of default dashboards will be located in the Default ACI Dashboards folder. These dashboards have the same editing restrictions as those found in the Default Dashboards folder. For details on this functionality, see:
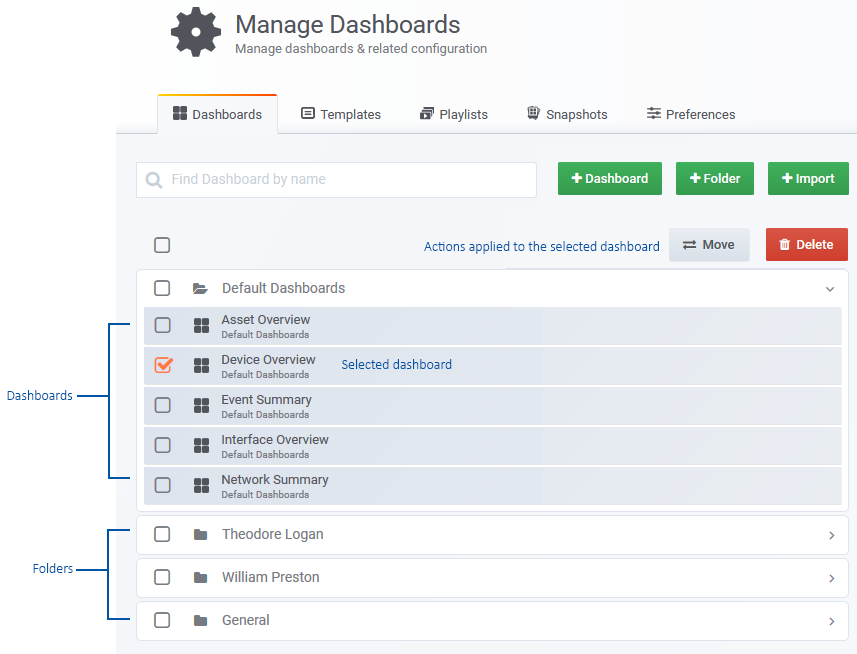
Dashboard Manager
The Dashboard Manager is available from the Dashboards option in the main navigator.
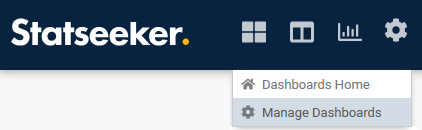
The Manage Dashboards option allows users to:
- Create folders and populate them with dashboards
- Create and edit dashboard playlists
- Create and share dashboard snapshots
- Edit user-specific preferences
Statseeker users with the Admin role can perform these actions with respect to all dashboard content on the server. By default, non-admin users are limited in their ability to manage or interact with dashboard content, but permissions can be assigned (by an admin account) as needed.
Users and Dashboard Permissions
All dashboards have a set of permissions detailing which users can view, edit, move, and delete the dashboard. These permissions may be inherited from the folder that contains the dashboard or may be set against the dashboard specifically.
New folders and dashboards can be edited by their creator and by all admin accounts, but won’t be visible to any other user until permissions are set against the folder/dashboard. Folder and dashboard permissions can be set by specifying the level of access for all user accounts with a specific role (editor/viewer), or for specified user accounts. When conflicting permissions are set against a dashboard or folder, the highest level of access is used.
Roles: Admin, Editor, Viewer, & Restricted
By default, every non-admin account is set as a Dashboard Viewer. The default role applied to new accounts can be set in Administration, and individual accounts can be set to an alternate role as needed, see User Accounts: Default Settings.
Restricted
- No access to view or edit any dashboard content
Viewer
- Can view the General and Default Dashboards folders, and their content
- Can view, but cannot create or edit dashboards
- Cannot create or edit dashboard folders
- Can run playlists, but cannot create or edit playlists
- If a playlist contains a dashboard that the viewer does not have permission to view, then they will be presented with an alert message highlighting the issue for the period that the dashboard would be displayed. All other dashboards in the playlist are unaffected.
Editor
- Can create folders (where they are automatically given editor permissions) for personal use, but cannot edit the folder permissions to give access to other users
- Can view, create, edit, and delete dashboards
- Can view and use default templates
- Can view, create, edit, and delete custom templates
- Can create or edit playlists
- Can move dashboards from their own folders into the General folder
- Cannot edit the Default Dashboards folder or its contents
- Image Map Images:
- Can upload images for use in Image Map panels
- Can see shared images that have been uploaded by other users
- Can not share images (sharing an image requires the admin role)
- Can delete own uploaded images
Admin
Statseeker users with the admin role:
- Cannot edit the Default Dashboards folder or its contents
- Can create and edit folders, playlists, and template categories
- Can view and use default templates
- Can view, create, edit, and delete custom templates
- Can manage permissions on dashboards, folders, and templates
- Image Map Images:
- Can upload images for use in Image Map panels
- Can share uploaded images for use by non-admin users
- Can see and delete any uploaded image
Overriding Roles
Dashboard Roles can be overruled by permissions set against individual folders or dashboards. For example:
- A folder can be created, and folder-specific permissions set, to give dashboard viewers the right to edit the content of that folder
- A user can be assigned the Restricted role, but user-specific permissions applied to a dashboard (or folder of dashboards) to grant that user Viewer permission
Network Visibility
Regardless of the dashboard content and configuration, the current user will only see data relating to those devices that they have visibility of in the Console. For example, if a dashboard panel is configured to display data from a specific device (or group of devices) and the user does not have access in the console to view those devices, then the panel will display ‘no data’. For more information on managing user account network visibility, see Users and Grouping.
Folders and Permissions
Statseeker comes with default dashboard folders, (Default Dashboards, Default Meraki Dashboards, and Default ACI Dashboards), and General. These folders and their content can be accessed by all Statseeker users. Editor and Admin accounts can create additional dashboard folders and assign view/edit permissions to these folders. All dashboards inherit these permissions from their parent folder, and permissions can be assigned at the dashboard level to extend or override inherited permissions.
When viewing a dashboard, the dashboard name and parent folder are displayed as ‘breadcrumbs’ in the top left. Clicking the parent folder will pop out the side panel presenting the contents of the selected folder.
Dashboard Editors can always edit their own creations, but only admin accounts can set permissions for other users. An admin account is required for setting permissions to allow users to interact with content outside of the Default Dashboards, Default Meraki, Default ACI, and General folders.
Folder permissions of Edit and View can be configured for users in Folder Settings, and the folder content will inherit those permissions. Permission can also be set within dashboard Settings, and will override any inherited permissions.
Folder Settings
Folder Permissions are configured from the Dashboard Manager:
- Hover over the folder row to display the folder settings button
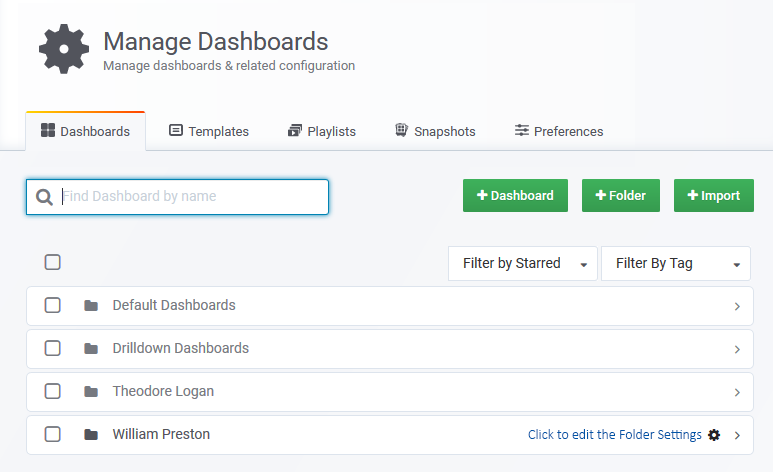
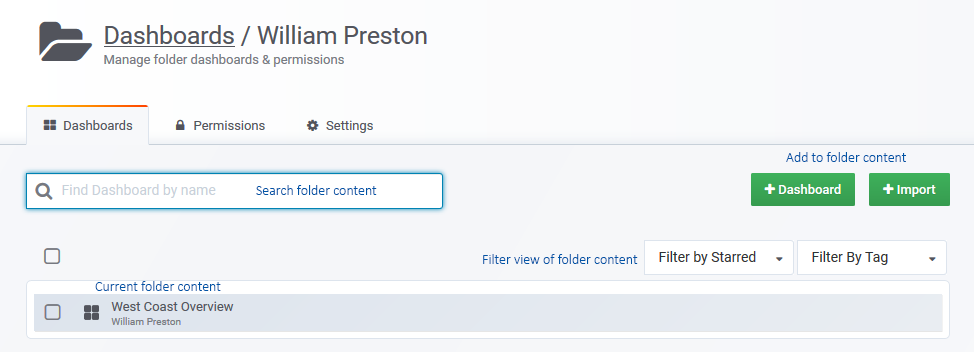
Dashboards Tab
Presents the current folder content, tools to filter this content, and options to add to the folder content by creating or importing dashboards.
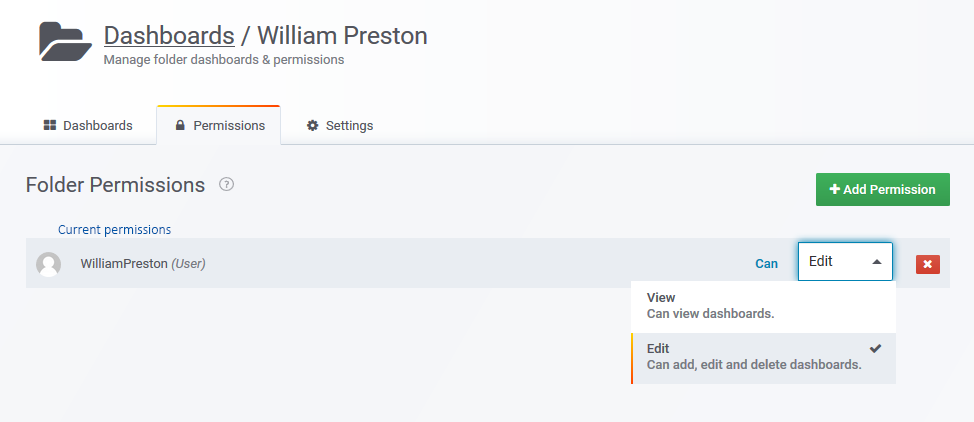
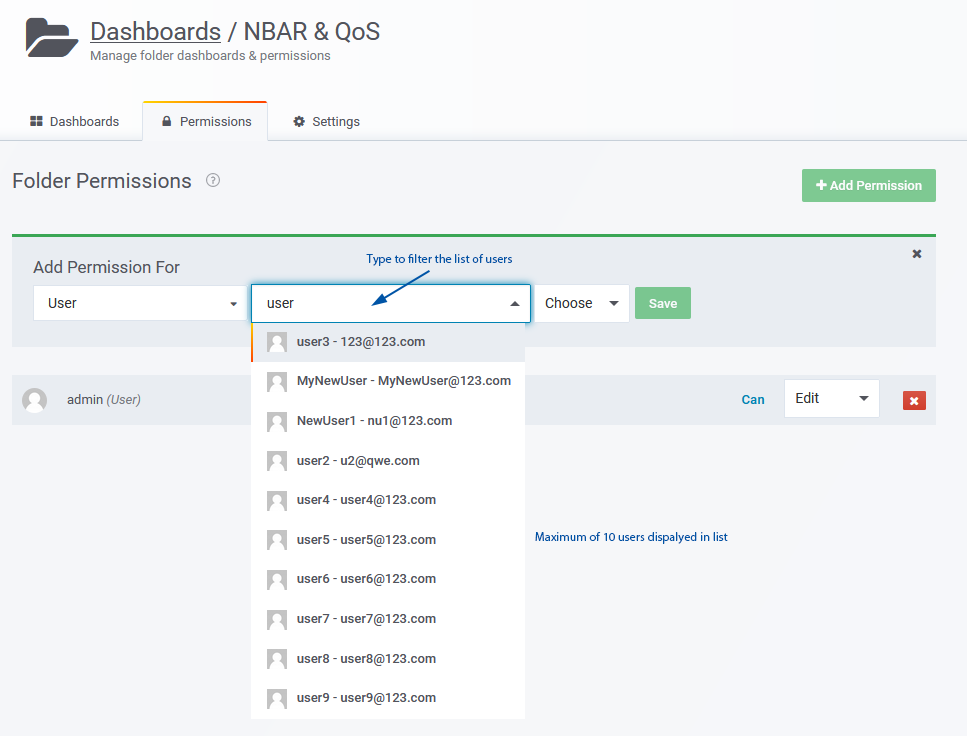
Permissions Tab
Folder permissions are inherited by all dashboards housed within the folder. Existing permissions can be edited, new permissions can be added, and permissions can be assigned against either a user or role (viewer, editor). Permissions set against specific dashboards will override conflicting permissions set against the parent folder.
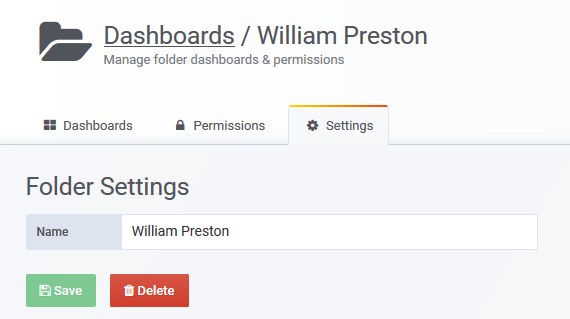
Settings Tab
The folder can be renamed in the Settings tab.
Statseeker Default Folders
There are three default server-level folders:
- Default Dashboards – contains non-editable, default dashboards created by Statseeker
- Default ACI Dashboards – (Cisco ACI Monitoring license required) contains non-editable, default Cisco ACI dashboards created by Statseeker
- Default Meraki Dashboards – (Meraki Monitoring license required) contains non-editable, default Meraki dashboards created by Statseeker
- General – all users have access to view the content of the General folder, editors can add dashboards to the General folder, and Admin users can edit and manage the contents of the folder
Create and Configure a Dashboard User
The process required to create a dashboard user varies a little between admin users, editors, and viewers.
Admin User
- Create the Statseeker user account if it doesn’t already exist, see Creating New Users for details
- Assign the user the Is Admin role, and Save the user configuration
- Associate the user account with the All Groups group, or a selection of groups as necessary, see Users and Grouping for details
The user account now has admin access within the dashboard module, nothing further is needed.
Dashboard Editor
- Create the Statseeker user account if it doesn’t already exist, see Creating New Users for details
- Associate the user account with the All Groups group, or a selection of groups as necessary, see Users and Grouping for details
The user will now be able to:
- View content in the Default Dashboards and General folders
- View content in any folder with a Viewer role-level permission set and any folder with an appropriate user-level permission
- View playlists
To provide Editor access:
- Give the user the Editor Dashboard User Role, see Users: Default Settings
The user will now be able to:
- Create their own folders in order to provide a space to create and test dashboards outside of the General folder
- Edit content in the General folder, any folder with an Editor role level permission set and any folder with an appropriate user-level permission
- Move content from any folder where they have edit permission to the General folder
- Create, edit and use panel templates
- Create and edit playlists
Dashboard Viewer
- Create the Statseeker user account if it doesn’t already exist, see Creating New Users for details
- Associate the user account with the All Groups group, or a selection of groups as necessary, see Users and Grouping for details
The user will now be able to:
- View content in the Default Dashboards and General folders
- View content in any folder with a Viewer role-level permission set and any folder with an appropriate user-level permission
- View playlists
Dashboards
The Dashboards tab contains dashboard management actions:
- New Dashboard
- New Folder
- Import
- Move
- Delete
While Admin users can manage all content on the server, dashboard editors are restricted to just the folders and dashboards they have created and those which they have been granted permission to edit.
In addition, Admin users can use the Dashboards tab to manage folder and dashboard-specific access permissions for other users on the server.
New Dashboard
The new dashboard button creates a new dashboard and switches the view to that dashboard in edit mode.
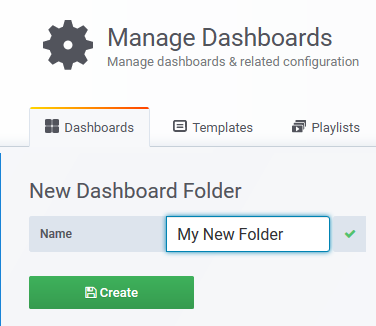
New Folder
Click to create a new folder. Once created, you can configure the folder permissions and populate the folder as required.
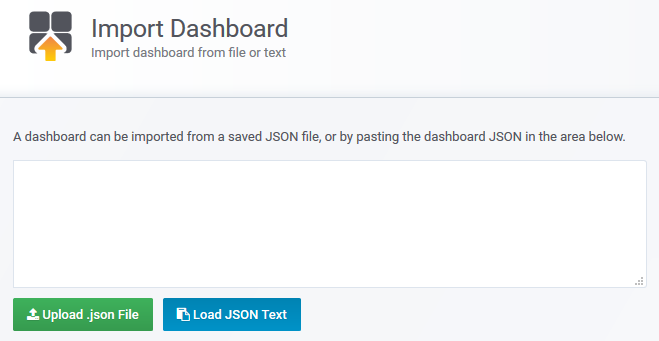
Import
You can create a new dashboard by importing the configuration of an existing dashboard. The existing dashboard configuration can be exported to a file and uploaded to your Statseeker server. Alternatively, you can view the dashboard’s configuration in JSON format, copy this to your clipboard, and paste it directly into the Import Dashboard text box.
Move
- Use the checkboxes to select the dashboards (selecting a folder will select all dashboards in that folder)
- Click Move
- Select the destination folder, or opt to create a new folder to set as the destination
Delete
- Use the checkboxes to select the dashboards (selecting a folder will select the folder and all dashboards in that folder)
- Click Delete
Panel Templates
Panel templates are preconfigured panels that can be added to dashboards. Statseeker comes with a range of default panel templates, and any panel can be saved as a custom template to be reused as needed.
For more information, see Panel Templates
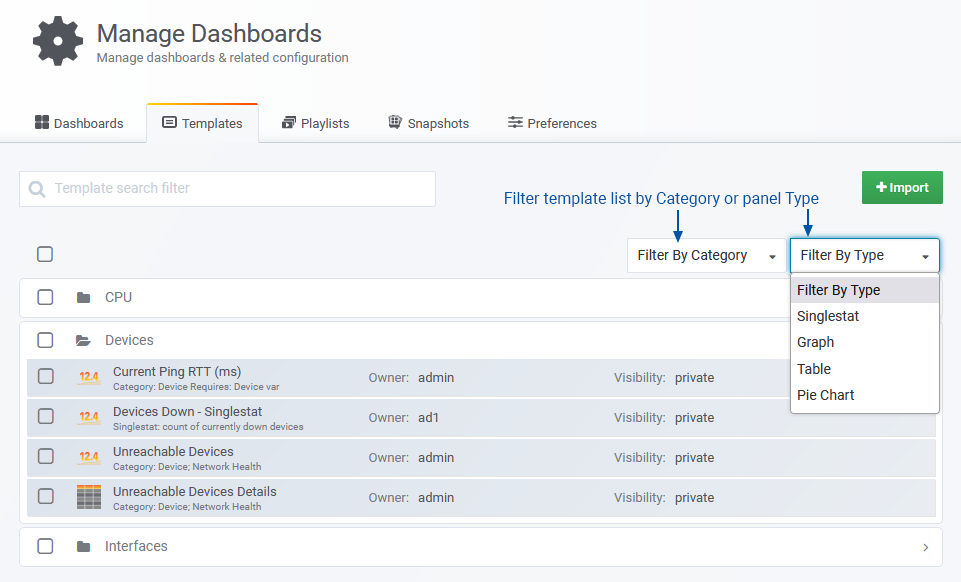
Filter Templates List
Template configurations are labelled with a Category and saved in a template folder with the same name as the specified category. Template filters are displayed above the template list, offering dropdowns to filter your templates by Category and/or panel Type.
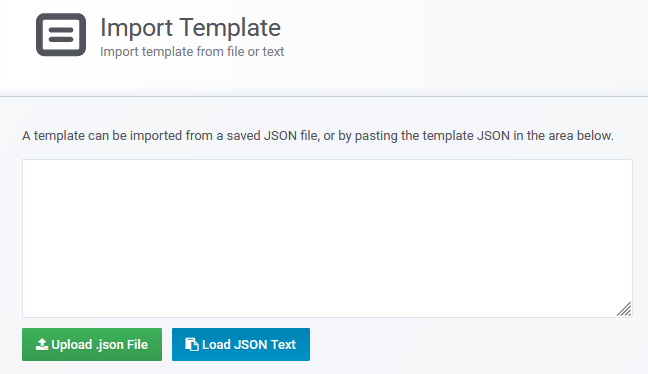
Import
The Import option allows users to add pre-configured templates to an existing server. A template configuration can be exported to a file and subsequently uploaded to a Statseeker server. Alternatively, you can view the template’s configuration in JSON format, copy this to your clipboard, and paste it directly into the Import Template text box.
The Import Template function requires dashboard editor permission, and can be accessed from:
- Dashboard Home (buttons in the top-right)
- Dashboard Manager > Templates tab
- The dashboard Search GUI
Editing Templates
Once created, a template’s configuration can be updated by the Owner and Admin users.
- Click the template name to open the template configuration
- Update the configuration as needed and click Save
Move/Re-Categorize
Once created, a template’s configuration can be updated by the Owner and Admin users. Templates are organized into folders labelled with the name of the template category. To update the Category of an individual template:
- Click the template name to open the template configuration
- Update the Category and Save the template
To apply a bulk update:
- Use the checkboxes to select the templates, selecting a folder/category will select all templates in that folder
- Click Move
- Select the destination folder, or opt to create a new folder to set as the destination
Delete
Once created, a template’s configuration can be updated by the Owner and Admin users.
- Use the checkboxes to select the templates, selecting a folder/category will select the folder and all templates in that folder
- Click Delete
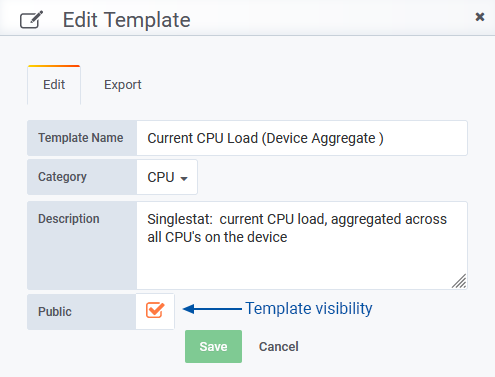
Template Visibility
Once created, a template’s configuration can be updated by the Owner and Admin users. Template visibility is managed via the template’s Public flag.
- Public – can be used by all dashboard Editors and Admin users
- Private – can only be used by the Owner (account that created the template) and Admin users
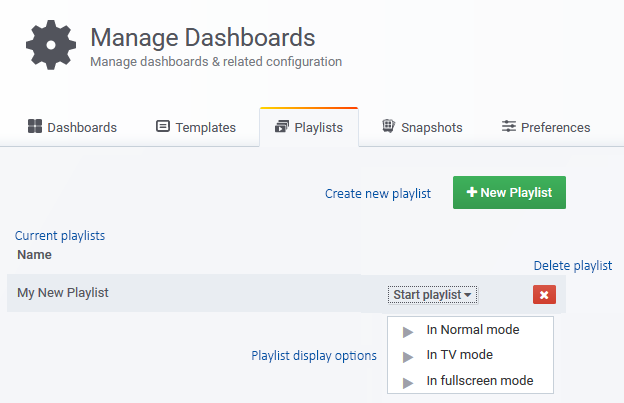
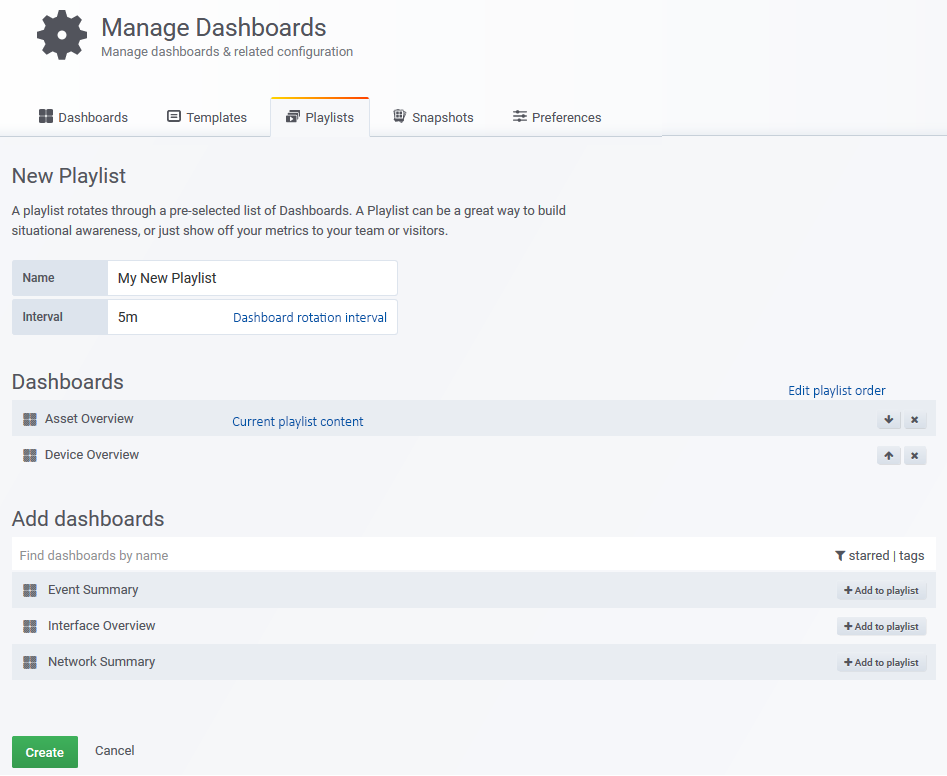
Playlists
A dashboard playlist allows you to automatically rotate through the display of selected dashboards. Once a playlist is running, the dashboard header includes playlist controls allowing you to skip through dashboards or stop the playlist.
Creating a Playlist
- Name the playlist
- Set the rotation interval
- Populate the playlist and edit the playlist order as needed
Playlist Options
- Normal Mode – presents playlist within the standard Statseeker dashboard panel
- TV Mode – hides playlist controls after 1min of inactivity. Any mouse/keyboard activity will show these controls again.
- Fullscreen Mode – collapse the main navigator and hide the playlist controls. Click the display header to exit.
Snapshots
A snapshot is a canned view of a dashboard, including all data and filter settings as at the time the snapshot was taken. Snapshots can be shared with anyone with access to the Statseeker server, allowing them to view the snapshotted data, regardless of any permissions that would normally prevent them from viewing it.
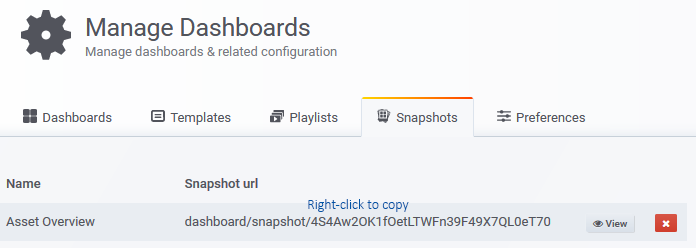
While the Snapshots tab in the Dashboard Manager allows every Statseeker user to view and access the server’s snapshots, the snapshots themselves are created from within the dashboard itself. See Exporting and Sharing Dashboards for details.
Preferences
The Preferences tab allows you to:
- Set the theme (light/dark) used when displaying dashboards
- Set the default landing page when selecting Dashboards from the main navigator
- Enable access to the advanced query type – this will require Statseeker support assistance to configure
- Specify the tile map provider service for Worldmap panels
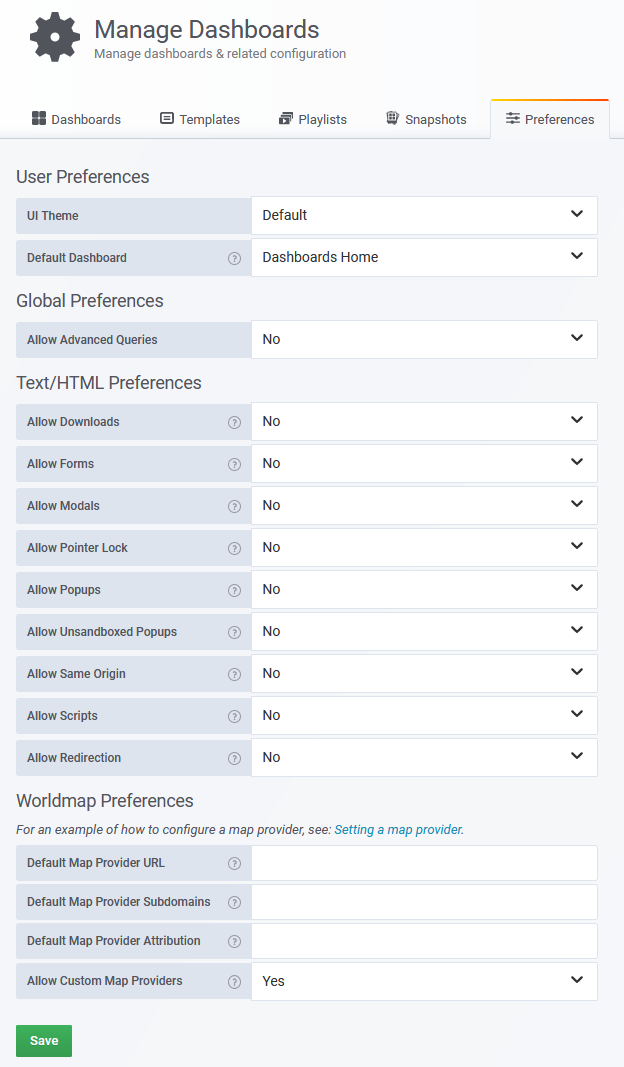
User Preferences
These settings are user specific.
UI Theme
Assign the UI color theme.
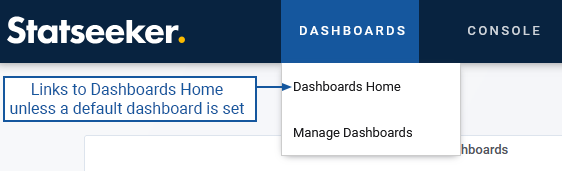
Default Dashboard
You can select a dashboard as the landing page for the Dashboard link in the main navigator. By default, this landing page is Dashboard Home, but you can specify one of your ‘starred’ dashboards from the Dashboard Manager > Preferences page.
To specify the dashboard landing page:
- Select Dashboard Manager > Preferences
- Select a ‘starred’ dashboard from the list and click Save
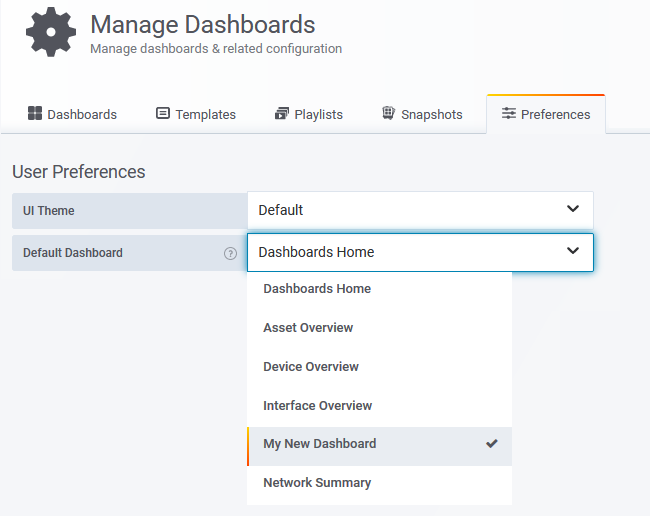
The list content is the Dashboard Home page, and every dashboard that you have ‘starred’ to flag as a dashboard favorite. Dashboards can be starred/favorited from Dashboard Home or the dashboard itself. For details, see Dashboard Favorites.
Global Preferences
Allow Advanced Queries – toggle access to the Advanced query type for panel configurations. The Advanced query type is typically reserved for Statseeker Support to provide assistance with troubleshooting and complex panel configurations. Customer use of the Advanced query type is not supported by Statseeker.
Text/HTML Preferences
The Text/HTML panel can be configured to contain embedded external content in a Statseeker dashboard (see Text/HTML Panels for details). The settings presented here offer the ability to restrict the functionality of any content hosted within the Text/HTML panel.
These settings:
- Apply to all Text/HTML panels on the server
- Are disabled by default on all fresh installs of Statseeker v5.5.5 or greater
- Are enabled by default on all servers upgrading from Statseeker v5.5.4 or earlier
| Setting | Effect |
| Allow Downloads | Allow downloads to occur from sources presented in, or triggered by, the hosted content |
| Allow Forms | Allow the hosted content to submit forms |
| Allow Modals | Allow the hosted content to open modal windows |
| Allow Pointer Lock | Allow the hosted content to use the Pointer Lock API (manages interpretation of, and responses to, mouse actions) |
| Allow Popups | Allow the hosted content to activate popups |
| Allow Unsandboxed Popups | Allow the hosted content to open new windows without those windows inheriting the restrictions specified by the settings presented here |
| Allow Same Origin | If not enabled, the resource is treated as being from a special origin that always fails the same-origin policy (potentially preventing access to data storage/cookies and JavaScript APIs) |
| Allow Scripts | Allow the hosted content to run scripts (but not create popup windows) |
| Allow Redirection | Allow the hosted content to navigate the Statseeker window to another URL |
Worldmap Preferences
The Worldmap Preferences section allows you to assign a global/default map tile provider to be used with the dashboard worldmap panel. This provider is a 3rd party service providing a dynamic, scalable map resource. There is a range of commercial and open-source tile providers available, offering a hosted/online service or providing the framework for deploying and hosting your own internal tile server.
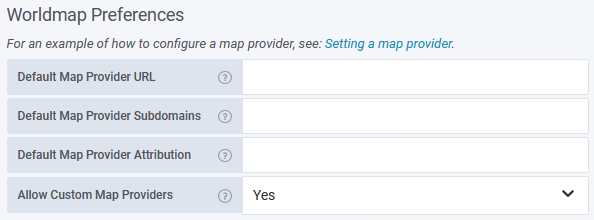
- Default Map Provider URL – specify the URL used to access your default tile map service. The URLs for these services feature a number of notable parameters to identify the resource being displayed. These parameters are:
- {s} – (optional) a comma-separated list of subdomains, typically used by externally hosted services to spread the request load across multiple resources
- {x} – the X-coordinate of the map tile
- {y} – the Y-coordinate of the map tile
- {z} – the zoom level of the map
The order and location of these parameters within the URL may vary between providers. Refer to your map service provider’s documentation for the appropriate URL or utilize one of the example configurations provided below.
Note: Statseeker requires that the {x}, {y}, and {z} parameters are specified in lower-case.- If your provider documentation specifies the server URL as: https://maps-for-free.com/layer/relief/z{Z}/row{Y}/{Z}_{X}-{Y}.jpg
- Statseeker requires the URL to be specified as: https://maps-for-free.com/layer/relief/z{z}/row{y}/{z}_{x}-{y}.jpg
- Default Map Provider Subdomains – optionally, list the map provider subdomains to use. Each value in this string will be considered a valid subdomain for the {s} parameter in the Default Map Provider URL. This is a string of comma-separated values, no spaces. See your map service provider’s documentation for requirements.
Example: a,b,c or mapsub1,mapsub2,mapsub3
- Default Map Provider Attribution – enter any licensing attribution content required by your map service provider, see your map service provider’s documentation for requirements
- Allow Custom Map Providers – grant/deny permission for your dashboard editors to specify an alternate, panel-specific, map provider in the Worldmap panel configuration
Example Service Provider URL Configurations
| Map | Default Map Provider URL | Default Map Provider Attribution | Subdomains |
| OpenStreet:Default | http://{s}.tile.openstreetmap.org/{z}/{x}/{y}.png | © OpenStreetMap | a,b,c |
| ArcGIS:NatGeo | https://services.arcgisonline.com/ArcGIS/rest/services/NatGeo_World_Map/MapServer/tile/{z}/{y}/{x} | Sources: National Geographic, Esri, DeLorme, HERE, UNEP-WCMC, USGS, NASA, ESA, METI, NRCAN, GEBCO, NOAA, iPC | |
| maps-for-free | https://maps-for-free.com/layer/relief/z{z}/row{y}/{z}_{x}-{y}.jpg | © OpenStreetMap contributors | |
| Esri:Topo | https://services.arcgisonline.com/ArcGIS/rest/services/World_Topo_Map/MapServer/tile/{z}/{y}/{x}.jpg | Sources: Esri, HERE, Garmin, Intermap, increment P Corp., GEBCO, USGS, FAO, NPS, NRCAN, GeoBase, IGN, Kadaster NL, Ordnance Survey, Esri Japan, METI, Esri China (Hong Kong), (c) OpenStreetMap contributors, and the GIS User Community | |
| OpenTopo | https://{s}.tile.opentopomap.org/{z}/{x}/{y}.png | map data: © OpenStreetMap contributors, SRTM | map style: © OpenTopoMap (CC-BY-SA) | a,b,c |
| CartoDB Positron – light theme | https://{s}.basemaps.cartocdn.com/rastertiles/light_all/{z}/{x}/{y}.png | © OpenStreetMap © CartoDB | a,b,c,d |
| CartoDB Positron – dark theme | https://{s}.basemaps.cartocdn.com/rastertiles/dark_all/{z}/{x}/{y}.png | © OpenStreetMap © CartoDB | a,b,c,d |