
Index
- Overview
- Licensing
- Connect Statseeker to Meraki
- Meraki Configuration
- General Settings
- Organizations
- Networks
- Monitoring Meraki Environments
- Meraki Grouping and Autogrouping
- Meraki Threshold and Alert Configuration
- Meraki Data Types
Overview
Statseeker’s Meraki Observability allows you to integrate Statseeker with your Meraki environment. The benefits of this integration include:
- Long term data history and granular detail
- Data retention is in your control
- High resolution data and no graph smoothing or data rollups
- More accurate capacity planning
- More accurate trend analytics and anomaly detection based on a longer baseline data capture
- Track events and threshold / alert on key metrics
- Improved workflows and simplified user Interface
- Flexible filters to target what is important
- Fast and efficiently data retrieval for improved network troubleshooting situation awareness
- Single pane of glass for all Meraki technologies
- Zero-touch new device additions
- Hybrid monitoring solution for all your devices
- Monitor all your network equipment from one place
- Support for multiple Meraki Technologies (MX, MR, MS)
- Supports MT and MV device status and inventory / licensing
- Identify users and equipment connected to your Meraki network
- Track compliance and improve your cybersecurity posture
Meraki Observability is available with all Statseeker v5.6.0 (or higher) servers.
Requirements
To complete your Statseeker – Meraki integration you will require:
- A Statseeker v5.6.0 (or higher) server
- An update to your Statseeker license to enable Meraki API polling
- A Meraki Dashboard API Key (read-only) for your Meraki environment, see the Meraki website for details (at the time of writing, directions for acquiring your read-only API key could be found at https://documentation.meraki.com/General_Administration/Other_Topics/Cisco_Meraki_Dashboard_API)
Meraki offers an Early API Access program for their dashboard API, enabling this option may break the Statseeker – Meraki integration.This Early API Access option may enable ‘in-development’ versions of API endpoints which could affect Statseeker’s integration with the Meraki Dashboard API. To confirm that this option is not enabled:
- Access your Meraki Administration account
- From the menu select Organization > Configure > Early Access
- Locate the Dashboard: Early API Access option and confirm that it is not enabled
Licensing
A new license key is required to enable Statseeker to collect and monitor your Meraki environment. Please contact your local Statseeker Sales and Account Manager for assistance.
Once your license has been updated to enable Meraki API polling:
- Select Administration > General > License Key
- Click Edit (top-left)
- Click Download a new Key, your license will be updated, enabling Meraki polling
- Check the box in License Confirmation to accept the updated license and click Save
- Polling of all Meraki environments from that server ceases
- All historical Meraki data (polled data up to the time the license is disabled) is retained within Statseeker and can be utilized in dashboards and reports
Connect Statseeker to Meraki
- Select Administration > Network Discovery – Advanced Options > Meraki Config
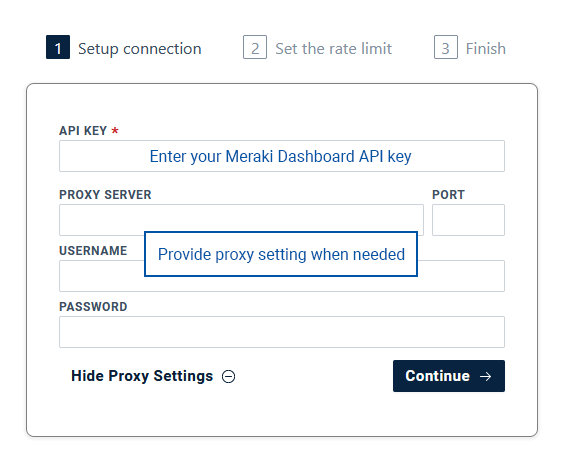
The first time you enter this configuration screen you will be prompted to configure the connection between your Statseeker server and Meraki environment.
- Enter your Meraki Dashboard API key (read-only), optionally provide proxy connection details, and click Continue
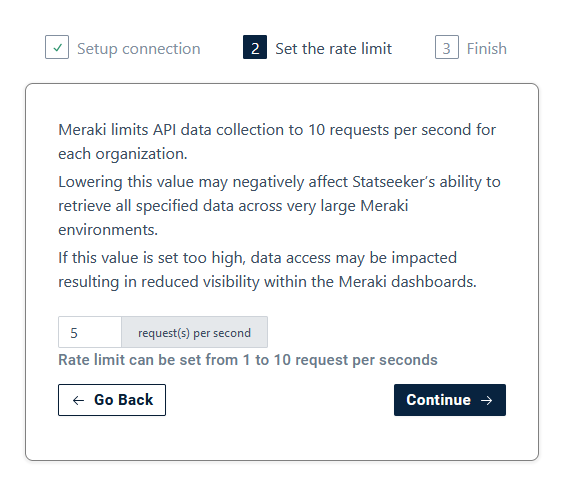
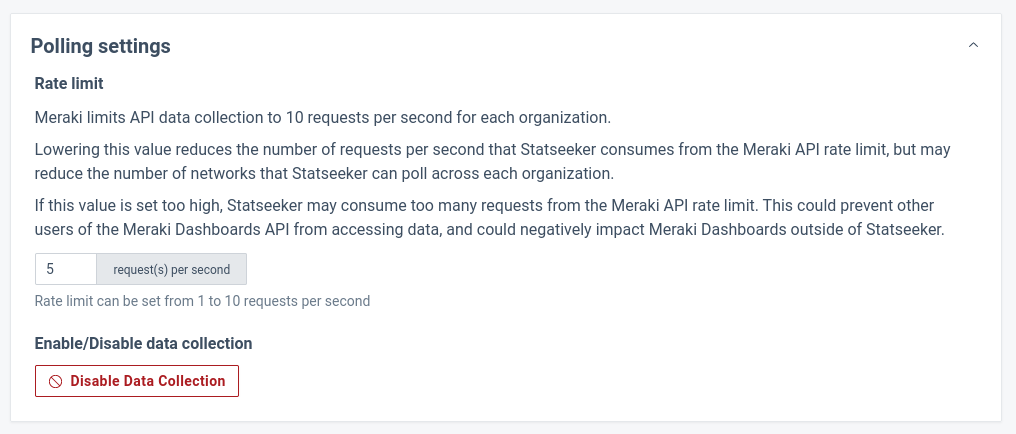
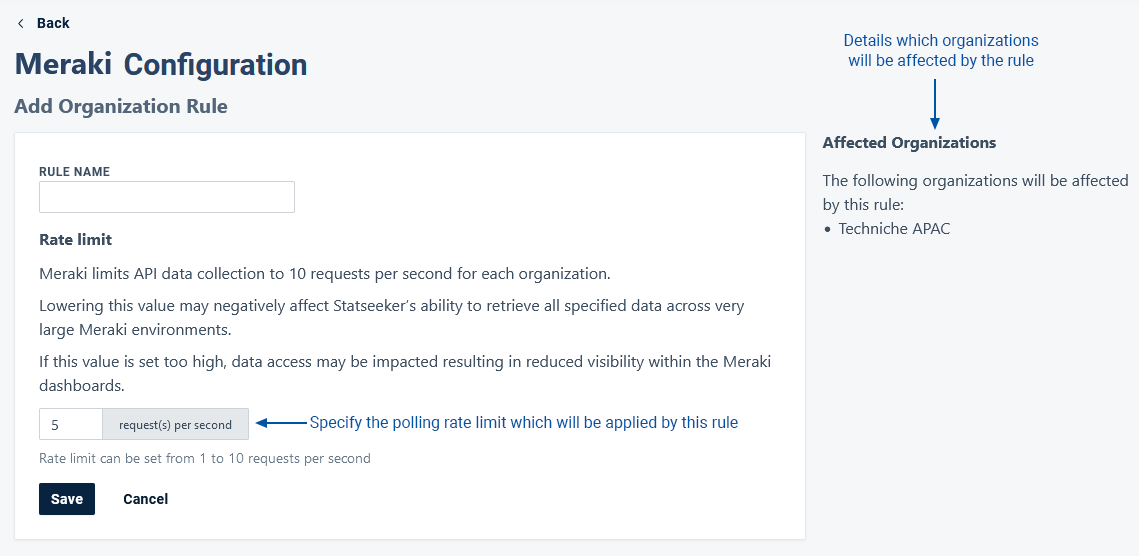
Meraki enforces a request limit of 10 per second, per organization.
- Lowering this value may negatively affect Statseeker’s ability to retrieve all specified data across very large Meraki environments
- A high request rate can result in reduced visibility within Meraki’s dashboards for large organizations with lots of users using Meraki’s dashboard solution
For reference, with a 10 requests per second limit, Statseeker can monitor approximately 1000 Meraki devices and 100 000 Meraki interfaces per Meraki Organization.
- Set the request rate limit and click Continue
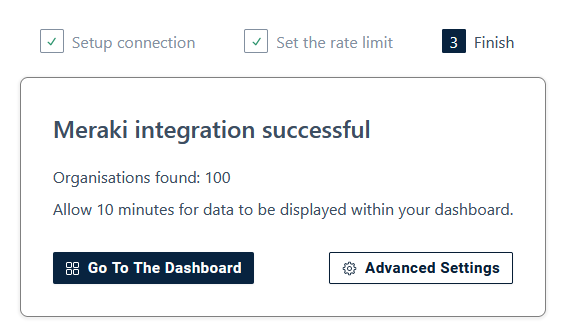
Communication between Statseeker and your Meraki environment will be established, and two options presented:
- Go to Dashboard – view your Meraki data in the Meraki Global Overview dashboard, it may take up to 10 minutes for data from newly connected environments to appear in dashboards
- Advanced Settings – update and test connection settings, configure and assign default and custom polling and request rate limit rules for your Meraki networks, configure data retention periods
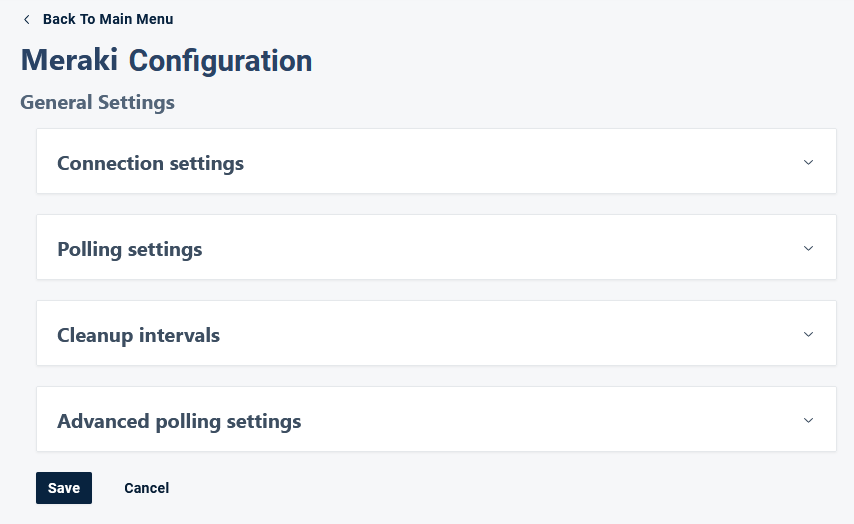
Meraki Configuration
Once the connection between Statseeker and your Meraki environment has been established, this connection and the monitoring of the Meraki environment can be managed from Administration.
- Select Administration > Network Discovery – Advanced Options > Meraki Config
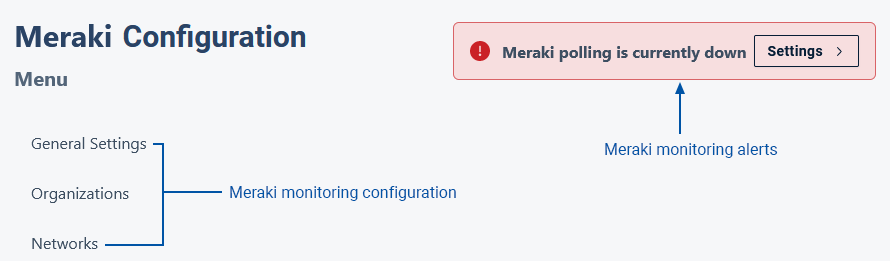
- General Settings – manage and test the connection to your Meraki environment, apply polling rate limits, specify data cleanup intervals and the default configurations for your Meraki Organizations and Networks
- Organizations – review and apply overrides to your Meraki Organization configurations
- Networks – review and apply overrides to your Meraki Network configurations
- Alerts relevant to Statseeker’s ability to monitor your Meraki environment are displayed in the top-right of the window
General Settings
The General Settings section provides options to:
- Connection Settings – manage and test the connection to your Meraki environment
- Polling Settings – apply polling rate limits
- Cleanup Intervals – specify data cleanup intervals
- Advanced polling settings – specify the default data endpoints (what data is collected) and polling interval applied to your Organizations and Networks
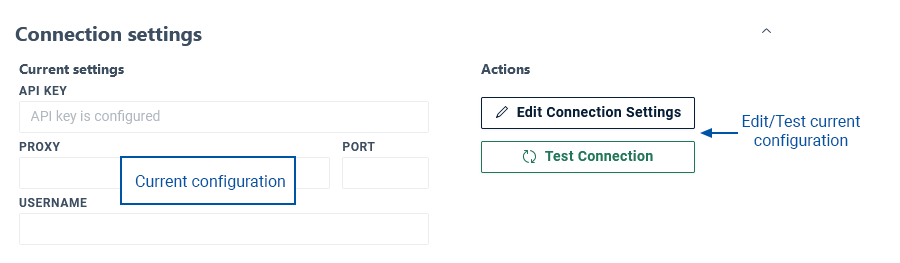
Connection Settings
Review, edit, and test the current connection settings.
Polling Settings
Adjust polling rate limits or disable/enable data collection.
Cleanup Intervals
Adjust polling rate limits or disable/enable data collection.
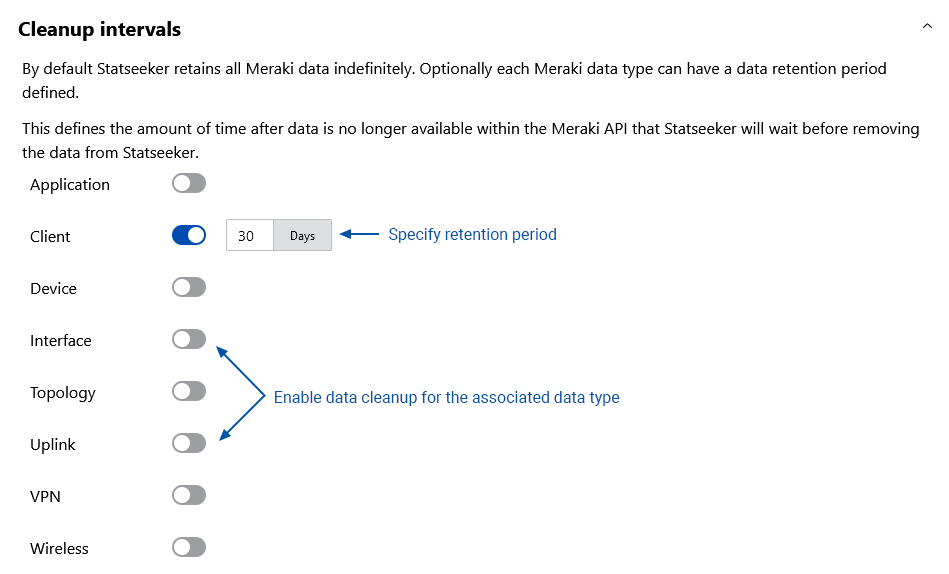
Cleanup intervals should be adjusted to suit your specific environment and data requirements. Suggested cleanup intervals are:
| Data Type | Cleanup Interval |
| Application | 30 days |
| Client | 30 days |
| Device | 30 days |
| Interface | 30 days |
| Topology | 7 days |
| Uplink | 30 days |
| VPN | 30 days |
| Wireless | 30 days |
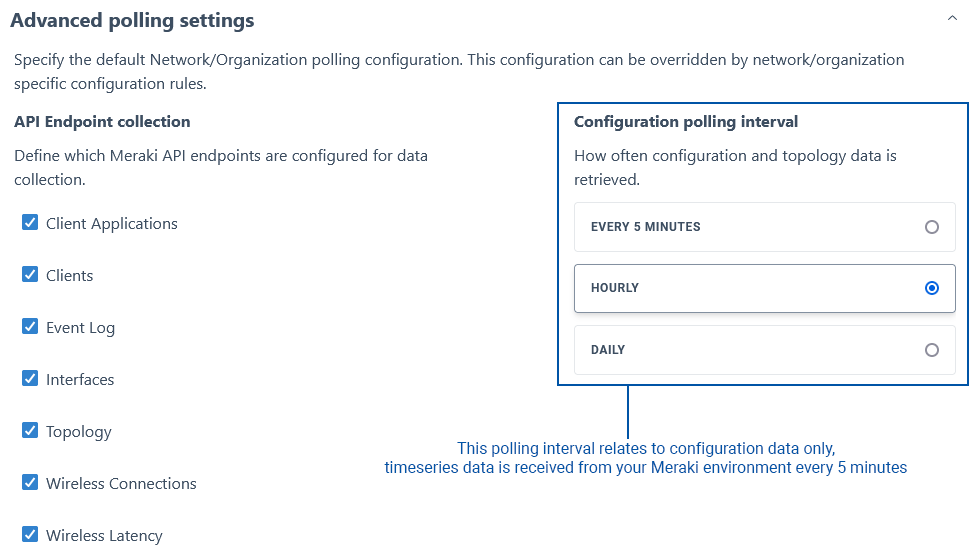
Advanced Settings
Specify the default data collected (API endpoints) for all Networks, and the default polling rate for all Organizations. These default values can be overridden on an Organization/Network basis through rules defined and applied in the Organizations and Networks sections.
Editing General Settings
To edit any of the General Settings:
- Click to expand the section containing the setting/s to be edited
- Update settings as needed and click Save
Organizations
The Organizations page lists all Organizations available from the monitored Meraki environment and details the Organization configuration, polling state, and any polling rate override rules which have been applied to the organization. The view also provides options to apply and manage polling rate override rules.
- Administration > Network Discovery – Advanced Options > Meraki Config > General Settings > Advanced Polling Settings
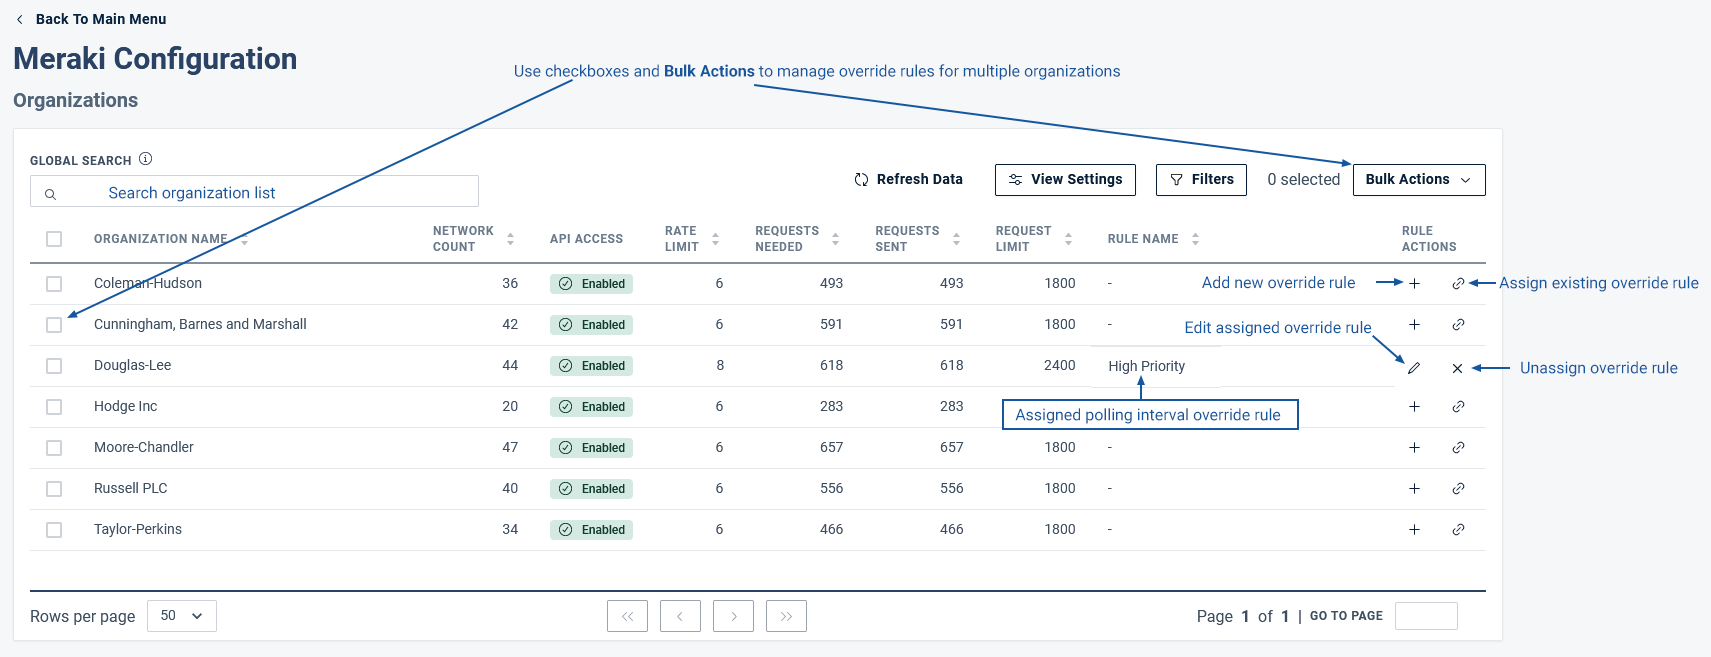
- Global Search – filter the organization list by name
- Refresh Data – update the data displayed in the page (default configuration data polling intervals are set in General Settings > Advanced Polling Settings )
- View Settings – select row padding (Compact/Normal) used in display
- Filters – filter the organization list by polling state (as determined by Meraki API ACCESS)
- Bulk Actions – use checkboxes with Bulk Actions to manage (create, assign, unassign) polling rate override rules for multiple organizations
Organization Configuration Columns
- Organization Name – name of the organization
- Network Count – the number of networks currently associated with the organization
- API Access – is API access enabled for the organization
- Rate Limit – polling rate limit applied to the organization
- Requests Needed – number of API requests needed (per polling cycle) to collect all data from all networks assigned to the organization
- Requests Sent – number of API requests sent in the last completed polling cycle
- Request Limit – maximum number of API requests per polling cycle that can be sent to poll the organization (determined by polling rate limit)
- Rule Name – the name of the polling rate limit override rule applied to that organization
- Rule Actions – polling rate override rule actions (add, edit, assign, unassign)
Use the Create\Edit Rule action to configure a polling rate override rule, and the assign/unassign actions to apply/remove the rule for select organizations.
Networks
The Networks page lists all Networks available from the monitored Meraki environment and details the network configuration, device and interface counts, polling details, and any polling override rules which have been applied to the organization. The view also provides options to apply and manage polling override rules.
- Administration > Network Discovery – Advanced Options > Meraki Config > General Settings > Advanced Polling Settings
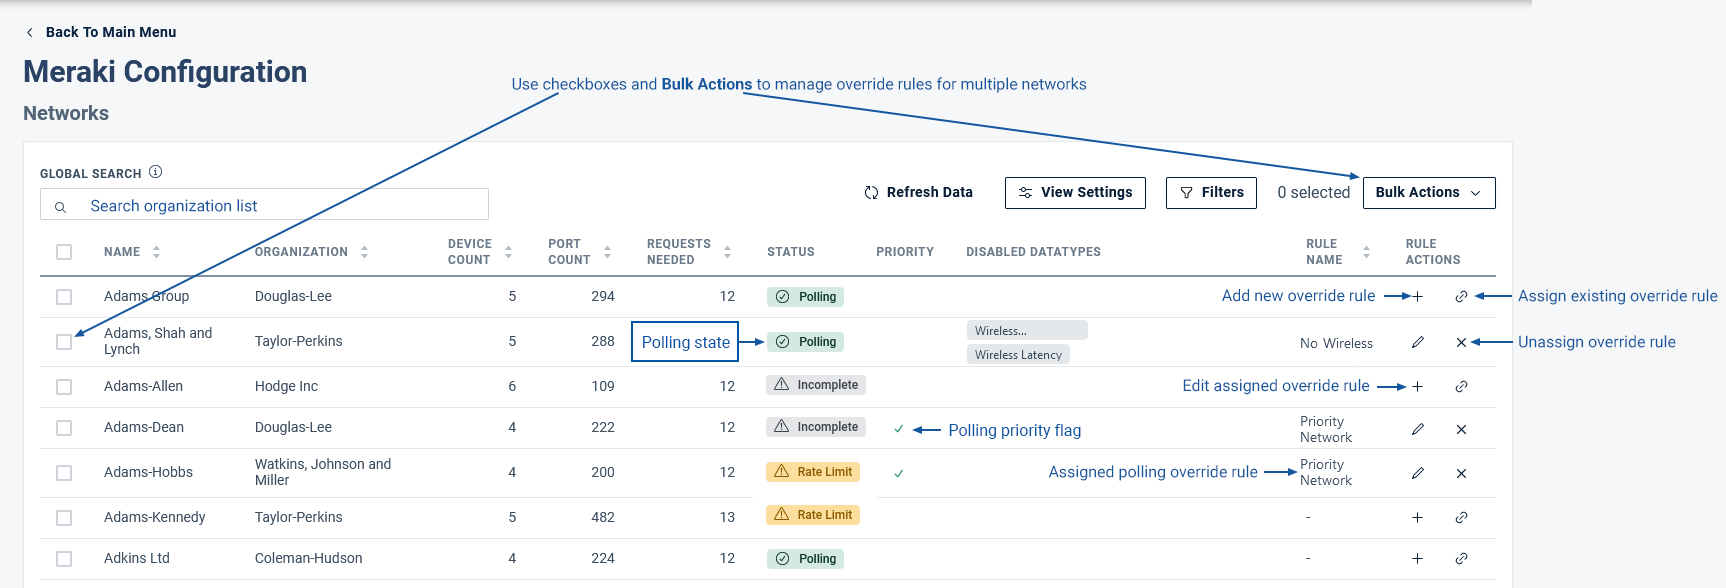
- Global Search – filter the networks list by name or organization
- Refresh Data – update the data displayed in the page (default configuration data polling intervals are set in General Settings > Advanced Polling Settings )
- View Settings – select row padding (Compact/Normal) used in display
- Filters – filter the network list by polling state, disabled data types and polling priority
- Bulk Actions – use checkboxes with Bulk Actions to manage (create, assign, unassign) polling rate override rules for multiple networks
Network Configuration Columns
- Name – name of the network
- Organization – name of the organization the network is assigned to
- Device Count – number of devices being monitored within the network
- Port Count – number of ports being monitored within the network
- Requests Needed – number of API requests needed (per polling cycle) to collect all data from the network
- Status – polling status of the network:
- Disabled – polling has been disabled for the network
- Polling – the previous polling cycle completed successfully
- Incomplete – the previous polling cycle could not be completed due a technical issue
- Rate Limit – the previous polling cycle could not be completed due hitting the polling rate limit assigned to the organization containing the network
- Priority – indicates if the network has been tagged as a priority network (priority networks are polled before non-priority networks in each polling cycle)
- Disabled Data Types – details any data-types not polled within the network in response to an assigned polling override rule
- Rule Name – the name of the polling override rule applied to that network
- Rule Actions – polling rate override rule actions (add, edit, assign, unassign)
- Assigning a polling override rule at the network level tagging the network as a Priority
- Assigning a polling override rule at the network level decreasing the scope of data collected from that network (API Endpoint collection)
- Assigning a polling override rule at the organization level increasing the polling rate
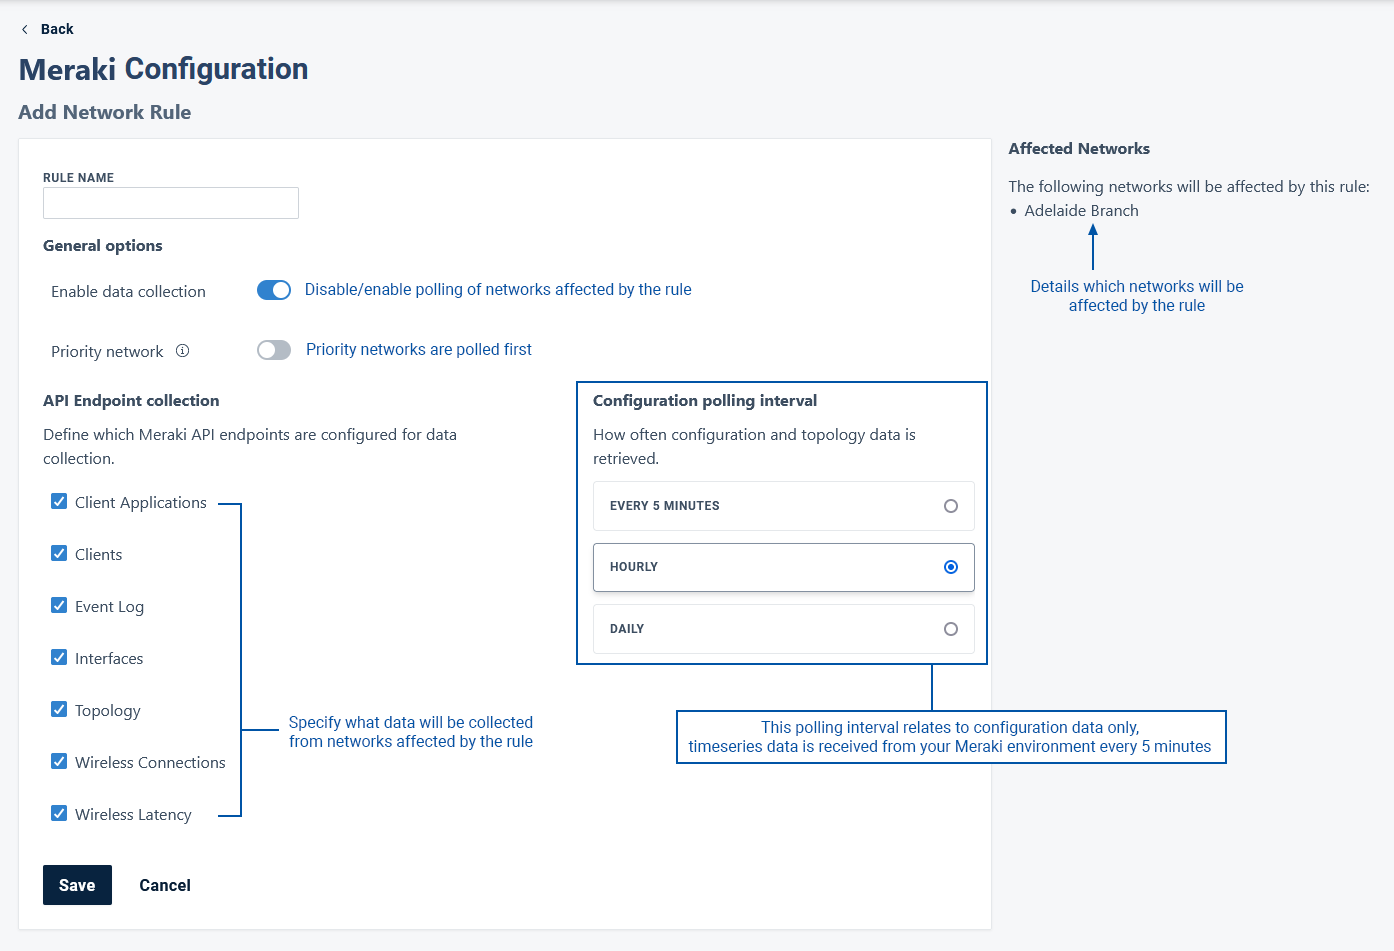
Network Polling Override Rules
Polling override rules can be applied at a network level to override the default polling configuration, use the Create\Edit Rule action to configure a polling override rule, and the assign/unassign actions to apply/remove the rule for select networks.
- Rule Name – name of the polling override rule (displayed in the Networks configuration page)
- General Options
- Enable data collection – enable\disable data collection for the network
- Priority network – tag the network as a priority network, priority networks are polled before non-priority networks in each polling cycle
- API Endpoint collection – select the data-types to be collected for the network
- Configuration polling interval – specify how often to update configuration data for the network
- Affected Networks – details the networks that will be affected by any changes made to the rule
Dashboards
Statseeker supplies 7 Meraki default dashboards:
- Meraki Global Overview
- Meraki Appliance Overview
- Meraki Client Overview
- Meraki Inventory Overview
- Meraki Switch Overview
- Meraki Wireless Overview
- Meraki Event Overview
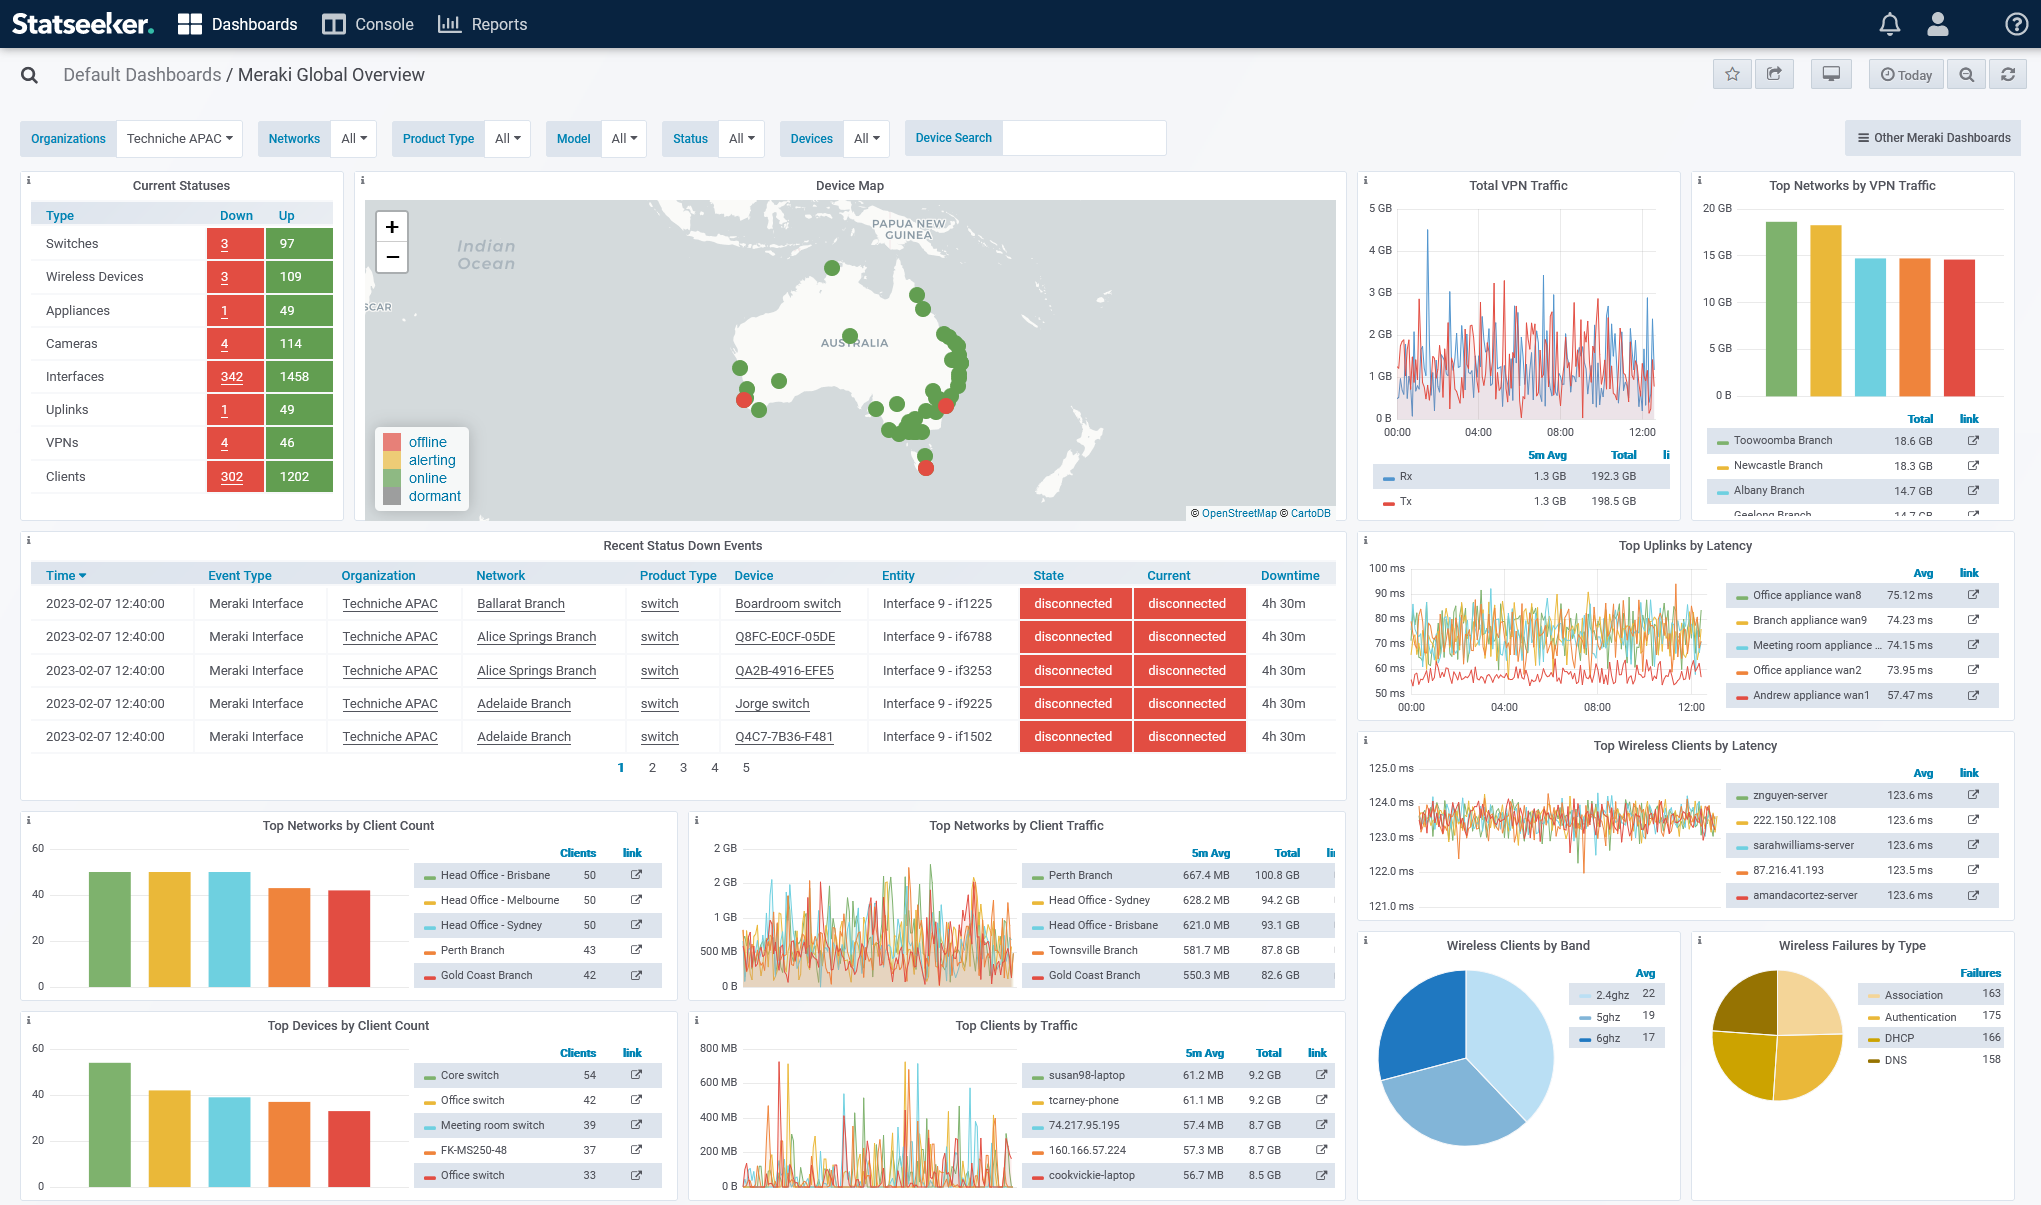
Meraki Global Overview
A high level summary of the current state of the network, data can be filtered by organization, network, product type, model, status and device. The Device Search can be used to filter the dashboard content by device name, IP address (LAN/public), serial number, MAC address, street address, notes, and/or tags.
- Number of down entities (devices, interfaces, clients, etc.)
- Location of down devices
- Busiest networks and clients
- Breakdowns of networks and devices by client counts
- Wireless clients (client to access point) and uplinks (uplink to internet) with the highest latency
- Breakdowns of wireless clients and connection failures
- Network event details
- Historical VPN traffic
- Documentation: Assigning a Map Provider
- Video: Assigning & Updating Map Provider Details
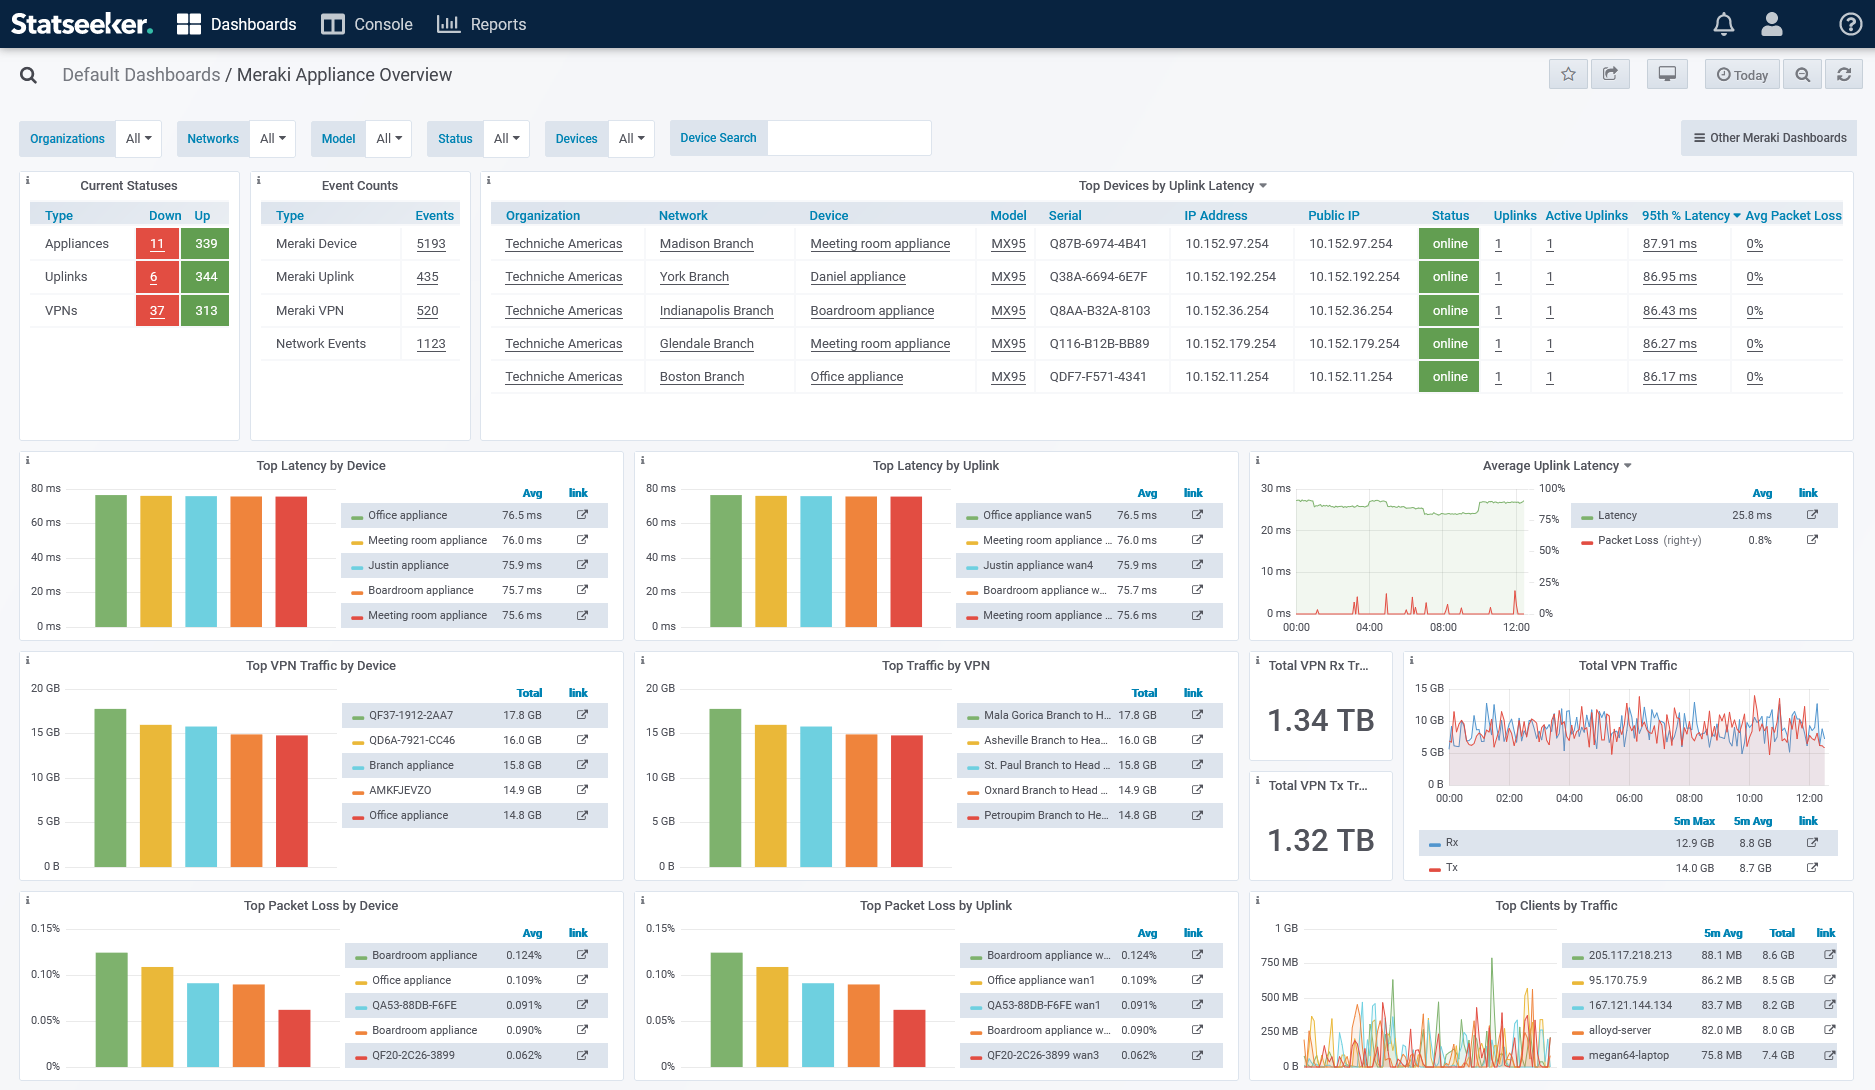
Meraki Appliance Overview
A detailed view of Meraki appliances (device, uplink, VPN), data can be filtered by organization, network, model, status, and device. The Device Search can be used to filter the dashboard content by device name, IP address (LAN/public), serial number, MAC address, street address, notes, and/or tags.
- Current appliance connection status
- Appliances presenting the highest latency
- Historical latency and packet loss, and breakdowns by device and uplink
- VPN traffic by device, traffic by VPN and historical VPN traffic
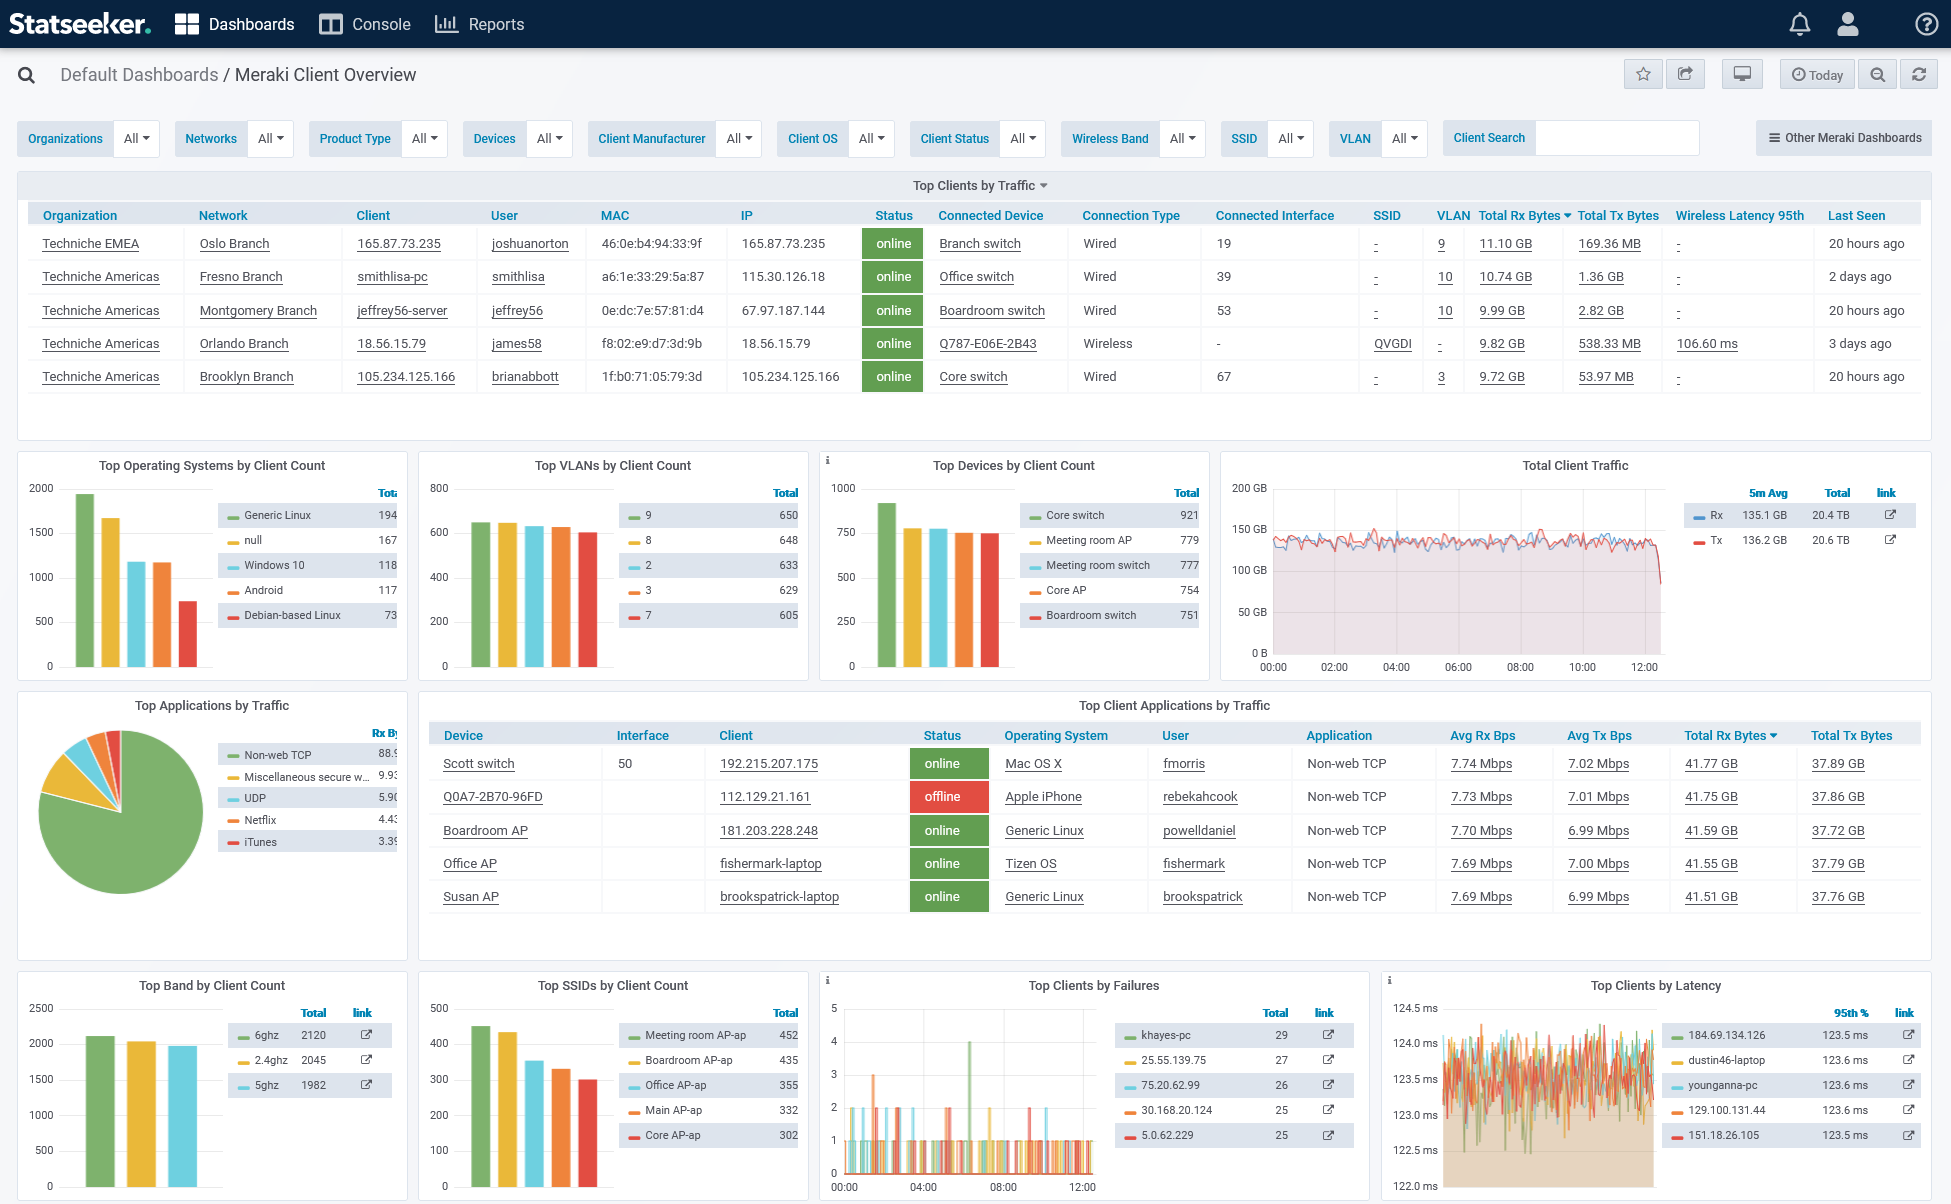
Meraki Client Overview
A detailed view of Meraki clients, data can be filtered by organization, network, product type, device, manufacturer, OS, connection status, connection status, wireless band, SSID, and VLAN, and the Client Search can be used to filter your client list by client, user, MAC, and IP.
- Top clients, applications, and client-applications by traffic
- Historical client traffic
- Breakdowns of devices, operating systems, VLANs and SSIDs by client count
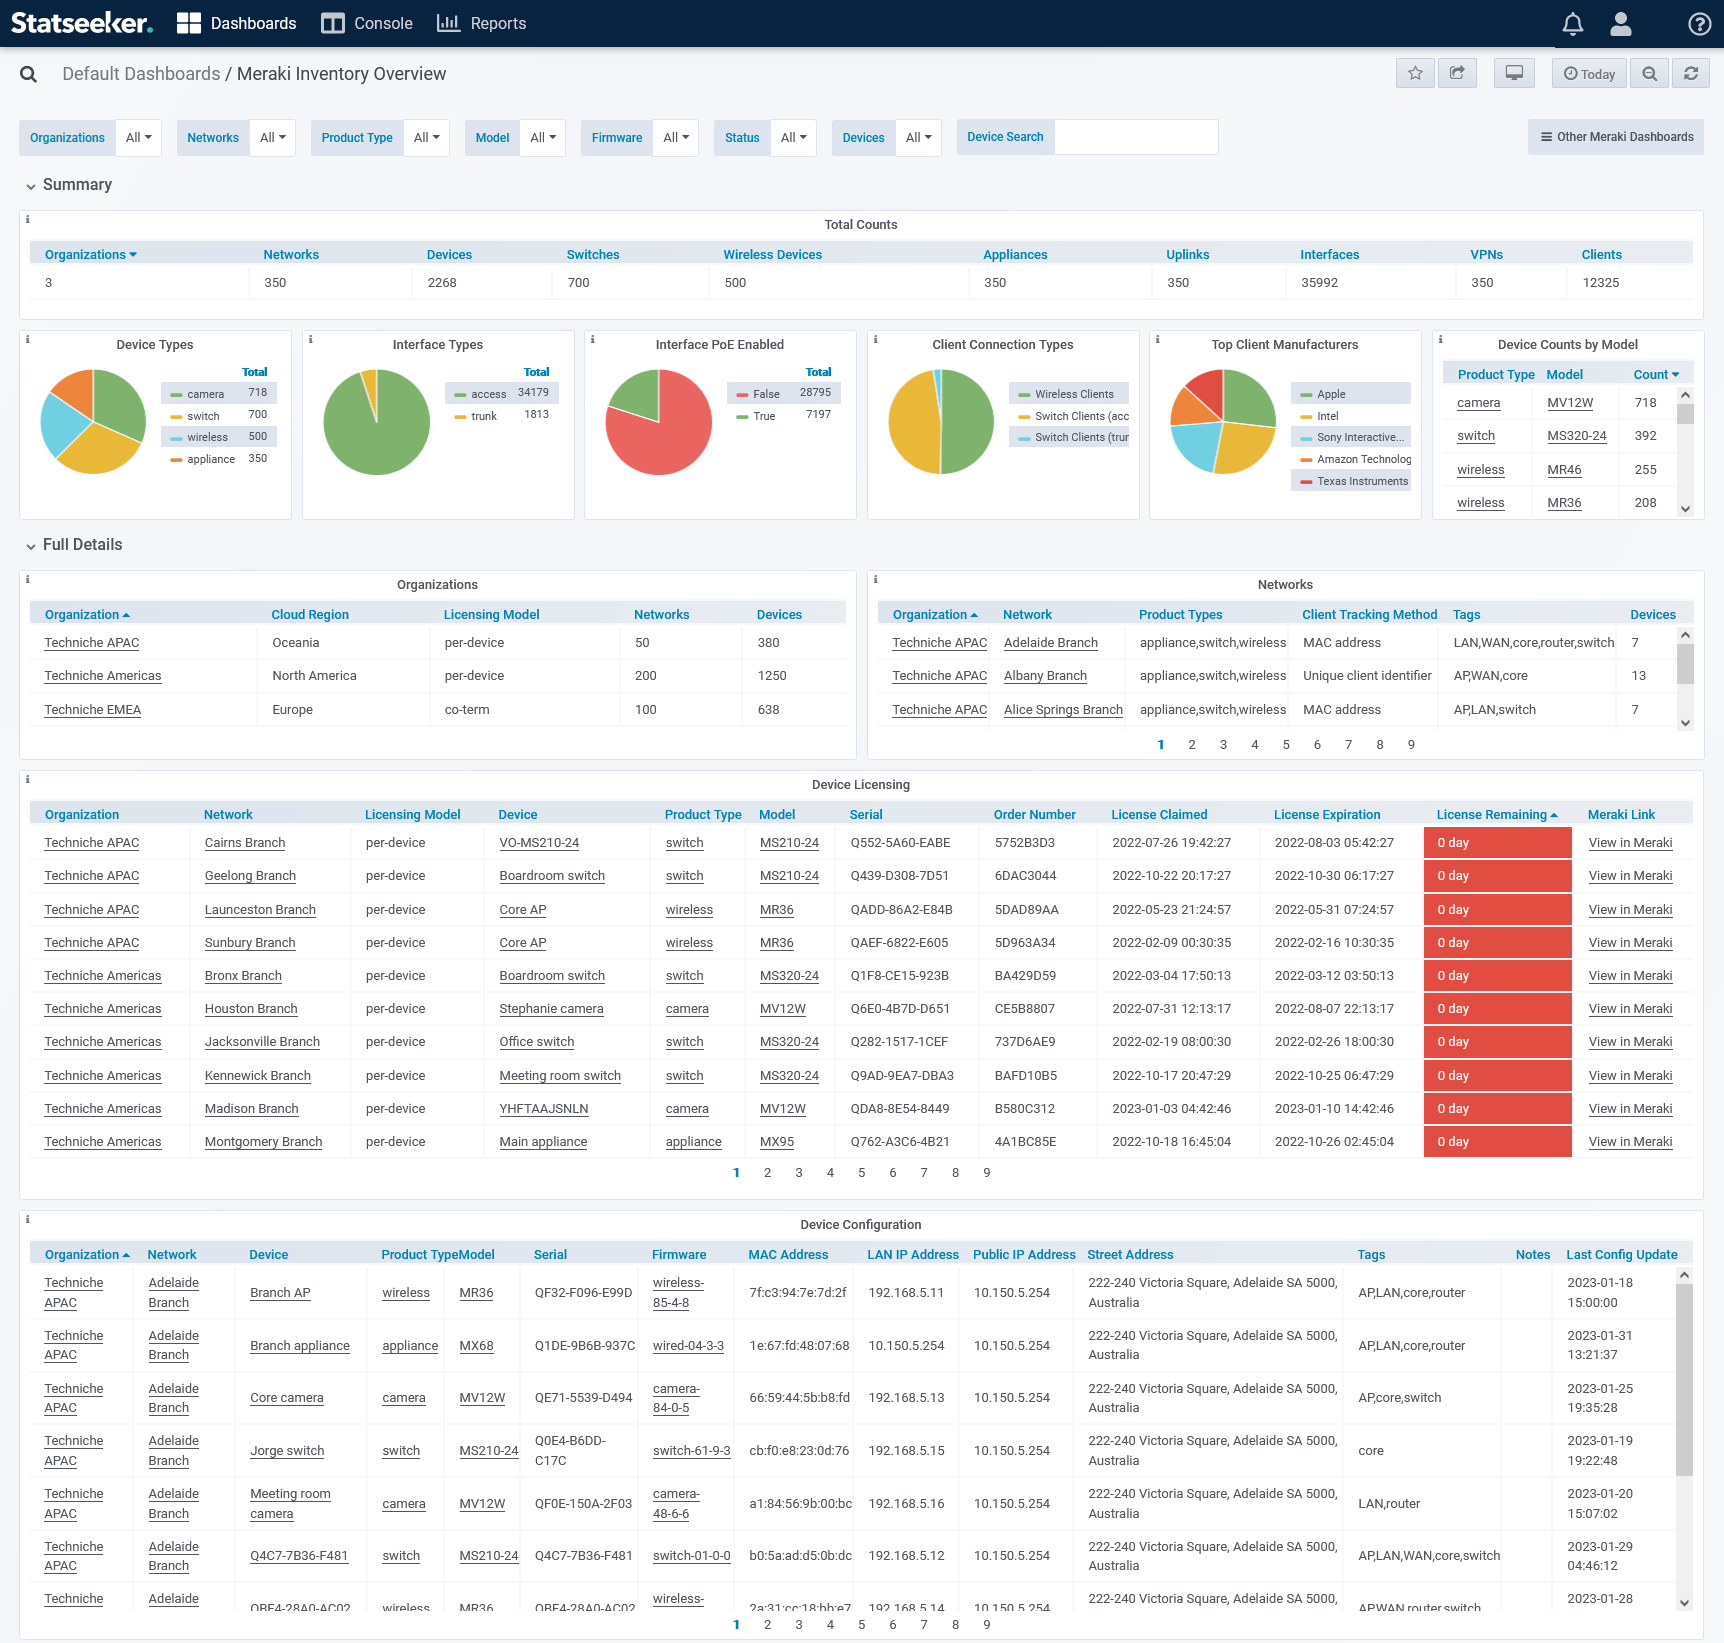
Meraki Inventory Overview
A summary of the Meraki environment inventory, data can be filtered by organization, network, product type, model, firmware, status, and device name. The Device Search can be used to filter the dashboard content by device name, IP address (LAN/public), serial number, MAC address, street address, notes, and/or tags.
- Inventory breakdowns by organization, device\interface\connection type, manufacturer, and model
- Organization and network configuration
- Details of all licensed and unlicensed devices
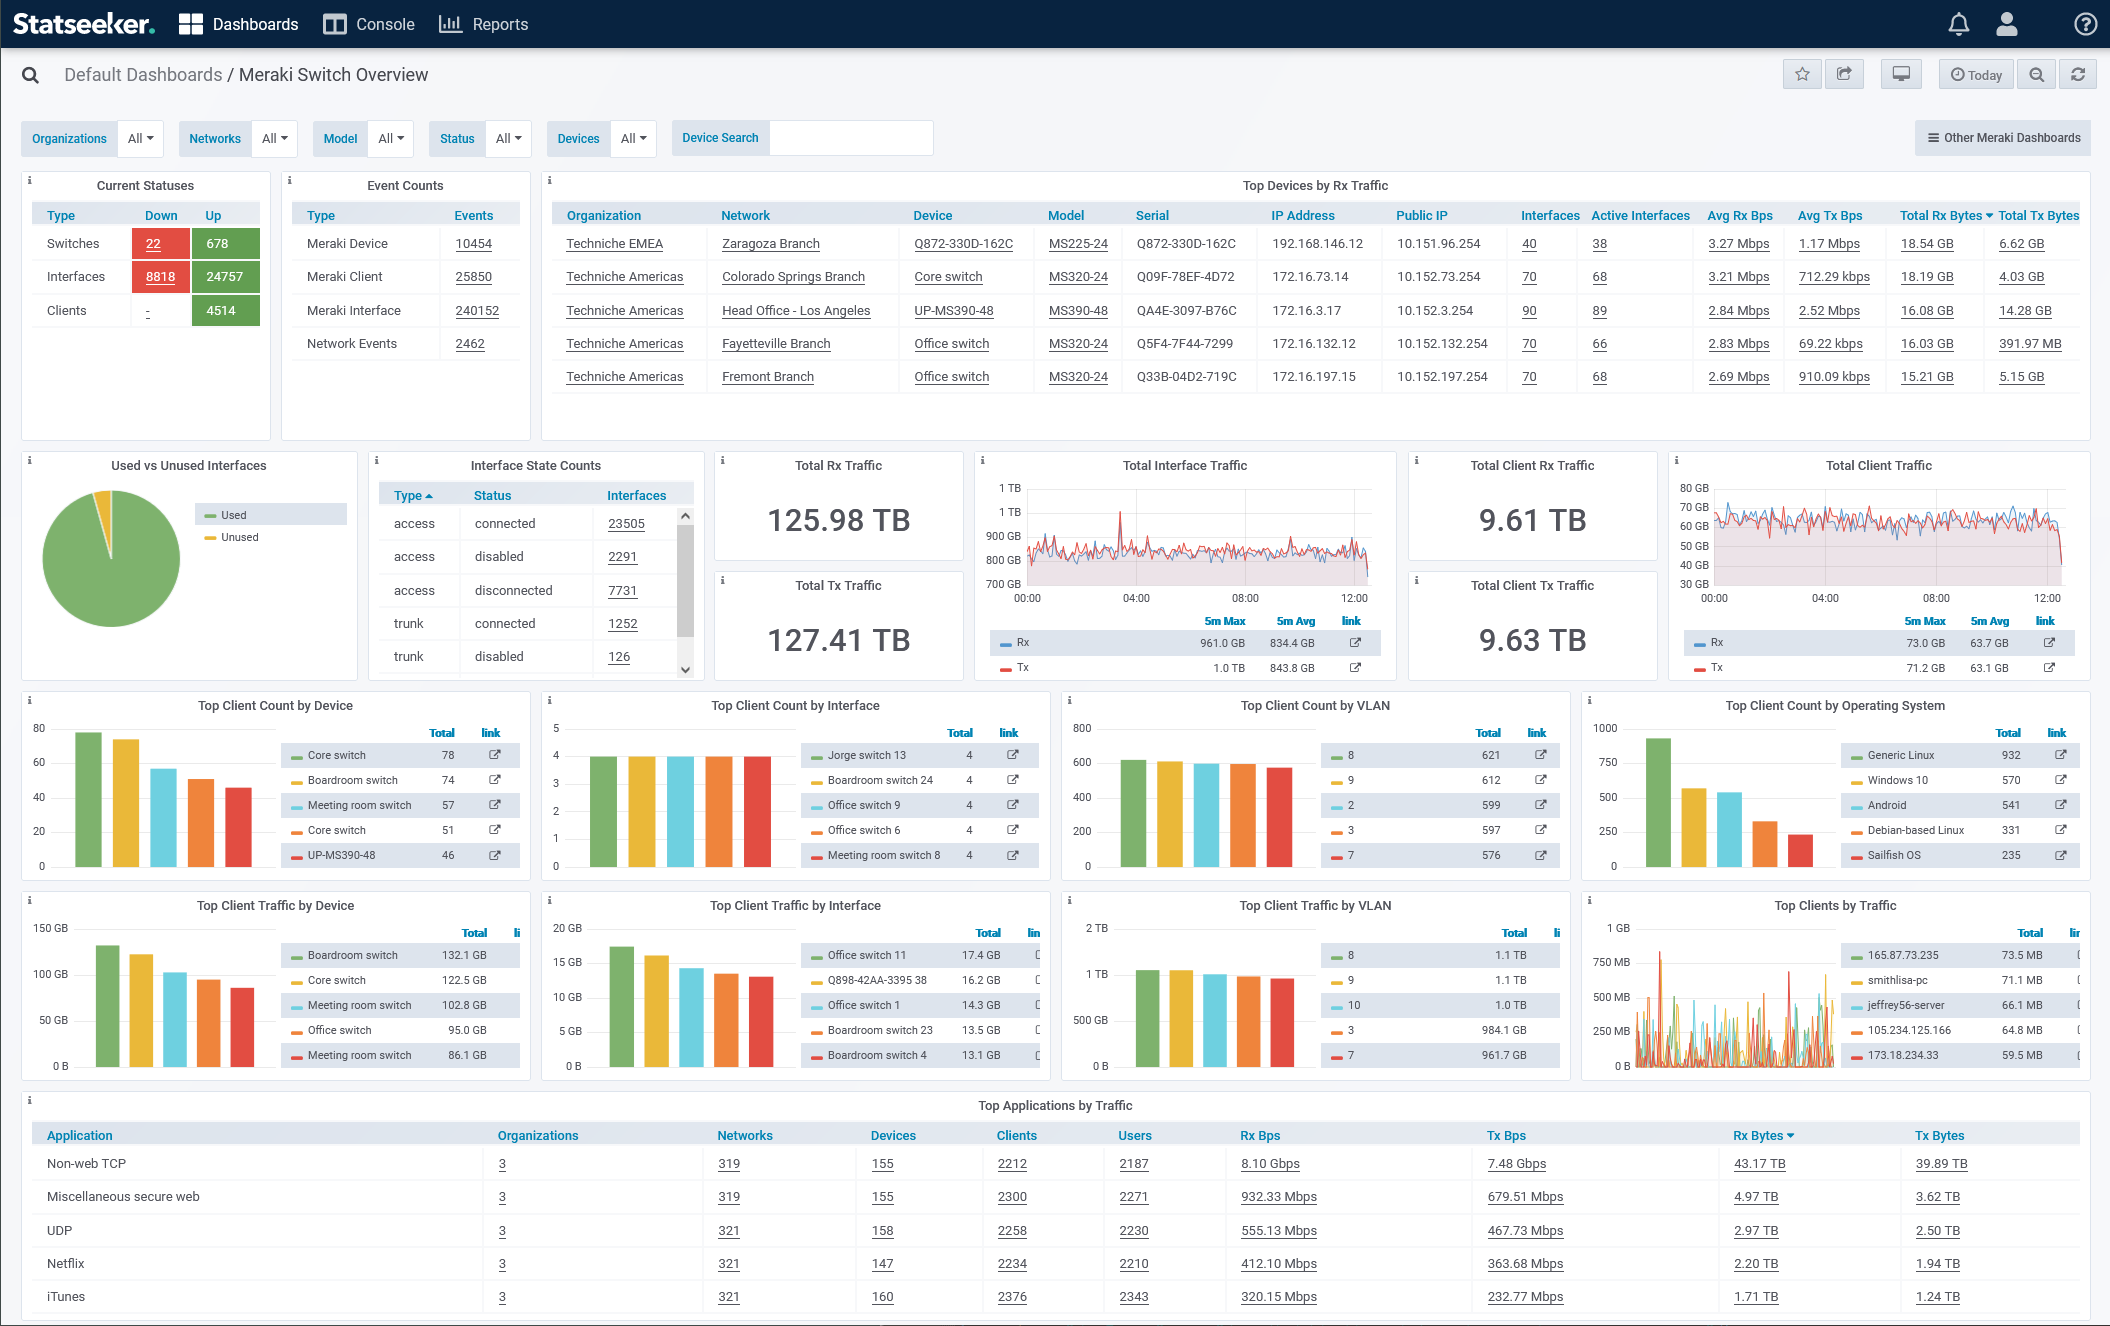
Meraki Switch Overview
A detailed view of Meraki switches, data can be filtered by organization, network, model, status, and device. The Device Search can be used to filter the dashboard content by device name, IP address (LAN/public), serial number, MAC address, street address, notes, and/or tags.
- Current connection status of switches and wired clients
- Switches presenting the highest inbound (download) traffic
- Breakdowns of wired clients by switch, interface and VLAN
- Traffic breakdowns by direction, switch, interface, and VLAN
- Used\unused interface counts
- Breakdowns of applications and wired client-applications by usage
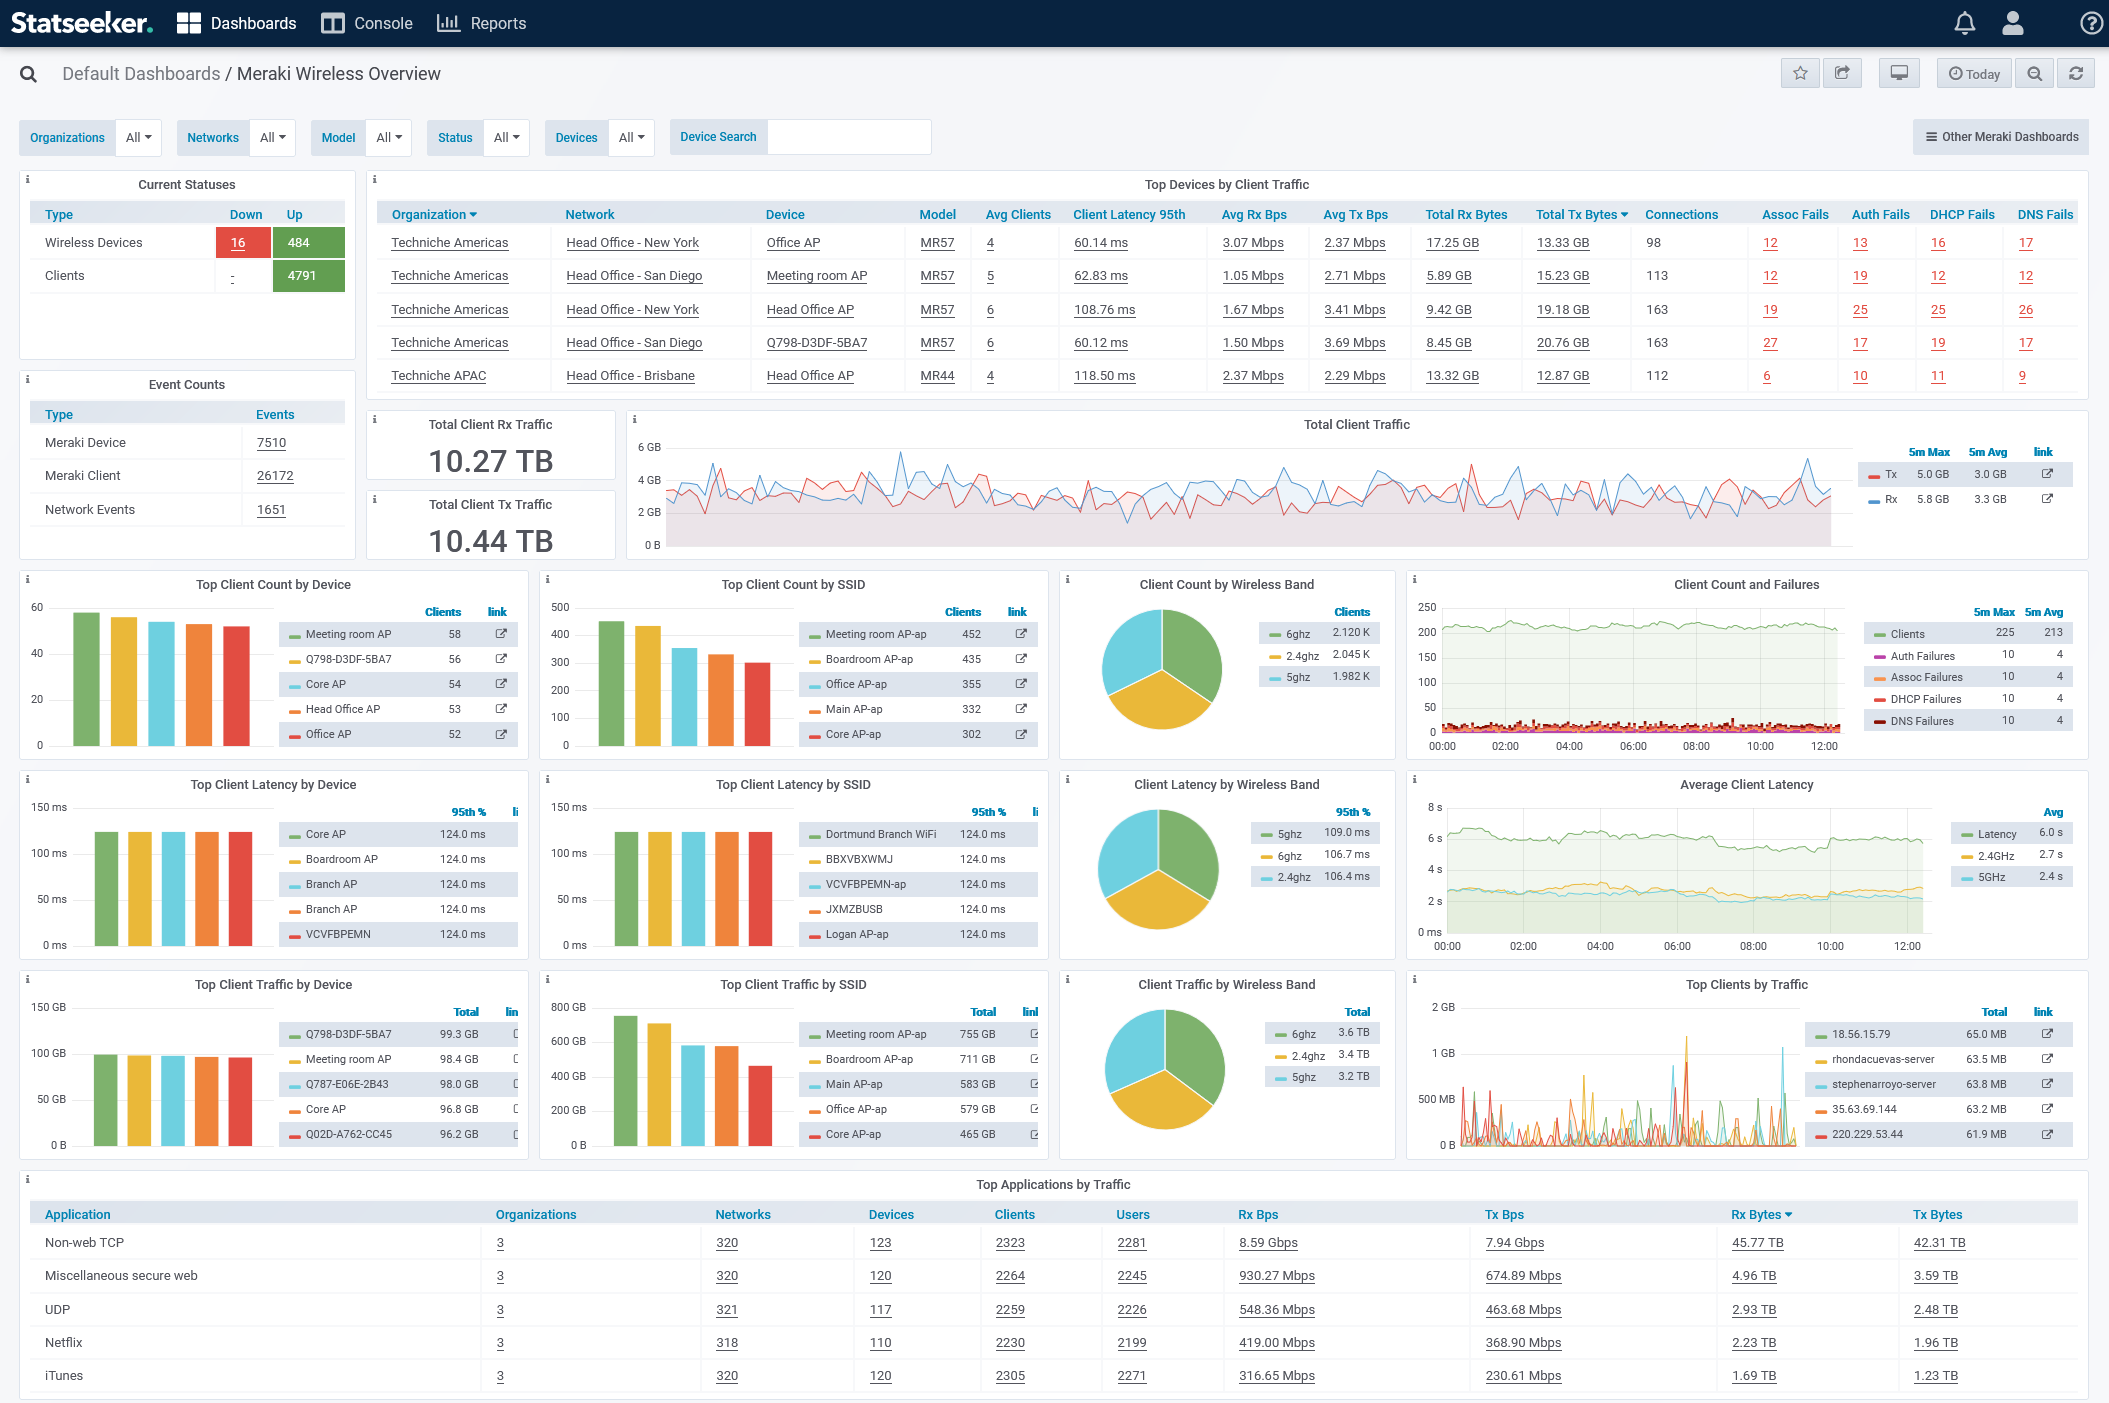
Meraki Wireless Overview
A detailed view of Meraki wireless devices and clients, data can be filtered by organization, network, model, status, and device. The Device Search can be used to filter the dashboard content by device name, IP address (LAN/public), serial number, MAC address, street address, notes, and/or tags.
- Current connection status of wireless devices and wireless clients
- Clients and applications presenting the highest inbound (download) traffic
- Breakdowns of wireless client counts, latency and traffic by device, SSID, and wireless band
- Historical view of wireless client connections, connection failures, latency by wireless band, and total wireless traffic
- Top wireless clients by failures, latency and traffic
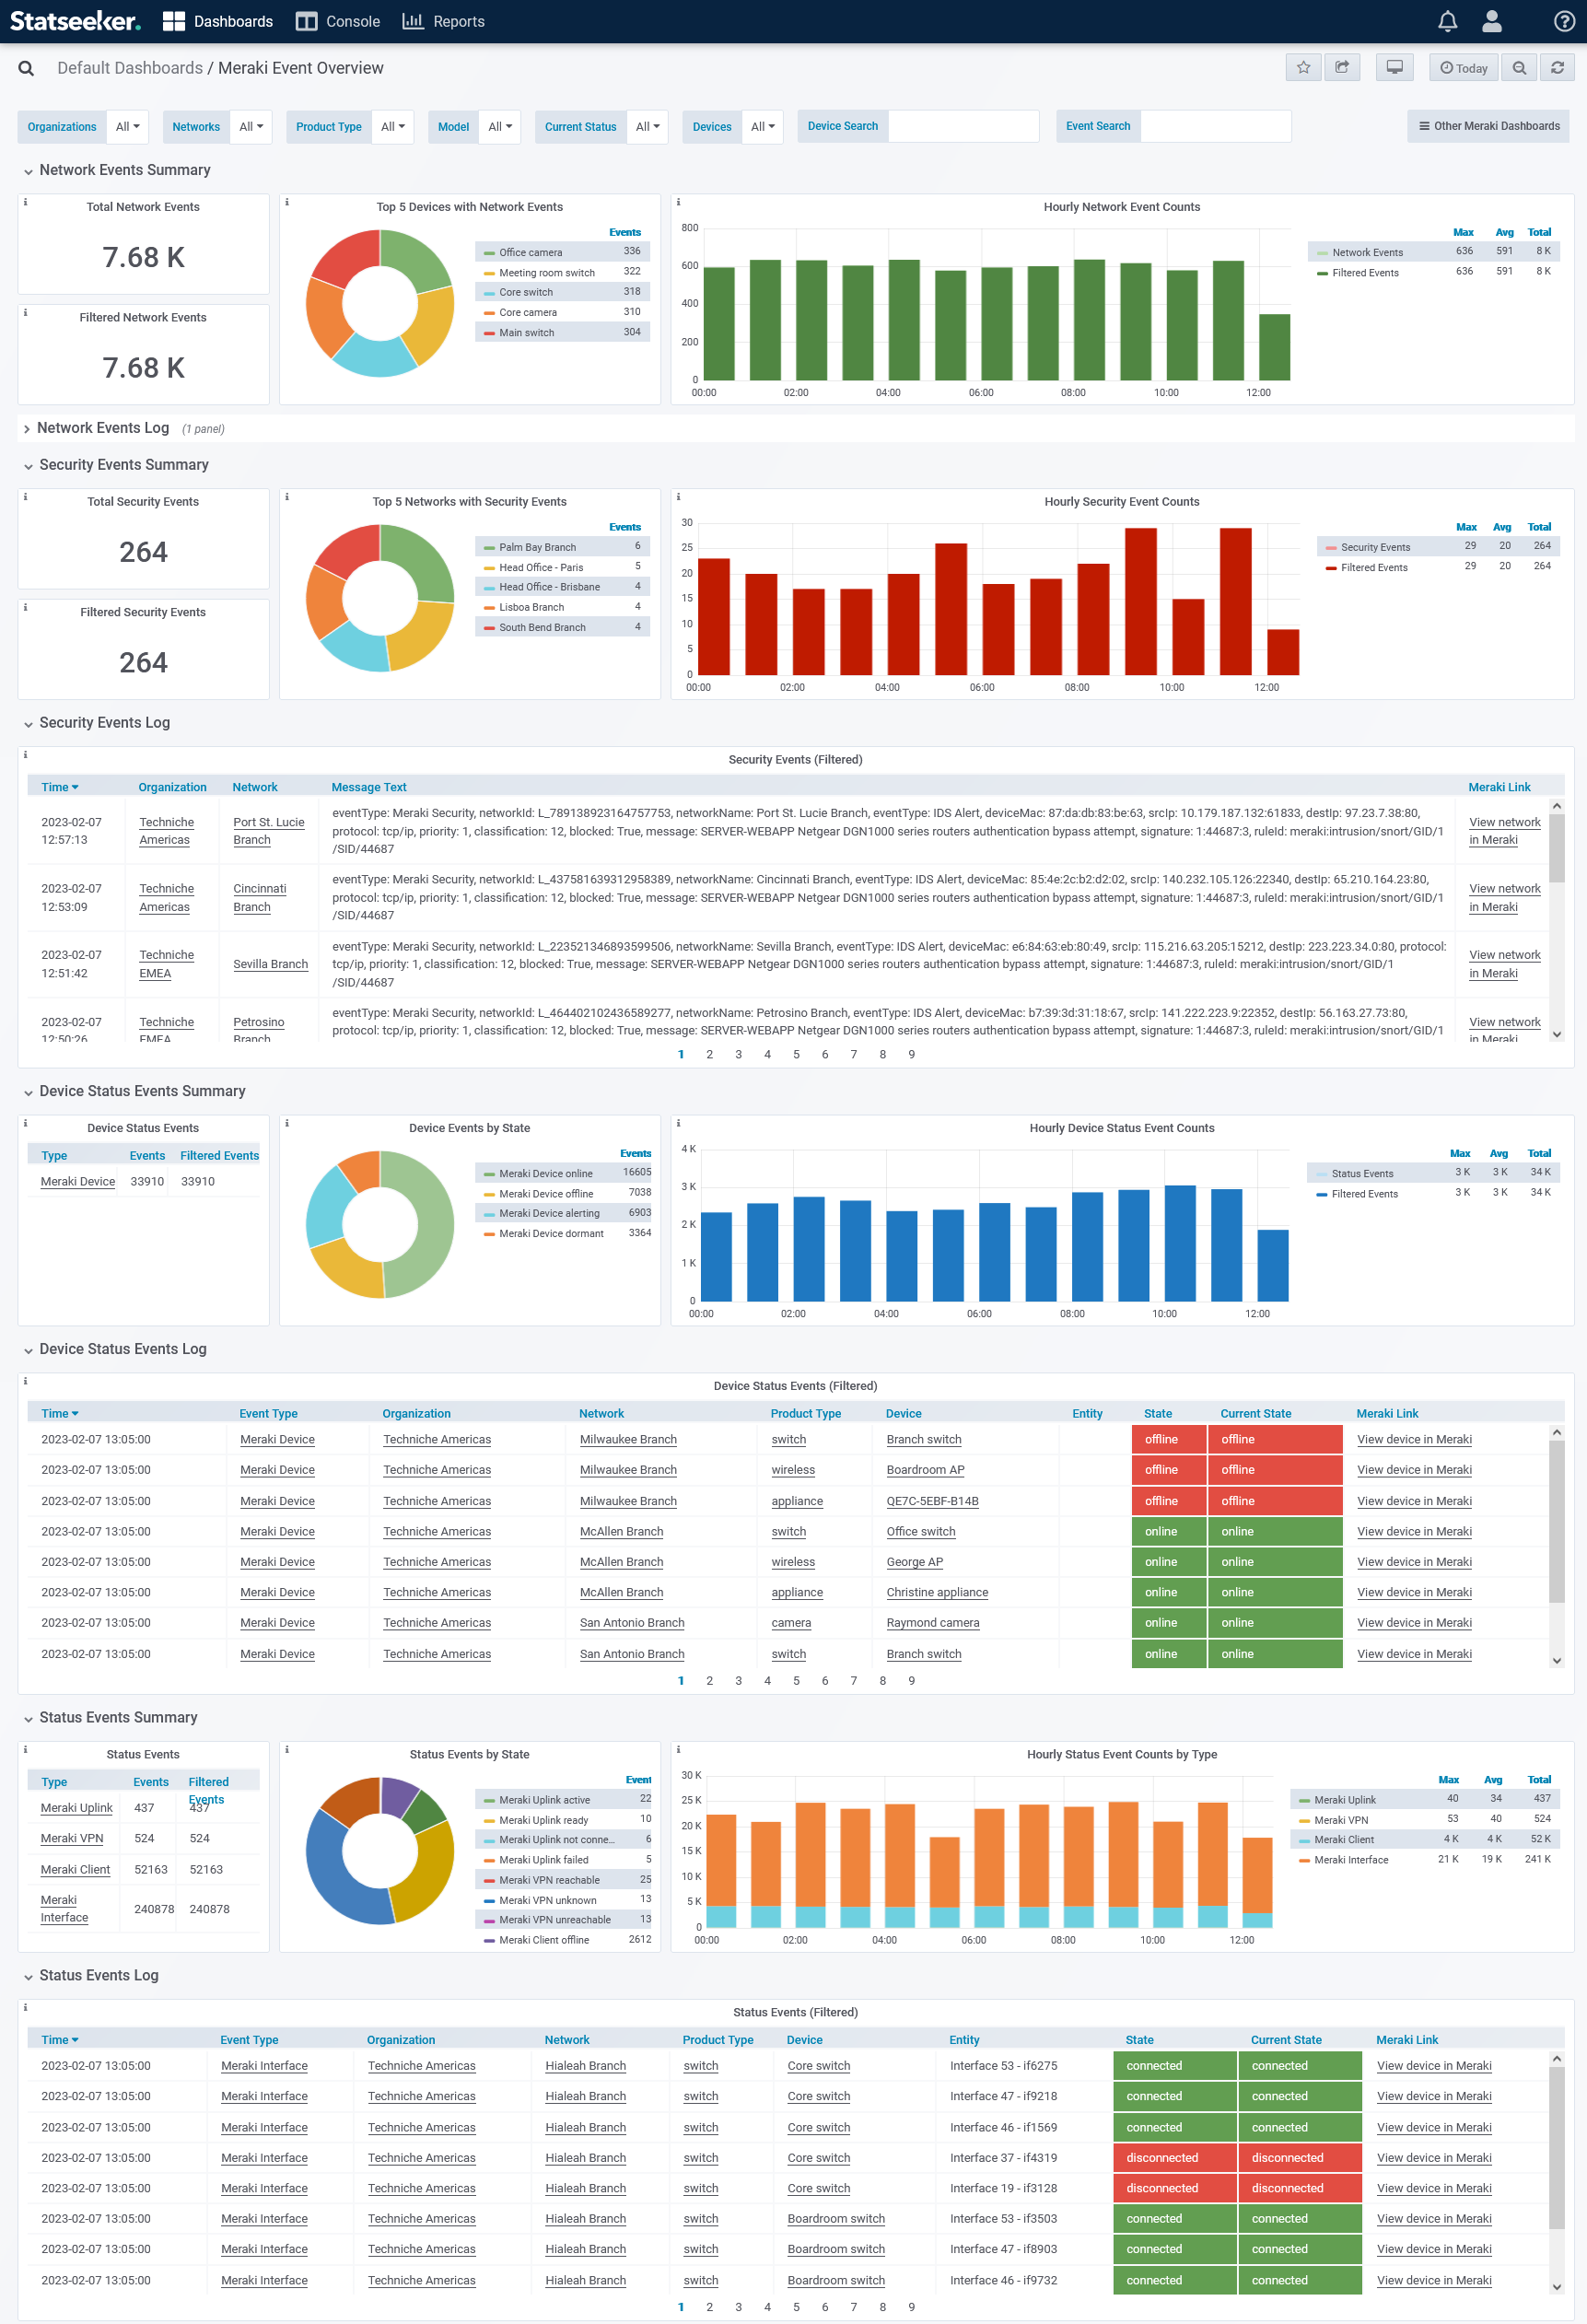
Meraki Event Overview
A detailed view of Meraki event records (network, device, security, accessibility), data can be filtered by organization, network, product type, model, status, and device.
Custom Meraki Dashboards
Additional Meraki dashboards can be created to suit your specific requirements. For details (documentation and videos) on building custom dashboards, see Statseeker Dashboards.
When configuring Meraki specific dashboard panels, there are a range of Meraki data types available, each returning a specific type of Meraki data. The data type is specified in the Object field in the Metrics tab, and should be one of the data types presented in the Meraki Data Types table.
Reports
Statseeker offers 2 default Meraki reports presenting Meraki network events and Meraki security events. Meraki events records are restricted to these reports, and any custom Meraki event reports you create.
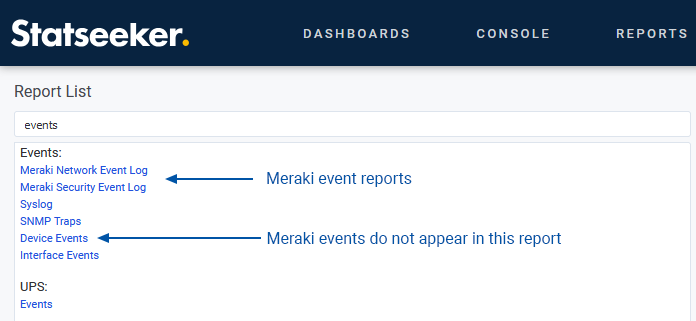
- If your Meraki devices are also configured to forward syslog messages to the Statseeker server, then these reports will display duplicate entries; one event from syslog and one event from the Statseeker – Meraki integration
- The availability of security events is dependent upon your Meraki License, if no security events are displayed it may be because no security events occurred within the specified reporting period, or because your Meraki license does not provide these alerts
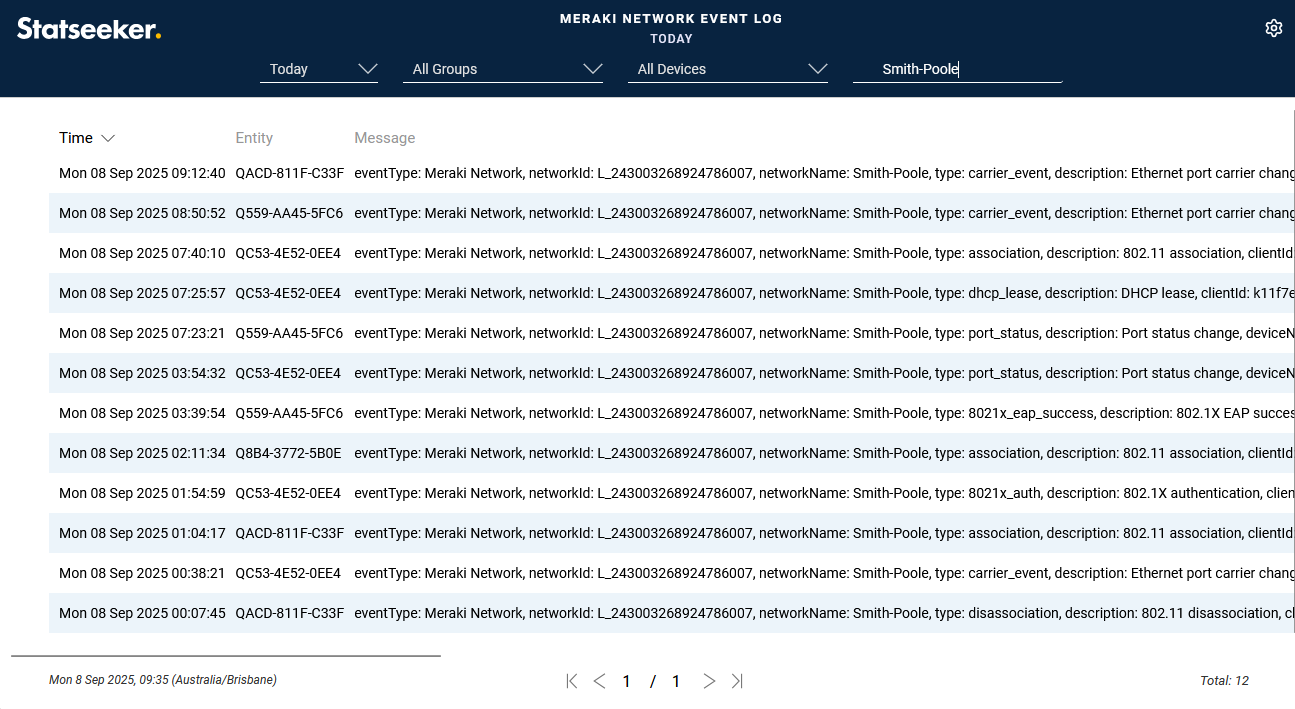
Meraki Events Report
Details Meraki event records
- Event timestamp
- Entity subject to the event
- Event message
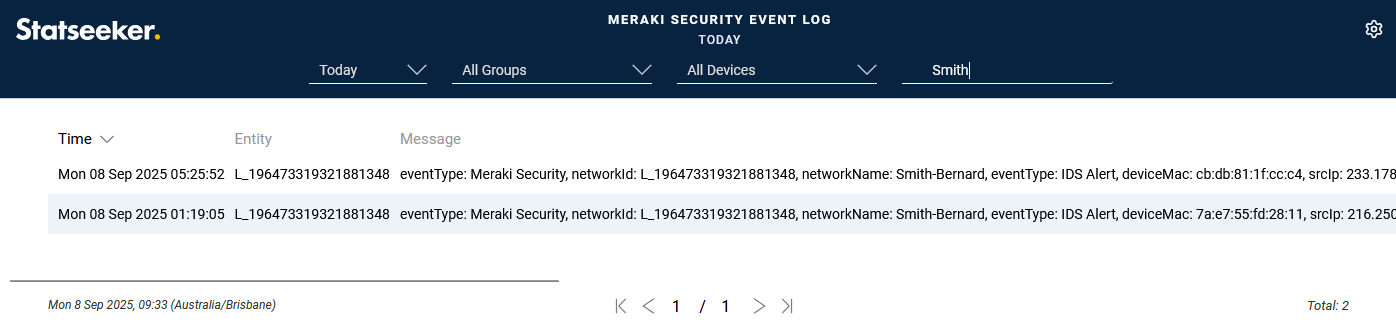
Meraki Security Events Report
Details Meraki security event records
- Event timestamp
- Entity subject to the event
- Event message
Custom Meraki Reports
Additional Meraki reports can be created to suit your specific requirements. For details (documentation and videos) on building custom dashboards, see:
When configuring Meraki specific reports, there are a range of Meraki data types available, each returning a specific type of Meraki data. The data type is specified in the Report Data Type field, and should be one of the data types presented in the Meraki Data Types table.
Meraki Grouping and Autogrouping
All infrastructure, including components of your Meraki environment, can be grouped for filtering report and dashboard content, as well as threshold and alert configurations.
While Manual Grouping can be used to create and update groups on-demand. Typically, you will use Automated Grouping when managing large and/or dynamic environments.
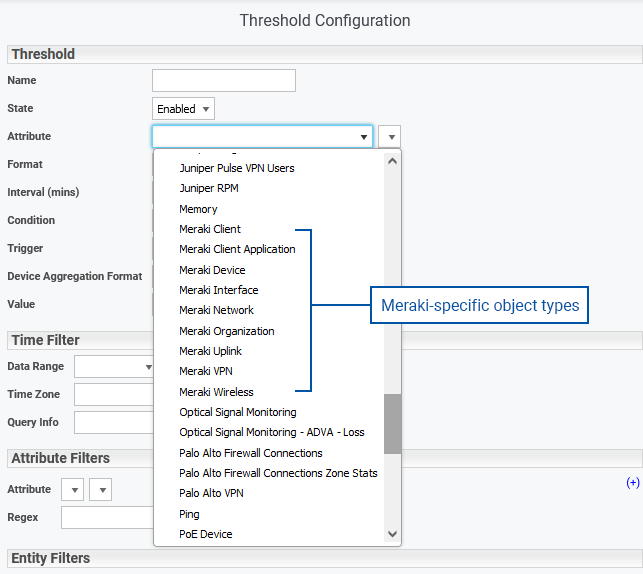
Statseeker provides a number of Meraki-specific object types to simplify auto-grouping configuration. Any configuration field associated with the selected object type, or a linked object type can be used to filter your environment when populating a group.
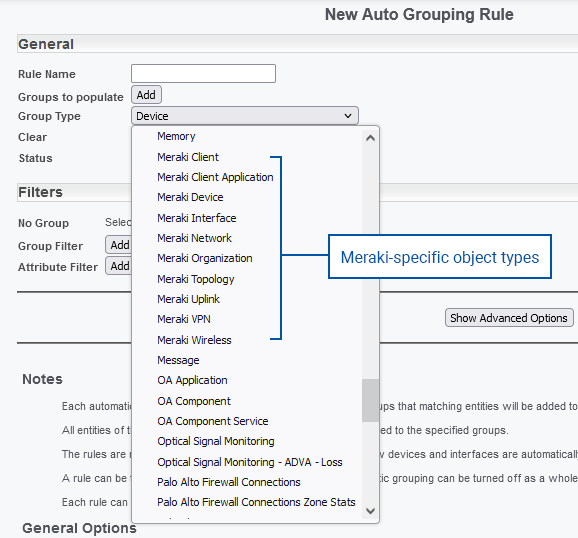
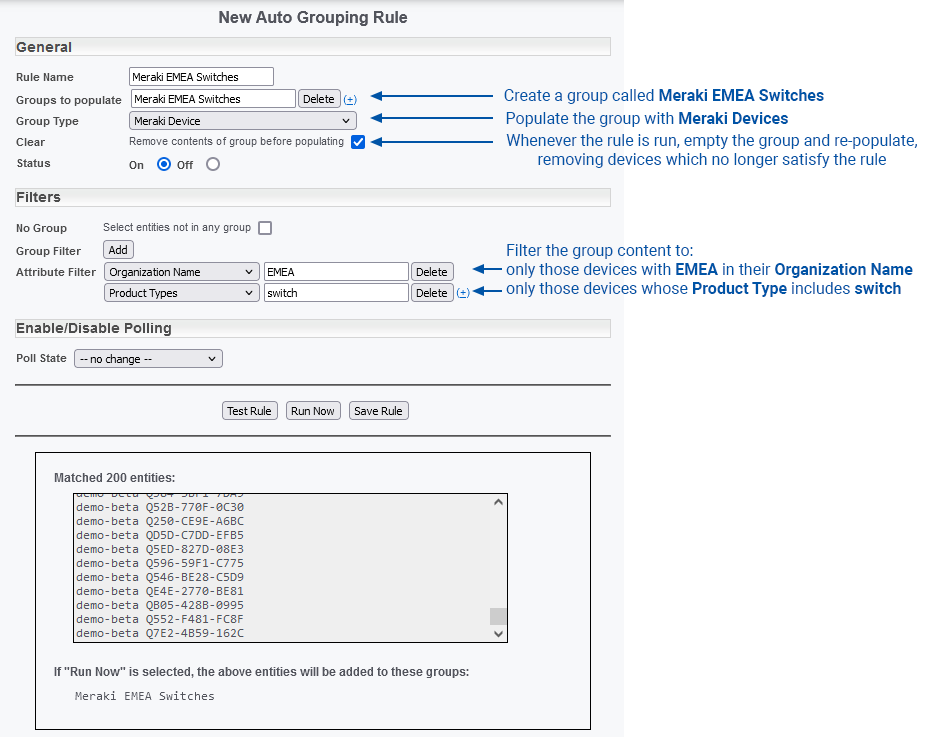
Example: Meraki EMEA Switches
- Group Type: Meraki Device – populate the group with Meraki Devices
- Attribute Filters:
- Organization Name: EMEA – the device must have an Organization Name which includes the string “EMEA”
- Product Type: switch – the device must have a Product Type which includes the string “switch”
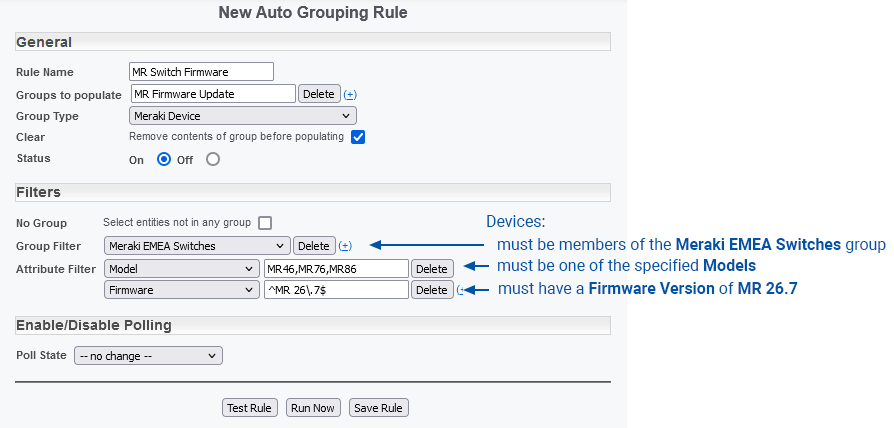
Example: Meraki EMEA Switches with a specific Model and Firmware
- Group Type: Meraki Device – populate the group with Meraki Devices
- Group Filter: Meraki EMEA Switches – devices must be a member of the specified group
- Attribute Filters:
- Model: MR46,MR76,MR86 – the device must have one of the listed Models
- Firmware: ^MR 26\.7$ – the device must have a Firmware Version exactly equal to “MR 26.7”
For more information on grouping see:
Meraki Threshold and Alert Configuration
Thresholding Against Meraki Data
Statseeker provides a number of Meraki-specific object types to simplify threshold configuration. Any timeseries field associated with the selected object type, or a linked object type can be the target of a threshold configuration.
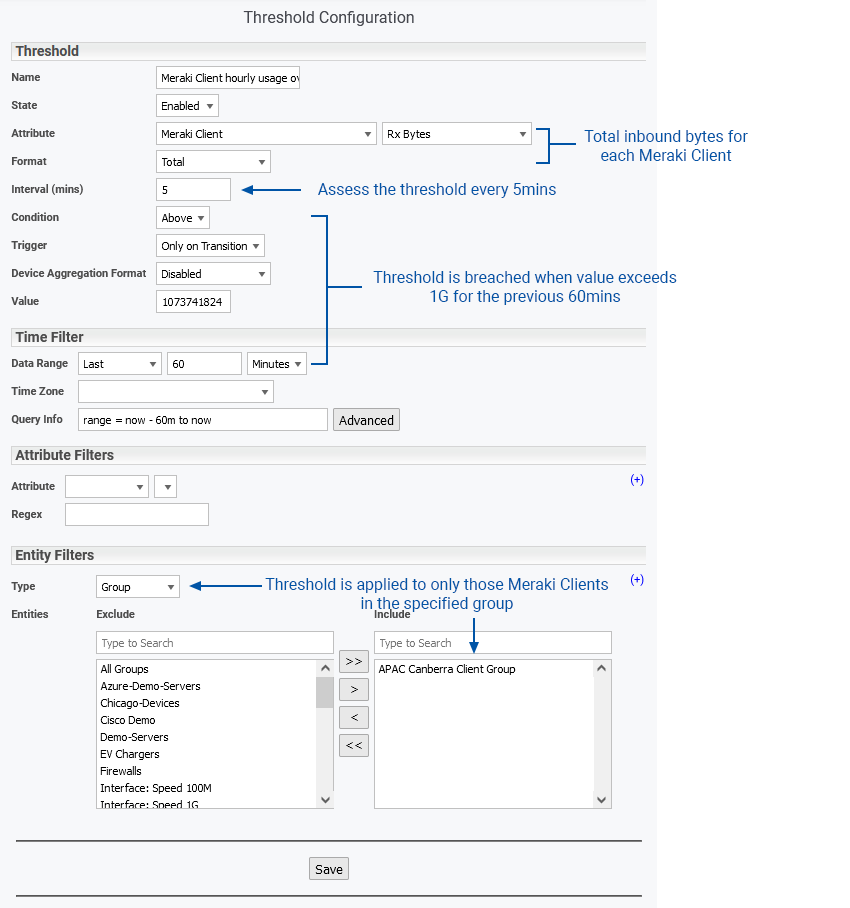
Threshold Example: Meraki Client Data Usage
Every 5 minutes, review the total inbound bytes for the previous 60 minutes, for each Meraki Client in the APAC Canberra Client group. If the total inbound bytes exceed 1G, then record an event.
Alerting on Meraki Events
Meraki-centric alerts can be configured to trigger in response to:
- Events generated by your Meraki environment
- The breach of a Meraki specific threshold, or a non-Meraki specific threshold targeting Meraki infrastructure
- Meraki device and interface state changes (ping up/down etc)
- The content of SNMP trap data forwarded from Meraki infrastructure to your Statseeker server
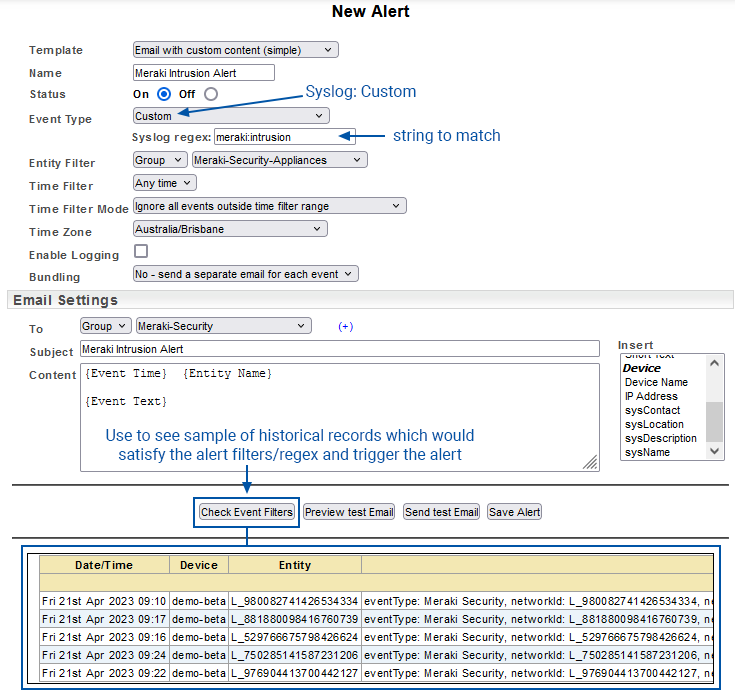
Alert Example: Meraki Router Authentication Bypass
Meraki events are automatically forwarded to Statseeker as syslog. Alerts can be configured to trigger in response to the content of these messages. In the alert configuration below:
- Event Type = Syslog > Custom and a regex string match is used to filter the syslog content
- A group filter is applied to limit the scope of the alert to a selection of devices
For more information on threshold and alert configuration see:
Meraki Data Types
The following data types can be specified in the Dashboard Panel> Metrics tab > Object and Report > Report Data Type fields to return Meraki specific data.
For complete details of the data available from each of these data types, refer to their API descriptions.
| Name | API Reference | Description |
| Meraki Organization | cdt_meraki_organization | Provides high level information about polled Meraki organizations
|
| Meraki Network | cdt_meraki_network | Provides information about polled Meraki networks
|
| Meraki Device | cdt_meraki_device | Provides information about Meraki devices
|
| Meraki Interface | cdt_meraki_port | Provides information about Meraki switch interfaces
|
| Meraki Uplink | cdt_meraki_uplink | Provides information about Meraki MX device network uplinks
|
| Meraki Wireless | cdt_meraki_wireless | Provides information about Meraki wireless access points
|
| Meraki Client | cdt_meraki_client | Provides information about Meraki network clients and their connection history
|
| Meraki Client Application | cdt_meraki_client_application | Provides statistics about client applications
|
| Meraki VPN | cdt_meraki_vpn | Provides information about Meraki network VPNs
|
| Meraki Topology | cdt_meraki_topology | Provides a list of Meraki devices, interfaces, and actively connected interfaces
|