Legacy Documentation for Statseeker version 5.5.3
Index
- Default Dashboards
- Create a New Dashboard
- Dashboard Panels
- Saving and Restoring Dashboards
- Copying a Dashboard
- Exporting and Sharing Dashboards
- Moving and Deleting Dashboards
- Dashboard Settings
- Time Filter
- Keyboard Shortcuts
Default Dashboards
Every Statseeker install contains a number of default dashboards that are located in the Default Dashboards folder and are available to all users. These non-editable dashboards are created and maintained by Statseeker, the current default dashboards being:
- Network Summary – a high level summary of the current state of the network with details on down devices and device-level events, ping statistics highlighting latency issues, and identifying potential interface and link congestion. The dashboard features drill-down links to device and interface events reports, as well as the Device and Interface Overview dashboards
- Device Overview – provides details on a selected device including current state, recent availability, latency, interface usage and traffic volume, event records and basic device health metrics such as CPU and memory load. The dashboard features drill-down links to device events records and the Interface Overview dashboard.
- Interface Overview – offers a detailed look at the interfaces of the selected devices, detailing interface configuration, utilization, traffic volume and rate, and errors and discards. The dashboard also offers links to the Device Overview, filtered to the selected interfaces’ parent device.
- Asset Overview – an overview of the infrastructure makeup of your network, providing guided breakdowns on device and interface counts, MAC/IP configuration, and operational status
- MAC-IP-Switchport Overview – an overview of the network’s MAC/IP/Switchport configuration with breakdowns by VLAN, device, interface, and ARP Router
These default dashboards are maintained by Statseeker and are not editable. If you would like to edit any aspect of the default dashboards you will need to create an editable copy of the dashboard. To do this:
- Open the dashboard Settings by clicking the
 icon in the top-right of the dashboard
 - Select Save As
- Specify a name and save location for your new dashboard and click Save
The newly created copy will inherit permissions from the parent folder and will specify a user-specific edit permission for the user that created the copy.
Create a New Dashboard
To create a new dashboard:
- Select Dashboards > Dashboards Home from the main navigator

- Click the new dashboard icon

Dashboards can also be created from within the Dashboard Manager:
- Select Dashboards > Dashboard Manager from the main navigator

- Click the new dashboard button
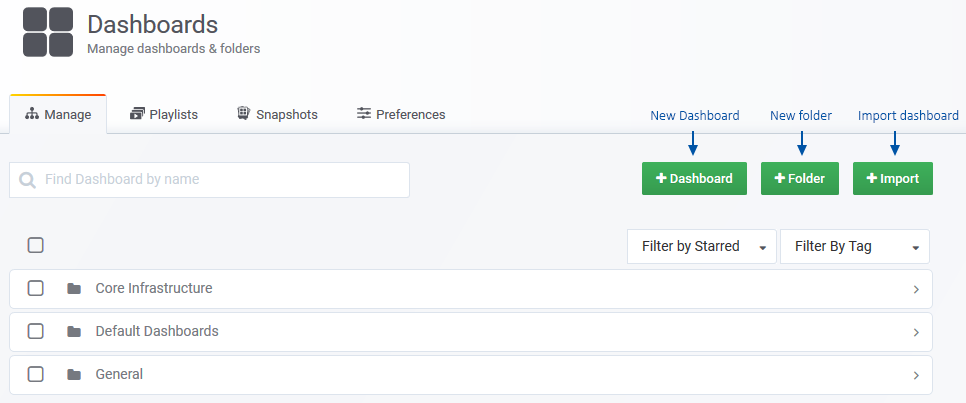
Once a new dashboard has been created:
- Add and configure dashboard panels as needed and Save the dashboard when done.
Importing Dashboards
Importing dashboards allows you to create a new dashboard from the configuration file of an existing dashboard. Importing can be achieved from either the Dashboard Manager, or from the Dashboard Home page. To import a dashboard from Dashboard Home:

- Click the import dashboard icon

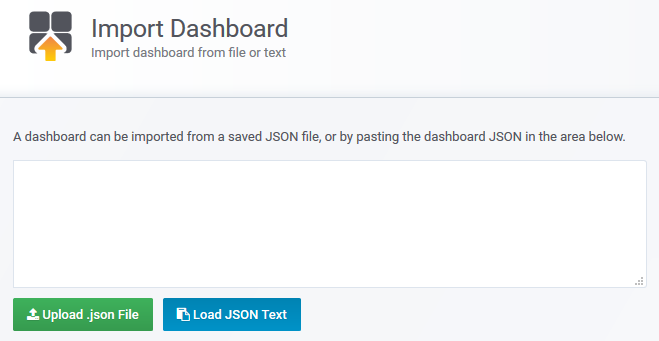
:
- If you saved the dashboard configuration to file, click Upload .json file and select the saved file
- If you saved the dashboard configuration to the clipboard, paste the config into the import panel and click Load JSON Text
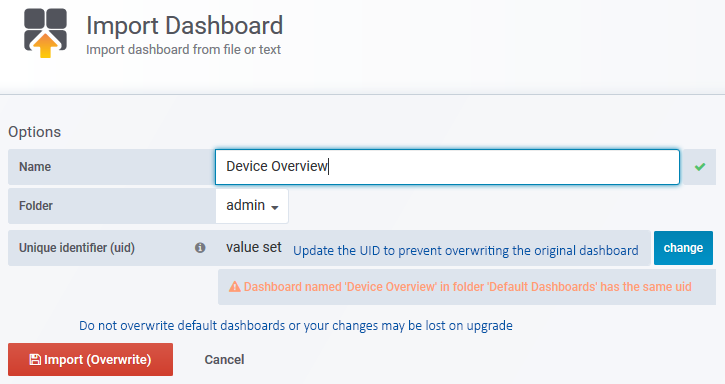
- Update the dashboard name
- Set the folder to house the new dashboard
- Update the UID – failure to do so will result in the original dashboard being overwritten
If you are importing a copy of one of the default dashboards, then it will be flagged as non-editable. To resolve this:
- Click the
 icon in the top-right of the dashboard to open dashboard settings
 - Click Make Editable and save the dashboard
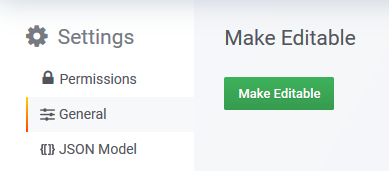
The copy of the default dashboard is now editable, and you can proceed to tailor the dashboard to your needs.
Panels
Dashboards consist of one or more panels, each panel providing one of:
- A view into your Statseeker data
- Static text
- HTML content
- A clock
- A dashboard layout element
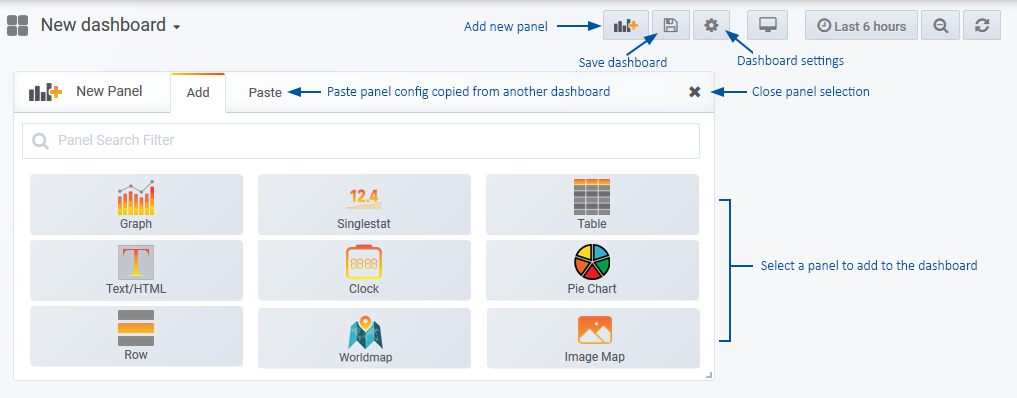
Statseeker offers a range of panel types:
- Graph – a graph of one or more monitored metrics
- Singlestat – a single summary value for a data series (min, max, average, sum, etc.), which can optionally be represented as a gauge
- Table – a data table
- Text/HTML – text which can be static, or dashboard variable driven. This panel can also be used to house imported content such as Statseeker reports or 3rd-party web content.
- Row – a collapsible row used to manage panel layout within your dashboard
- Clock – a clock displaying server time, or countdown to a marked deadline
- Pie Chart – can be used to present timeseries, configuration or asset data
- Worldmap – data related to geographical locations on a map background
- Image Map – place nodes over a custom background image, and have those nodes display configuration, state or timeseries data
Saving and Restoring Dashboard
When saving dashboards, you are presented with the option to add a note identifying the changes made.
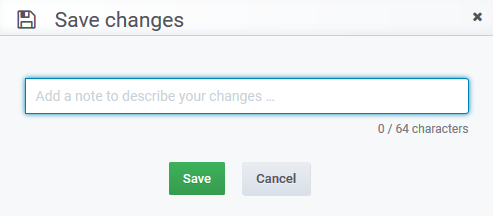
These notes, along with the time of the save-point are used to build a version history of the dashboard. The version history allows dashboard editors to roll-back changes, restoring a dashboard to a previous state.
To view the version history:
- Click the dashboard Settings button

- Select Versions
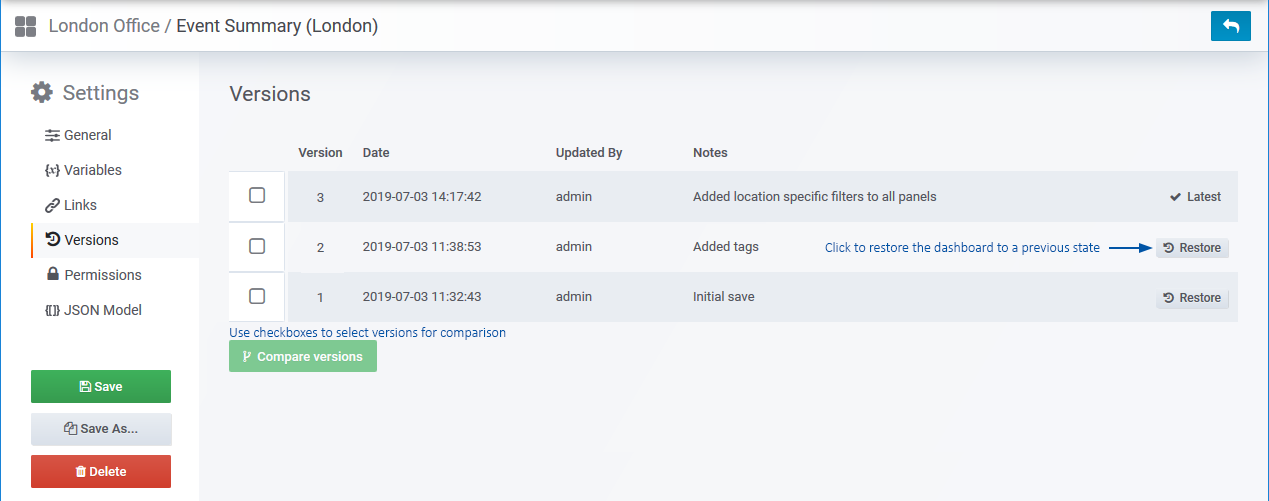
The versions screen allows you to compare any two versions, displaying a summary of the changes made as well as the option to view a diff of the JSON underlying the dashboard configuration.
If needed, you can roll the dashboard back to a previous state by clicking the Restore button associated with that version.
Restoring the dashboard to a previous state adds the restored state as a new version, retaining all saved states of the dashboard.
Copying a Dashboard
A local copy of an existing dashboard:
- Select Dashboard Settings
- Click Save As
- Specify a name and save location and click Save
Exporting and Sharing Dashboards
There are 3 options for sharing your Statseeker dashboards:
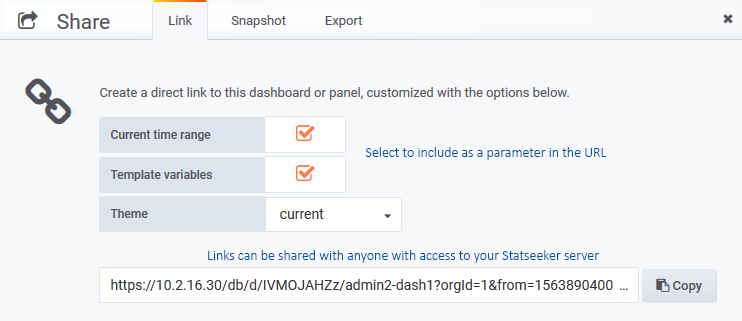
- Link – create and copy a link to your dashboard, optionally including your current timefilter and variable settings. Requires that those receiving the link have both access to the Statseeker server and the ability to view all data displayed in the dashboard.
- Snapshot – creates a record of the current state of the dashboard and caches the data displayed, allowing anyone to view the data as contained in the snapshot. Requires access to the Statseeker server to view.
- Export – used to create a copy of the dashboard configuration and from that configuration, create a new dashboard.
To link, snapshot, or export a dashboard:
- Select Share from the dashboard actions in the top-right

Dashboard Links
The current time filter, and any dashboard level variables used by panels within the dashboard, can be included when creating the link.
Snapshots
The current state of a dashboard, including the data can be saved as a snapshot. This snapshot can be shared with anyone that has access to the Statseeker server and includes not only the dashboard configuration but also a cached copy of the data displayed in the dashboard at the time the snapshot was taken. Once created, a snapshot cannot be edited in any way, only viewed, and deleted.
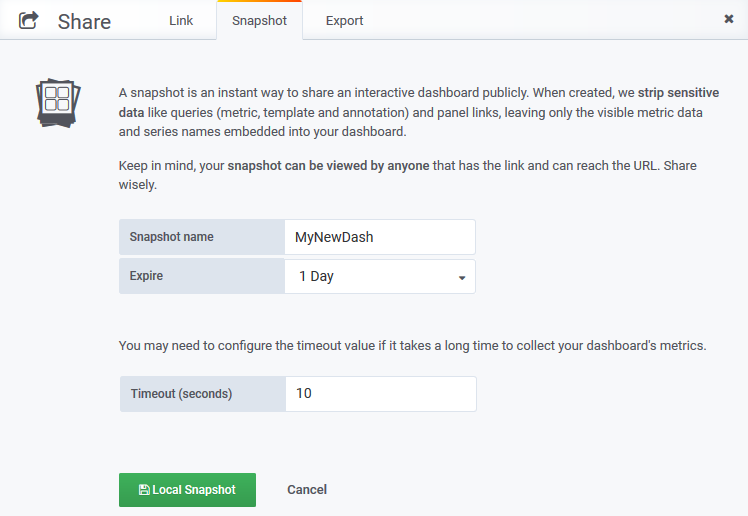
When the snapshot is created, Statseeker effectively reloads the dashboard in the background and caches everything. If the dashboard typically takes a while to load all data on refresh, then consider running a refresh first to get a rough estimate of how long is needed, then set the snapshot timeout value accordingly. If the timeout is set too low to retrieve all the required data, then users viewing the snapshot may see empty panels and panels presenting error messages.

Export
A dashboard configuration can be exported and shared with any other Statseeker user. This export includes the dashboard panels, filters, and settings, but not the data. Exporting a dashboard allows you to share your dashboard with another user, providing them with a copy which they can view and edit as their own.
The dashboard configuration can be saved to a file (in JSON format) and then imported to create a new dashboard.

Alternatively, the configuration can be copied to the clipboard and from there, copied into the configuration file, creating a new dashboard.
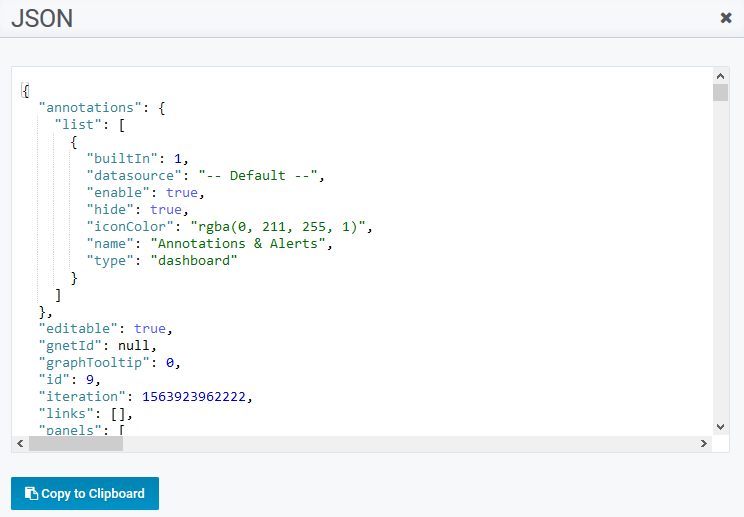
Importing an exported dashboard configuration is handled in the Dashboard Manager, see Dashboard Manager > Manage
Moving and Deleting Dashboards
Moving and deleting dashboards can be handled from either the Dashboard Manager, see Dashboard Manager > Manage tab, or from within the dashboard itself.
Moving a Dashboard
- View the dashboard and select the Settings icon in the top-right

- Select General
- Update the specified Folder and click Save
Deleting a Dashboard
- View the dashboard and select the Settings icon in the top-right

- Select General
- Click Delete and confirm the action when prompted
Dashboard Settings
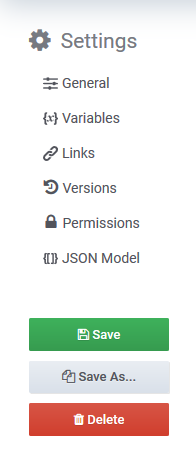
Select the  icon to view the Dashboard Settings.
General
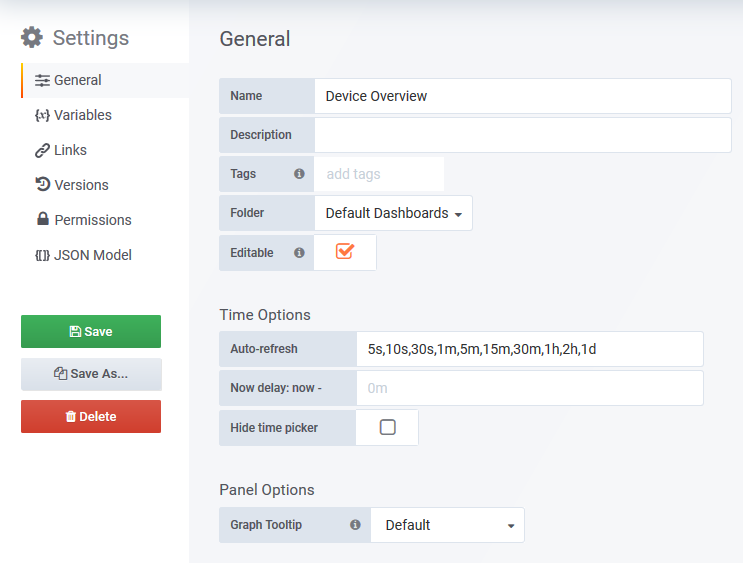
- Return to the dashboard view
- Save the dashboard
- Return to Dashboard Settings
- Name – edit the dashboard name
- Descriptions – set a description
- Tags – apply tags to be used when searching for or filtering dashboards
- Folder – move the dashboard
- Editable – toggle the ability for non-Admin users to edit the dashboard (overrules the user-role level viewer/editor permissions when unchecked)
- Auto-refresh – define refresh options available in the time filter
- Now delay – can be set to resolve issues where ‘now’ typically returns NULL for the last polling interval
- Hide time picker – toggle to hide the time filter in the dashboard
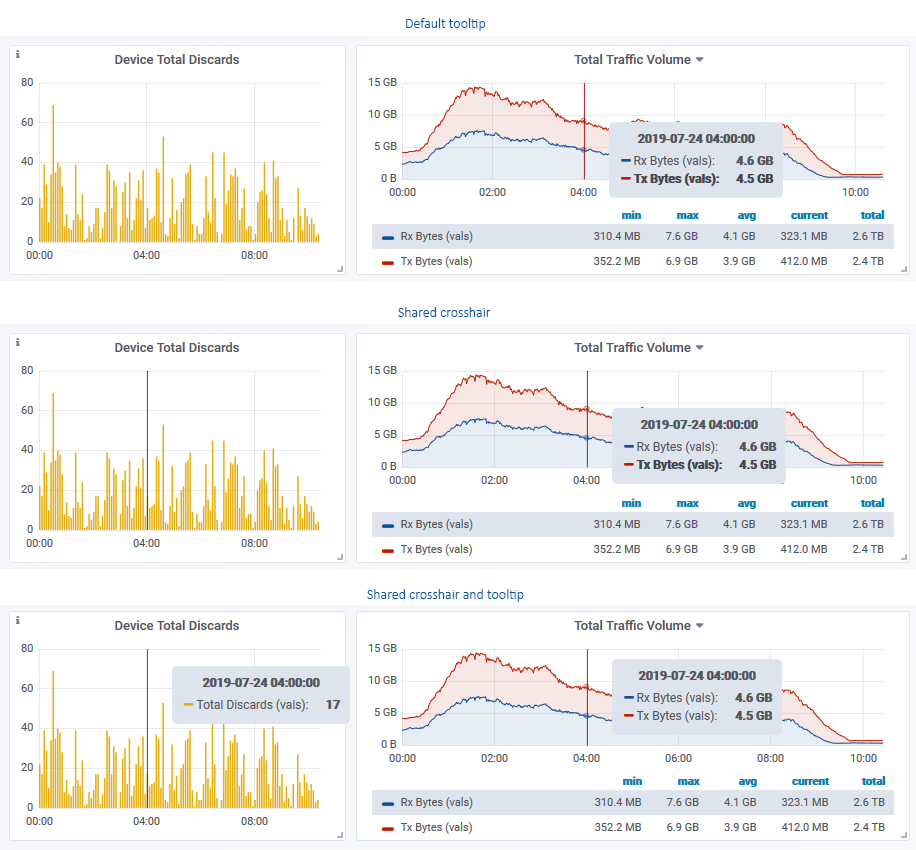
- Graph Tooltip – configure tooltip behavior, this setting can be cycled with the keyboard shortcut Ctrl/Cmd+O
- Default – crosshair and tooltip are only displayed for the graph under the mouse
- Shared crosshair – the tooltip is displayed for the graph under the mouse, but the crosshair is shown on all graphs on the dashboard
- Shared tooltip – both crosshair and tooltip are displayed on all graphs
Variables
Instead of hardcoding values into your panels, you can create dashboard level variables and reference them in your panel configurations. This can be seen in the default Device and Interface Overview dashboards.

Variable Configuration
- Name – referenced by panels making use of the variable with the syntax $name
- Label – optional display alternative to the specified Name
- Type – select variable type (see below)
- Hide – toggle to display variable in the dashboard
Type: Query
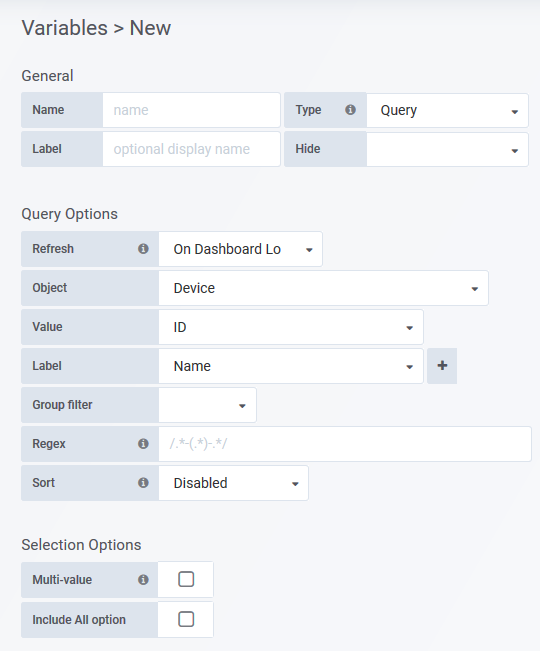
- Refresh – refresh rate for variable values
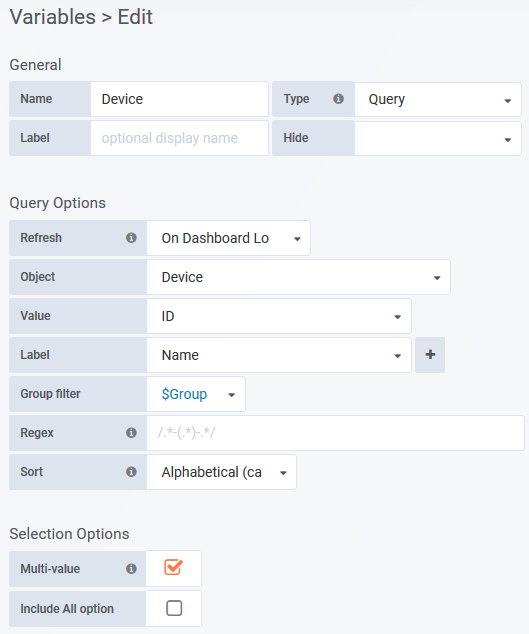
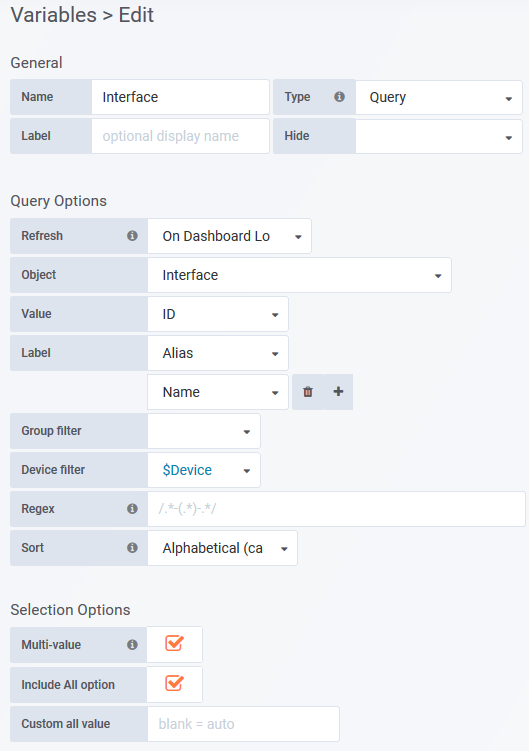
- Object – the Statseeker object list to offer as a variable (e.g. selecting Device will present a list of all devices in the variable)
- Value – the value that will be passed to the panel when the variable is referenced (e.g. If Object = Device, selecting ID will pass the device ID to the panel, selecting Name will pass the device name to the panel)
- Label – The label to display in the variable list (e.g. If Object = Device, and Value = ID, and Label = Name, the variable presents a list of Device names, when an entry is selected the device ID is passed to the panel)
- Regex – set to filter the query
- Sort – sort variable by displayed Label when set, otherwise sort by Value
- Multi-value – toggle to allow multiple selections
- Include All option – toggle to add an ‘All’ option to the variable list
- Custom All – Requires Include All option. Apply a custom regex to be used when selecting the “All” option
- The regex will be run against the variable Value, not the Label
- A blank Custom All field will return a list of all Object entities. Dashboard panels referencing the variable will iterate through that list running a match against each of these values – this can be slow when a very large number of entities are returned. Specifying .* as the Custom All will more efficiently select all entities.
Type: Custom
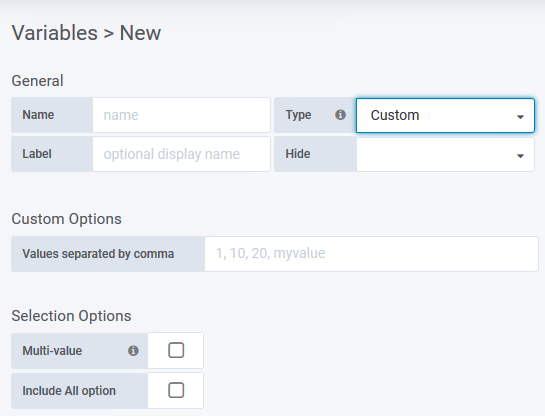
- Values – csv list of values to display
- Multi-value – toggle to allow multiple selections
- Include All option – toggle to add an ‘All’ option to the variable list
- Custom All – Requires Include All option. Apply a custom regex to be used when selecting the “All” option
- The regex will be run against the variable Value, not the Label
- A blank Custom All field will return a list of all Object entities. Dashboard panels referencing the variable will iterate through that list running a match against each of these values – this can be slow when a very large number of entities are returned. Specifying .* as the Custom All will more efficiently select all entities.
Type: Text box
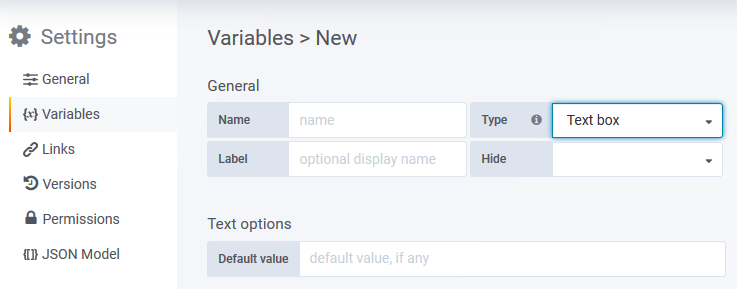
- Default value – optionally include a default value
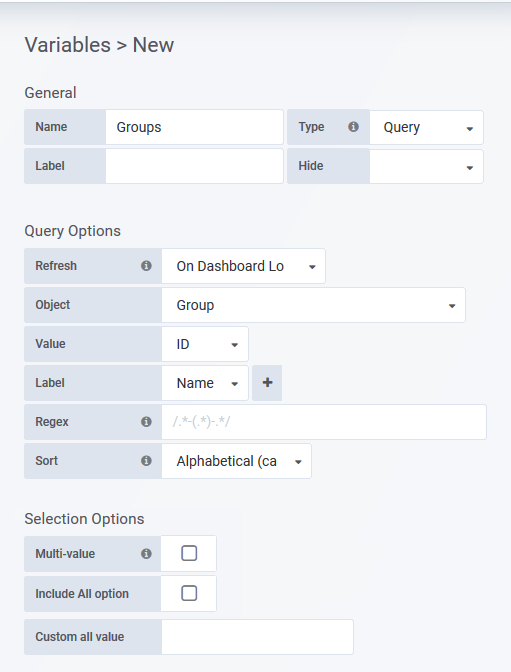
Example: Group Selector
This variable will offer a list of all Statseeker groups. Any panel where Groups = $Groups will have the content of that panel filtered by the content of the selected group/s.
Example: Device Selector
This example will create a variable which presents all monitored devices on your network. Dashboard panels can be configured to reference this variable, filtering their content by the device/s selected in the variable. This example uses the Groups variable from the previous example. The device list presented in this variable will be filtered by the selection in the Groups variable.
This variable is featured in the default Device and Interface Overview dashboards.
Example: Interface Selector
This example will create a variable which presents all interfaces found on a device. This example uses the Device variable from the previous example. The interface list presented in this variable will be filtered by the selection in the device variable.
This variable is featured in the default Interface Overview dashboard.
Links
The links tab allows you to add links to the top-right of the dashboard. These links can be either a list of dashboards and dashboard folders, or a URL.

- Type – the link type, either Dashboard or URL
Type: Dashboard – a list of dashboards and dashboard folders found on the server
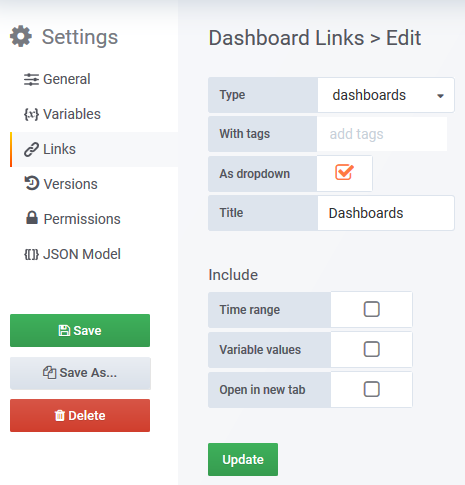
- With tags – filter the dashboard list by the specified tags
- As dropdown – toggle to display the list as a dropdown
- Title – displayed dropdown title
- Time range – toggle to pass the current time filter through to the selected dashboard
- Variable values – toggle to pass the current variable values through to the selected dashboard
- Open in tab – toggle to launch the selected dashboard/folder in a new tab
Type: Link – specify a URL to link to
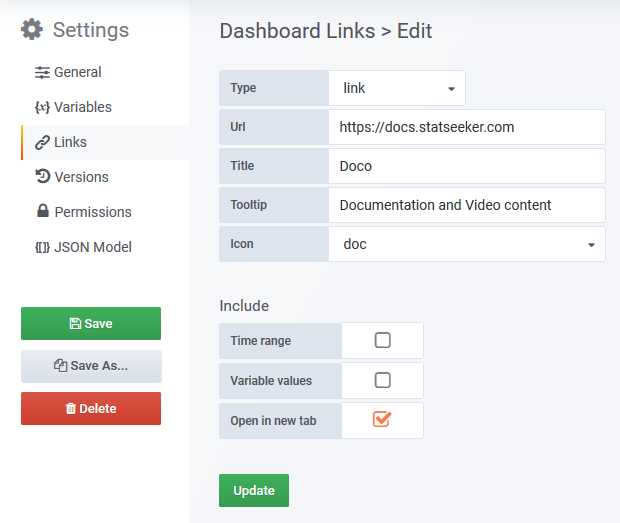
- Url – the URL to link to
- Console report: https://MyStatseekerServer/cgi/nimc02?rid=53410, can be defined as /cgi/nimc02?rid=53410
- Dashboard: https://MyStatseekerServer/#dashboards:StatseekerDefaultDeviceOverview, can be defined as /#dashboards:StatseekerDefaultDeviceOverview
- Title – displayed link title
- Tooltip – content will be displayed on hover
- Icon – icon to display with the link title
- Time range – toggle to pass the current time filter through to the selected URL
- Variable values – toggle to pass the current variable values through to the selected URL
- Open in tab – toggle to launch the selected link in a new tab
Setting Variables from Links
The link setting Variable Values enables you to pass the value from any variable on the dashboard through to a variable with the same name (not label) on the destination dashboard. In some instances, you may wish to set a variable on the destination, but the source doesn’t include that variable, so the option to pass through variable values cannot be used. In this instance you will need to append the desired variable setting as a parameter in the URL.
The syntax for this is:
- /#dashboards:{dashboard_reference}?var-{variable_name}={variable_value}
For example, a link to the Device Overview dashboard with the device variable set to “London-rtr” would be:
- /#dashboards:StatseekerDefaultDeviceOverview?var-Device=London-rtr
Versions
View the dashboard version history, compare version, and restore the dashboard to a previous state. See Saving and Restoring Dashboards.
[top]
Permissions
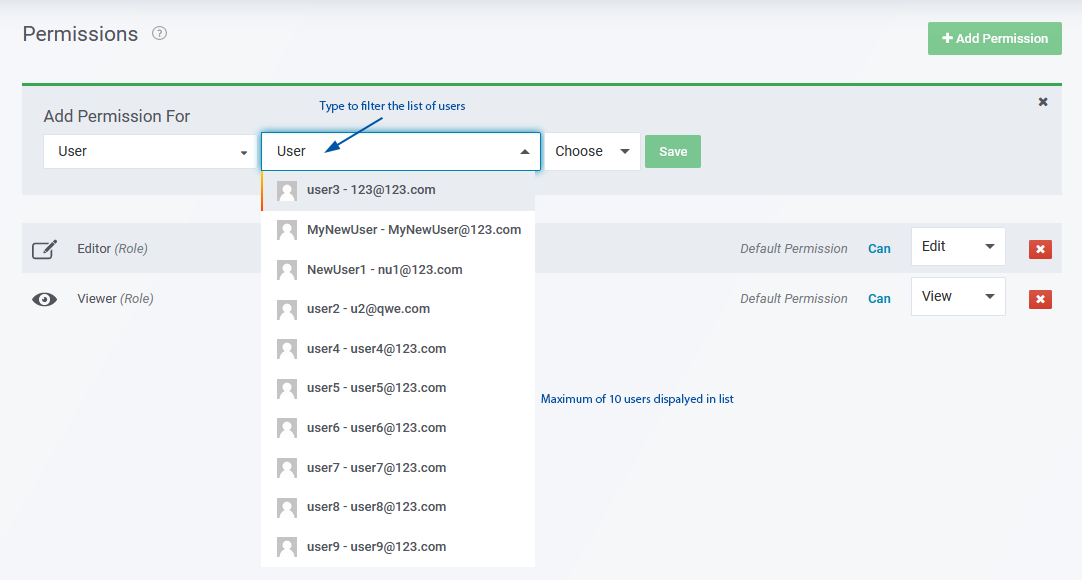
Alter the default dashboard permissions. All dashboards inherit their parent folder permissions, in addition, dashboard editors are able to apply custom permissions specific to that dashboard.
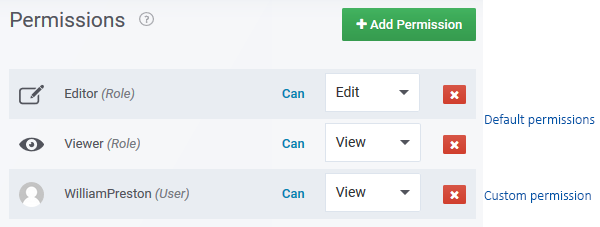
For details on managing permissions and how they interact with users and data visibility, see Statseeker Dashboards and the Dashboard Manager.
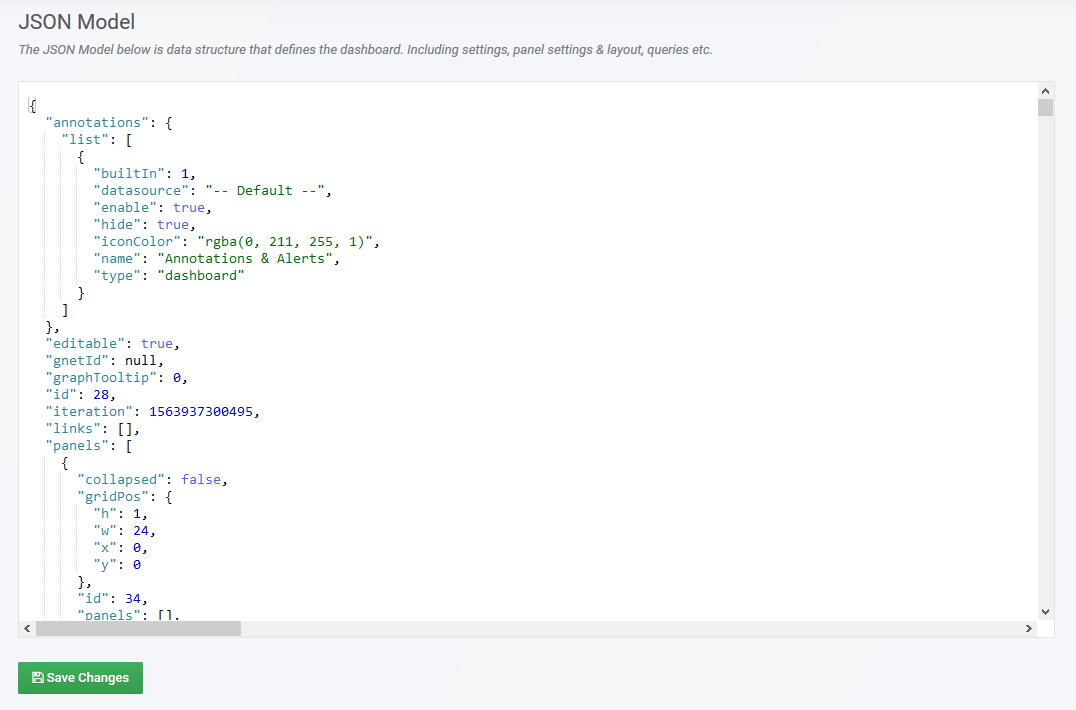
JSON Model
View and edit (not advised) the raw JSON configuration for the dashboard.
Time Filter
The dashboard time filter is used to define the time range of the data to be displayed in the dashboard, as well as refresh rate for the dashboard content.
The dashboard time filter is applied to all panels within the dashboard. This time filter can be overridden with a panel level override set in the Time Range tab of the panel.
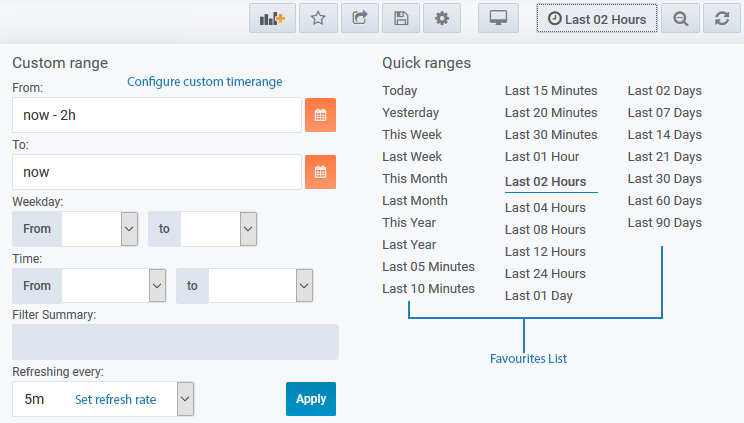
The dashboard time filter cannot handle complex timefilters such as those featuring:
- Multiple time ranges (see Note below for clarification)
- “OR”, “AND”, or “NOT” operators
These timefilters cannot be applied, and if they are contained in your TimeFilter Favorites list, then they will be hidden from that list in the dashboards. However, these timefilters can still be used with your reports, and a report featuring such a timefilter can be embedded in a dashboard via the Text/HTML panel (set Mode = Link).
- “(7am – 11am) and (2pm – 4pm)” – not supported
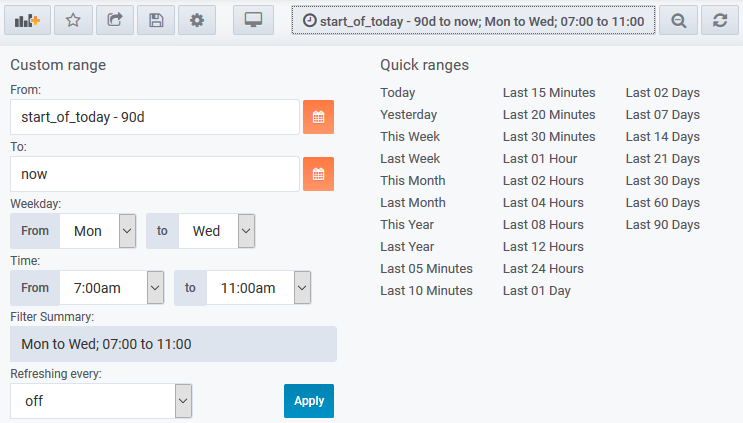
There is no requirement for the reporting period to be a continuous block of time, a time filter with a single ‘time of day’ across multiple days is supported:
- “(7am – 11am), Mon – Wed, for the last 3months” – supported
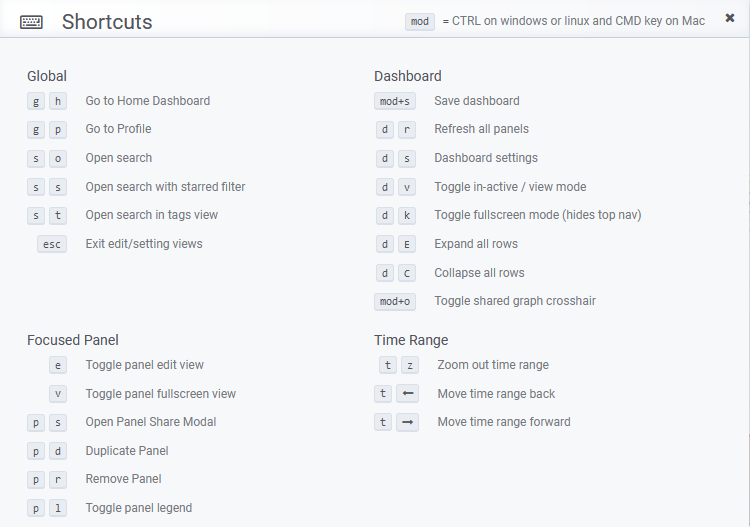
Keyboard Shortcuts
There are a number of keyboard shortcuts available when working with dashboards, a summary of these can be accessed with the shortcut: Shift/Cmd + ?.

