** Legacy Documentation for Statseeker v5.6.1 **
Index
- Overview
- Discovery – how Statseeker is made aware of your network devices
- Grouping – basic report filtering and data visibility
- Dashboards
- Reports
- Information and Training Resources
Overview
This document will guide you through basic Statseeker use and presumes that:
- You have deployed a Statseeker Version 5 server
- You are logged into Statseeker as the admin user
Discovery – how Statseeker is made aware of your network devices
Statseeker can be directed to discover the devices that comprise your network. This process uses SNMP to communicate with the device, and request identification and configuration details of the device. The process can be directed at your entire network, at a subnet, or at a single device.
- SNMP Discovery – guide to discovering your network/subnet via an IP range or a hosts file
- Single Device Discovery – guide to discovering a single device via IP address
In addition to discovery, Statseeker uses an automated daily ‘rewalk’ process to interrogate all previously discovered devices and record any configuration changes that may have occurred on those devices.
Grouping – basic report filtering and data visibility
Grouping is one of the core mechanics used to manage reporting within Statseeker. Grouping allows you to:
- View your network and its infrastructure in various ways by breaking the components down into logical groups based on location, function, or manufacturer
- Manage visibility and access to reports to better support business requirements of a given user, location, or role within your organization
- Efficiently troubleshoot potential issues with the ability to quickly focus on select metrics across like devices or those restricted to a location or subnet
Statseeker offers the ability to automatically group devices/interfaces as they are discovered based on rules that you define, and to edit those rules at any time with changes reflected immediately. You can also manually create and edit groups to best suit your requirements.
Manual Grouping
Manual grouping is a simple process, best suited to populating groups of users and/or reports for access control purposes. While it is possible to manually populate device and interface groups, it can be very labor intensive to manually populate and maintain the contents of groups.
Manual group creation can be done through the Administration Tool:
- Select Administration Tool > User Profile/Grouping > Add / Edit Groups
- Click Add
- Enter a name and click OK

The created group can now be populated with any number and type of entities.
To populate the group:
- Select Administration Tool > User Profile/Grouping > Add / Edit Groups
- Select one or more groups
The Exclude\Include columns will update to display the content of the group/s.
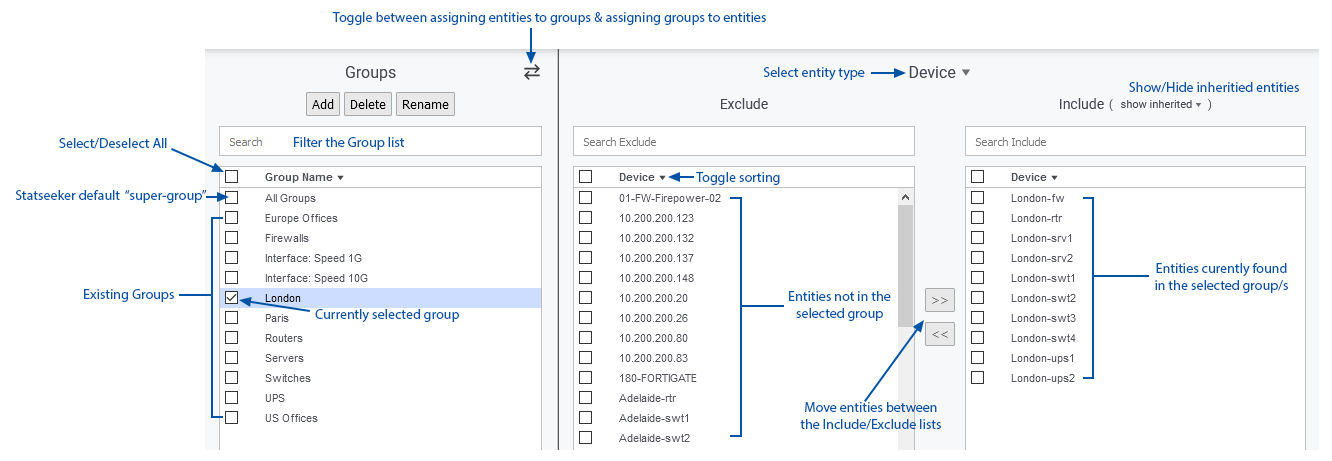
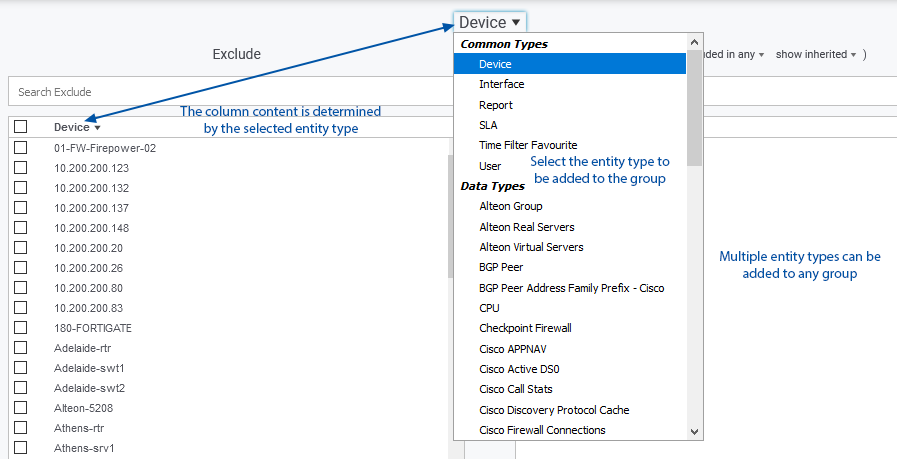
The entity type defaults to Device and the Exclude\Include column content is restricted to the selected entity type.
- Select the type of entity to be added to the group from the drop-down list above the Exclude\Include columns
- Select entities in the Exclude columns and click
 to add the entities to the group
 - Select entities in the Include columns and click
 to remove the entities from the group
There is no confirmation, the group contents are updated immediately.
Selecting Multiple Groups
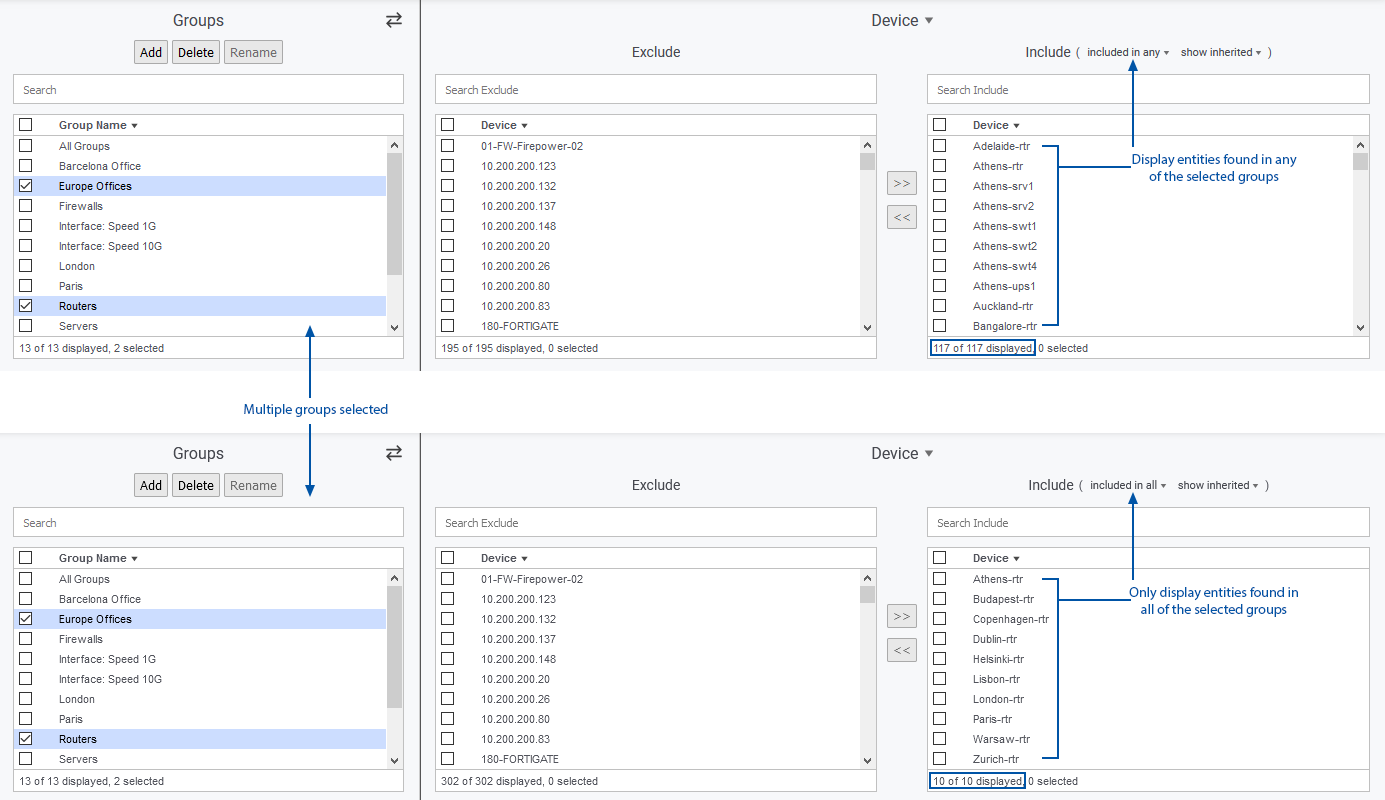
Selecting multiple groups allows you to add the selected entities to each of the groups. When selecting multiple groups the Exclude\Include columns can be configured so that:
- Entities found an any of the selected groups are displayed in the Include column
- Only entities found in all of the selected groups are displayed in the Include column
Automated Grouping
Automated Grouping should be employed wherever possible to group your devices into a range of logical collections. Grouping allows you to quickly narrow the focus of any given report to a subset of your networking infrastructure.
Automated grouping rules are applied during any Statseeker discovery or rewalk process (including the default ‘daily’ rewalk) and in this way, ensure that any changes to your network infrastructure are identified and accommodated without the need to manually update Statseeker.
For details on implementing Automated Grouping rules, and a number of example rule configurations, see Automated Grouping Rules.
Dashboards
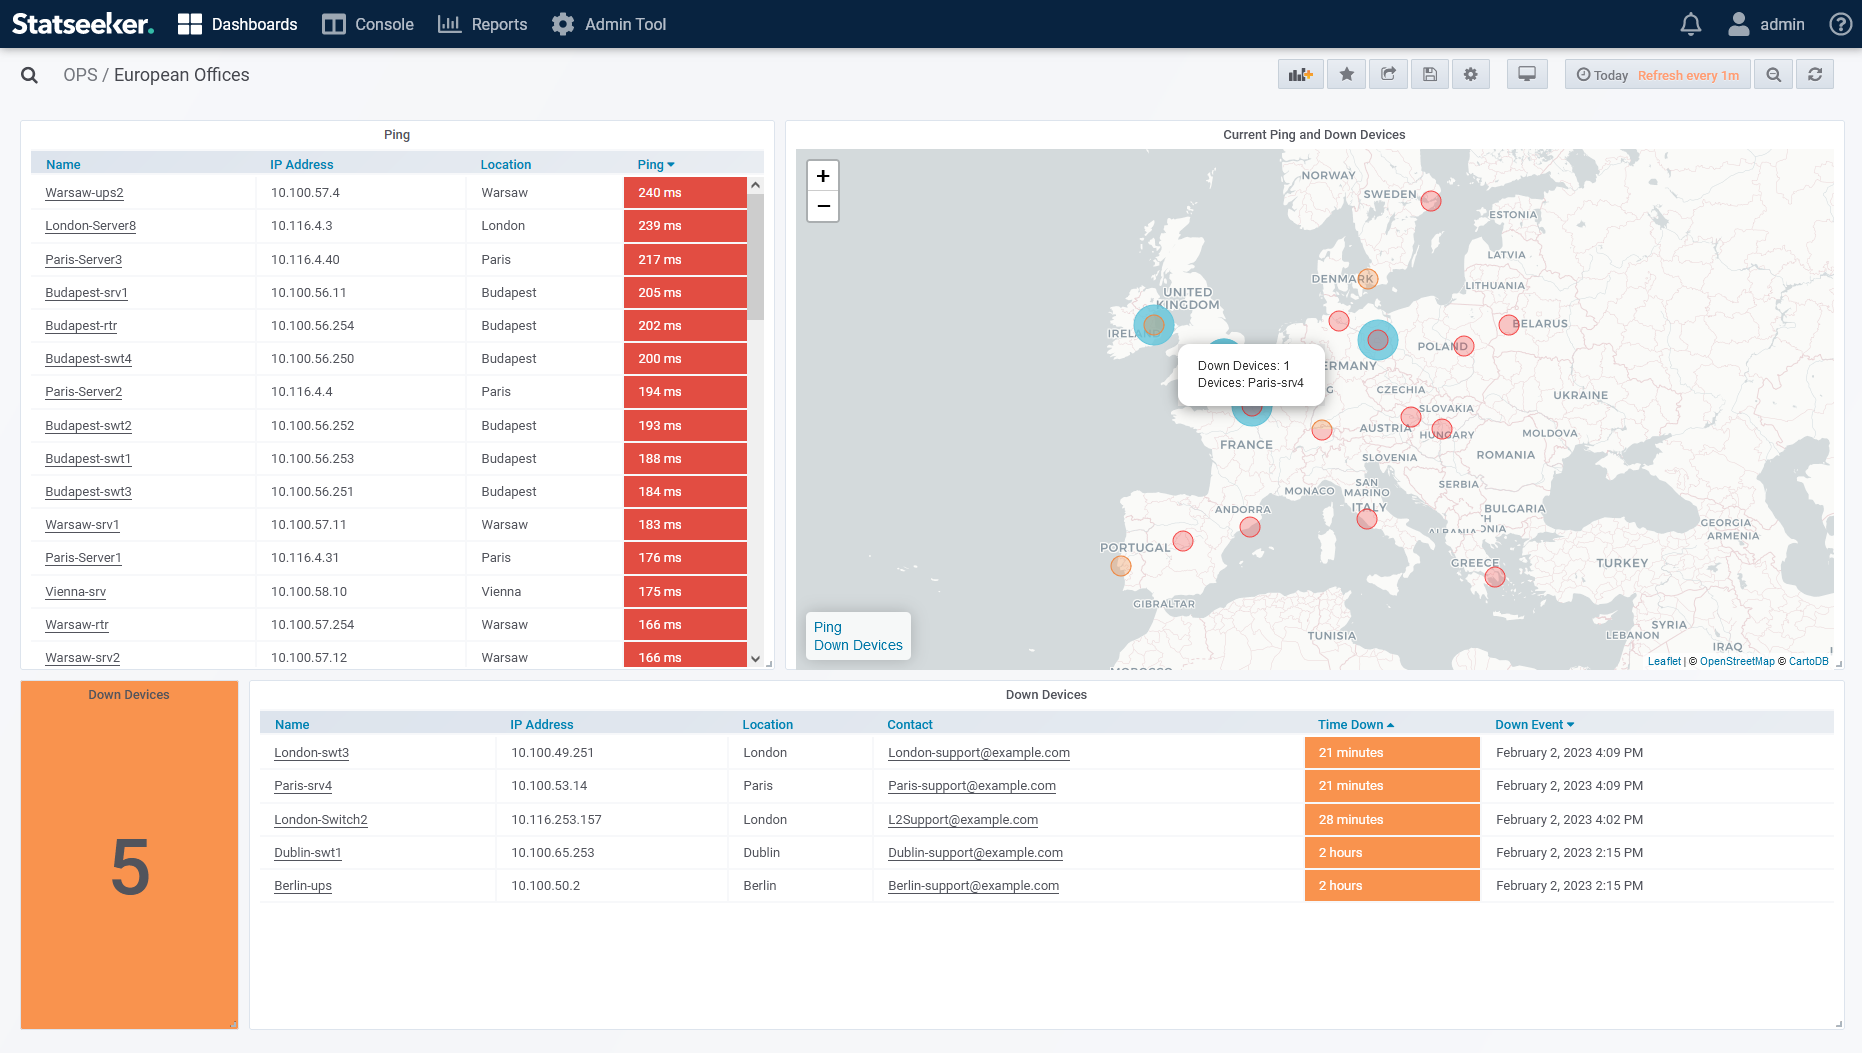
The Statseeker Dashboard Home page is the default view when accessing Statseeker via the web interface. This page offers access to the existing dashboards that the user has permission to view, as well as the ability to create new dashboards, and edit exiting dashboard configurations.

Dashboards are an editable view comprised of one or more ‘panels’, each panel containing a Statseeker report (graph, table, gauge, etc.).
Dashboard Panel Templates
Panel templates are preconfigured panels which can be added to create custom dashboards. Statseeker comes with a range of default panel templates and any panel can be saved as a custom template to be reused as needed. For details on the default panel templates provided by Statseeker, see the Template Library.
Learn more about dashboards:
Reports
The Console panel provides the major entryway into the Statseeker reporting functionality. From here you have access to every Statseeker report, be it pre-packaged, or custom made to suit your exact requirements, as well as the options and filters to focus that report and present the data you want, in the way you want.
Viewing A Report
To view a report:
- Select either a device or a group. Hold Shift while clicking to select groups of devices and Ctrl to add/remove a single device to/from the selection.
- Click a report title to launch the report
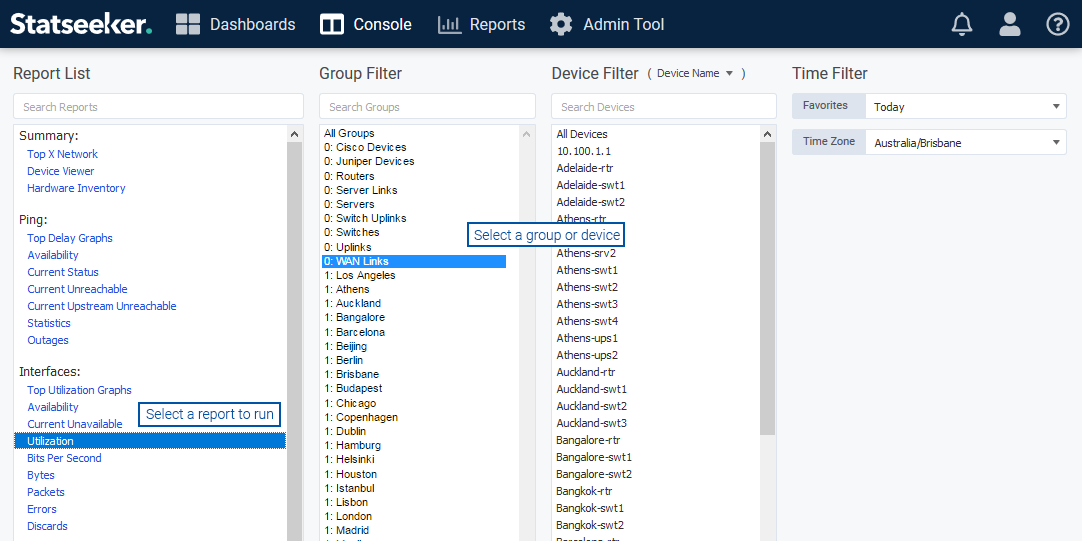
The report will launch in a new window.
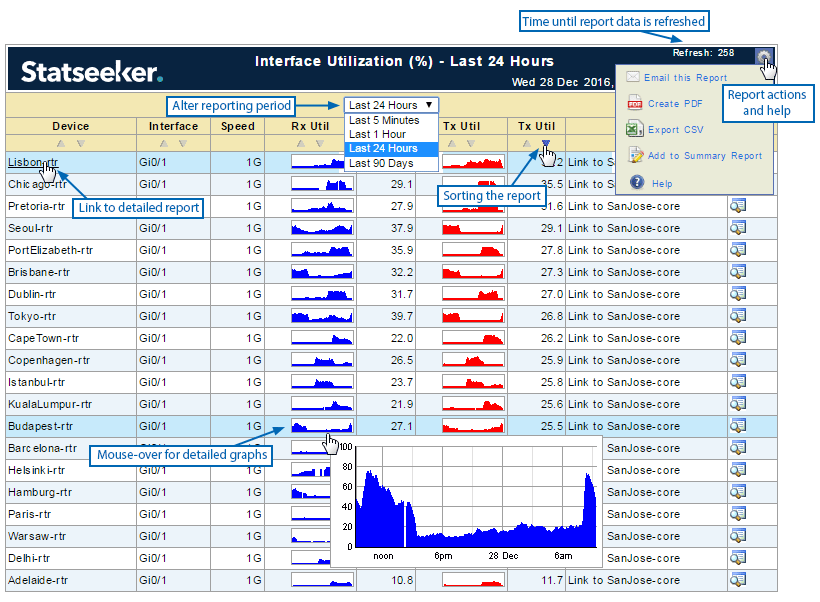
Report Links, Drill Downs & Historical Views
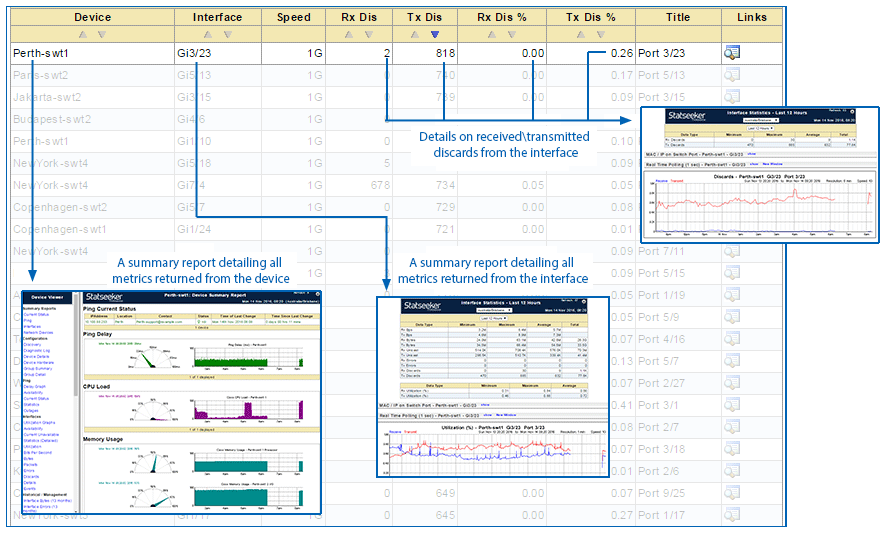
Most reports will offer the ability to drill-down to more specific data regarding a device, interface, property, or activity presented in the report. In this way, you can review a metric across a range of devices, or a range of metrics returned from a single device, identify anomalous values, and then investigate further to resolve the issue as required.
In tabular reports, these drilldowns and pointers to other reports are provided as links on each of the appropriate cell contents, simply click to access the new report.
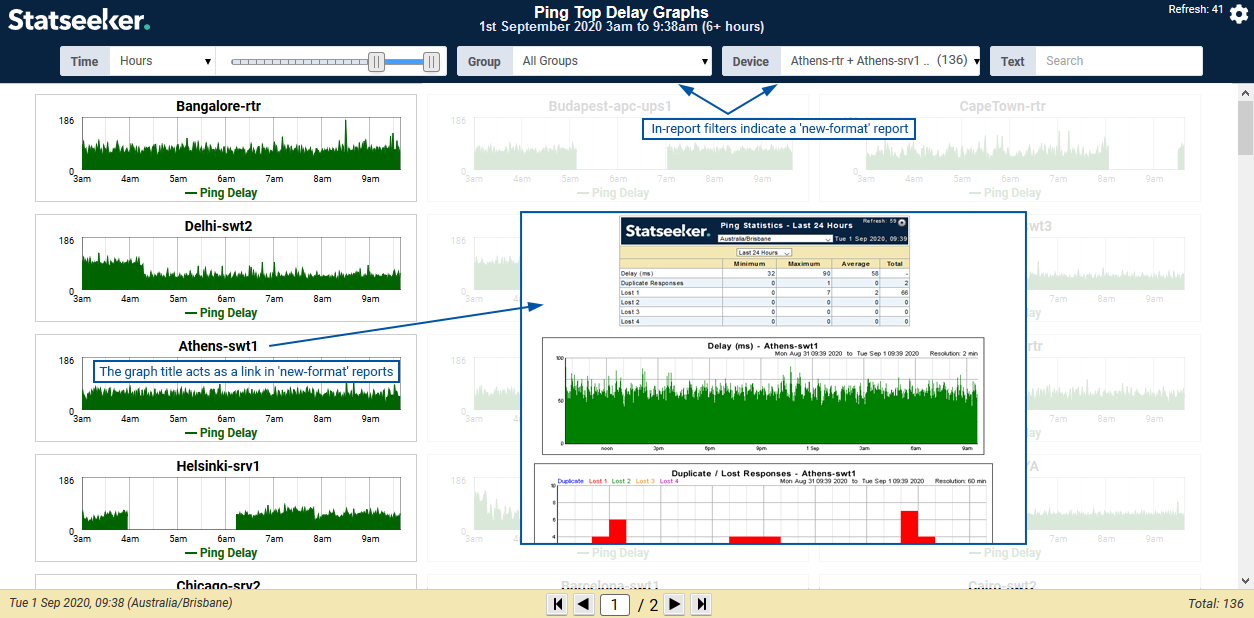
All graphs act as links to a ‘details’ report for that metric on that device.
- Legacy Reports – the graph is the link
- New Reports – the graph title is the link
In a similar manner, you can zoom out to review a device or metric over a larger, historical time scale. By default, most reports will present what is currently happening, but you can easily alter the reporting period to ascertain if the current behavior is anomalous or typical.
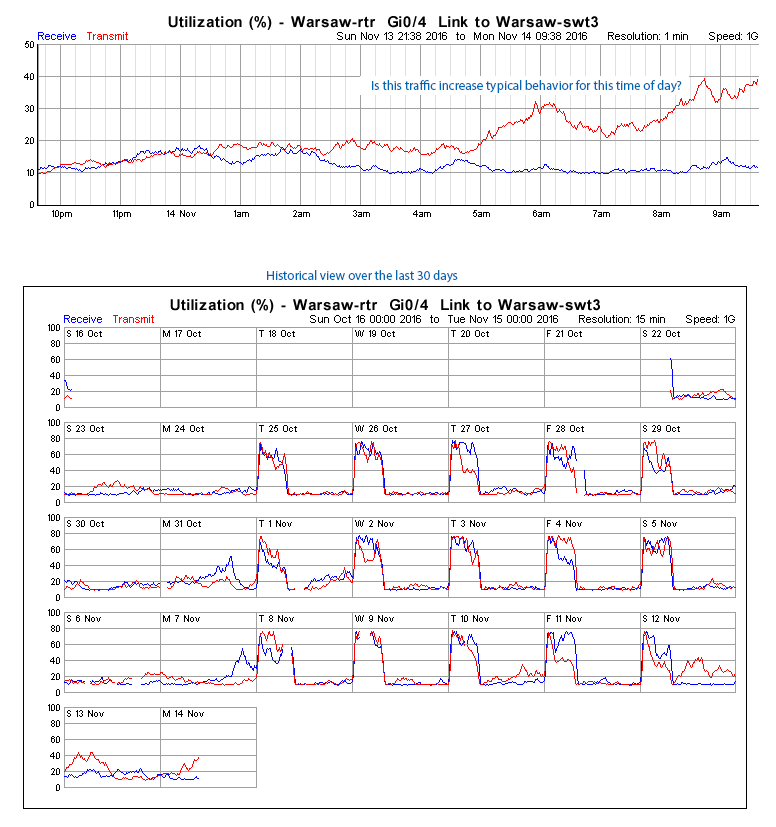
Historical data is available for all devices/interfaces from the moment that they are discovered, and this data is always available at the same 1-minute interval resolution that it was collected. Statseeker will never ‘roll-up’, or average your data, regardless of how long ago it was collected.
Information and Training Resources
There are a range of detailed information and training resources available to Statseeker users. Statseeker maintains a comprehensive Documentation and Video Library which covers all aspects of Statseeker functionality and use.
Statseeker also offers regular training sessions, free, and open to all licensed Statseeker users. These training sessions cover a wide range of topics, with content suitable for those new to Statseeker, through to advanced topics targeted more towards Statseeker experts looking to get the most out their Statseeker deployment. Details on the current curriculum, the ability to register for a session, and access to video of previously run sessions, are all available from Customer Services.
In addition to the regular training curriculum, Statseeker offers private training sessions, tailored to your requirements. For further details on tailored training, please lodge a Training Request.

