
Legacy Documentation for Statseeker version 5.5.3
Index
Overview
The query type determines which options are available when building the query that the panel uses to retrieve data for display. The panel query is configured in the Metrics tab, which is available for Worldmap, Graph, Singlestat, Pie Chart and Table panels. The query types available are:
- Standard – query any timeseries metric, configuration or event data, from any element monitored or managed by Statseeker. Not available for Worldmap panels.
- Event Count – used to generate reports of Statseeker event data, such as syslog and SNMP trap messages, as well as device, interface and threshold events. Not available for Worldmap panels.
- Entity Count – a simple record count query focused on Statseeker entities which equate to both physical and virtual hardware, as well as some hardware configurations. Not available for Worldmap or Graph panels.
- Value by Location – plot metric values by location on a map. Only available for Worldmap panels.
- Count by Location – plot entity counts by location on a map. Only available for Worldmap panels.
For examples of using the query types, see the page relating to that panel type:
Standard
The standard query configuration can query any timeseries metric, configuration or event data, from any element monitored or managed by Statseeker. Not available for Worldmap panels.
Object
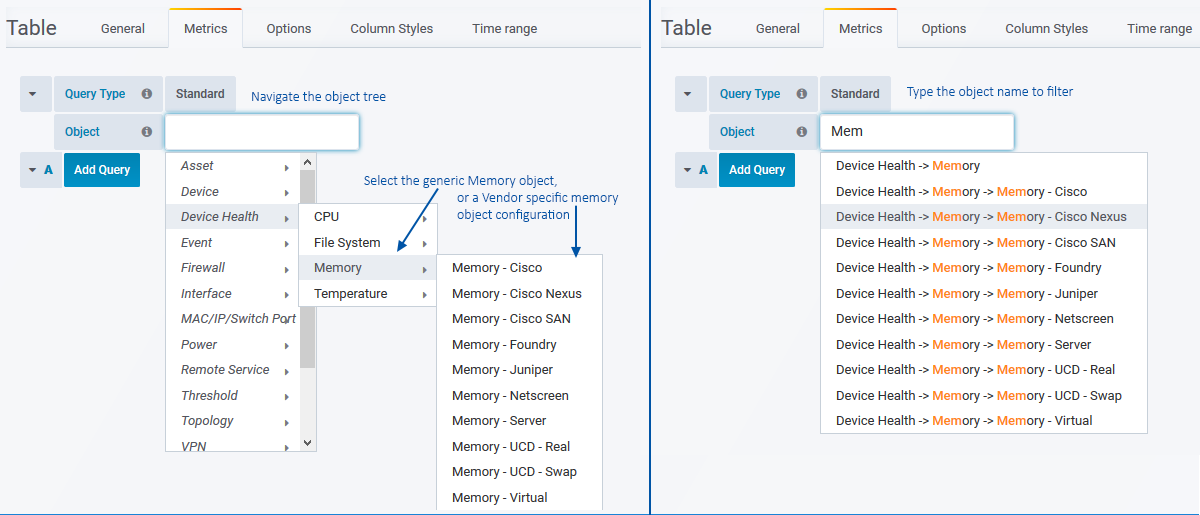
This is the Statseeker object that the query will be returning data on. These objects are logical groupings of data representing everything that Statseeker monitors on your network, as well as the configuration entities used to manage your Statseeker environment, and include:
- Network Devices
- Interfaces on devices
- Temperature, CPU, Memory and File System entities associated with devices
- Device, interface, and threshold events
- Syslog and SNMP Trap messages
- Threshold configurations, and alerts
These objects have been categorized to allow you to easily locate and select the required object by navigating the object tree, or alternatively you can filter the object tree by typing the name of the object you are looking for.
Groups
The groups option will have the same effect as selecting a group in the Console when running a report, or applying a group filter to a custom report configuration. The panel contents will be filtered by the contents of the specified group. When multiple groups are specified, the panel content is filtered by the contents of any group (group1, or group2, … or groupN).
To specify a group:
- Select the group from the list, or begin typing the name of the group to filter the list.
To remove a group:
- Click the trashcan (
 ) to remove the group
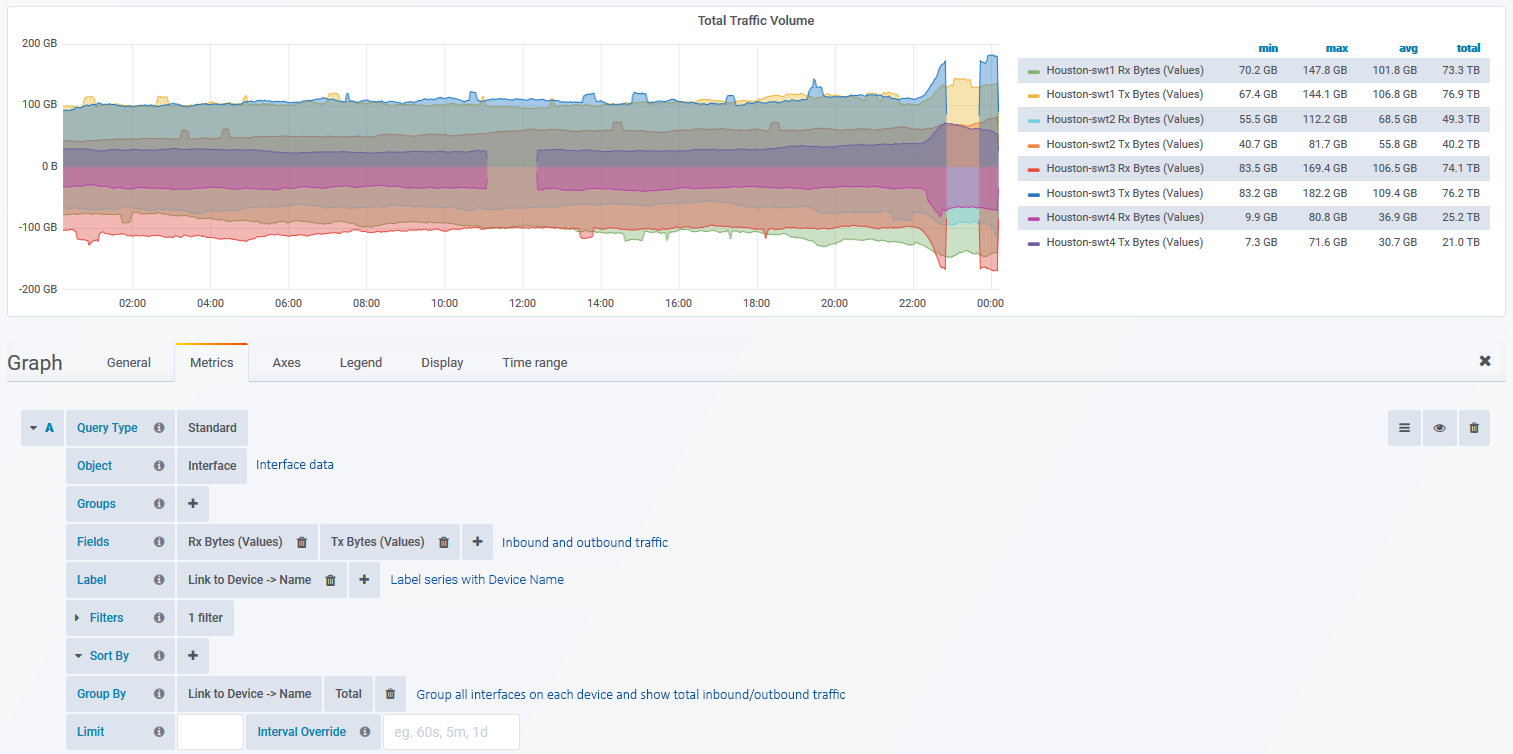
Fields
The fields entry is used to specify all fields that are to be displayed in the panel. The list of available fields is determined by the selected Object and includes all fields associated with that object as well as any linked object.
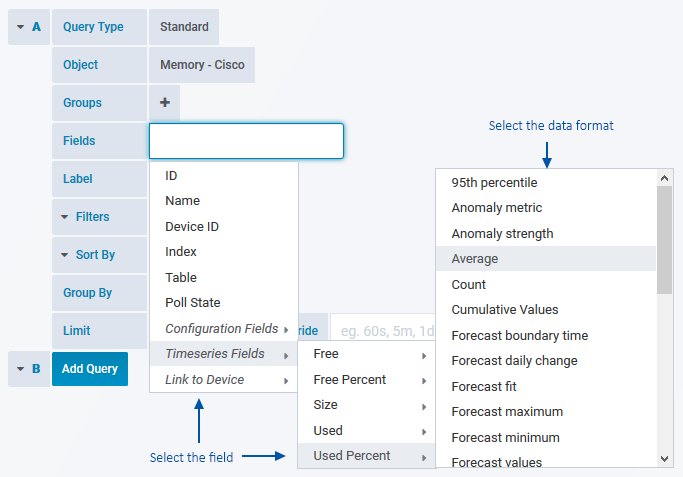
Linked objects are typically the parent object, all interfaces, CPU’s, Memory and FileSystems reside on a ‘device’, so all fields pertaining to that device are also available when configuring the query.
The available fields contain either configuration or timeseries data. When selecting a timeseries data field you are also required to specify a data format:
- 95th percentile – 95th percentile of the data
- Anomaly metric – Metric from -100 to 100 indicating whether requested timeseries values are unusually large or small
- Anomaly strength – Metric from 0 to 100 indicating whether requested timeseries values are typical or unusual
- Average – Average of the data
- Count – Number of non-null data points
- Cumulative Values – Cumulative data values
- Forecast boundary time – Time forecast exceeds feasible value range if before end of timefilter range
- Forecast daily change – The average daily change of forecast values
- Forecast fit – An array of forecast values without periodic deviations at peak and offpeak times
- Forecast maximum – Upper boundary of feasible forecast value range
- Forecast minimum – Lower boundary of feasible forecast value range
- Forecast values – An array of forecast values with periodic deviations at peak and offpeak times
- Maximum – Maximum data value
- Median – Median of the data
- Minimum – Minimum data value
- Standard deviation – Standard deviation of the data
- Start time – Time of the first data point
- Start TZ offset – The timezone offset of the first data point
- Total – Sum of the data
- Trendline daily change – Slope of the trendline (units/day)
- Trendline fit – Trendline data values
- Trendline lower confidence interval – Lower boundary for Trendline confidence
- Trendline Start – Value of the first trendline data point
- Trendline strength – Goodness of fit (R-squared) of the trendline
- Trendline upper confidence interval – Upper boundary for Trendline confidence
- Values – Timeseries data values (individual data points, use for plotting graphs)
When creating graphs you will typically select the Values format. The other data formats are more typically used in tables, and when graphing histograms.
When configuring table panels, the order fields are specified determines the column order.
To specify a field:
- Select the field from the list, or begin typing the name of the field to filter the list.
To remove a field:
- Click the trashcan () to remove the field
To re-order fields:
- Click and drag the field
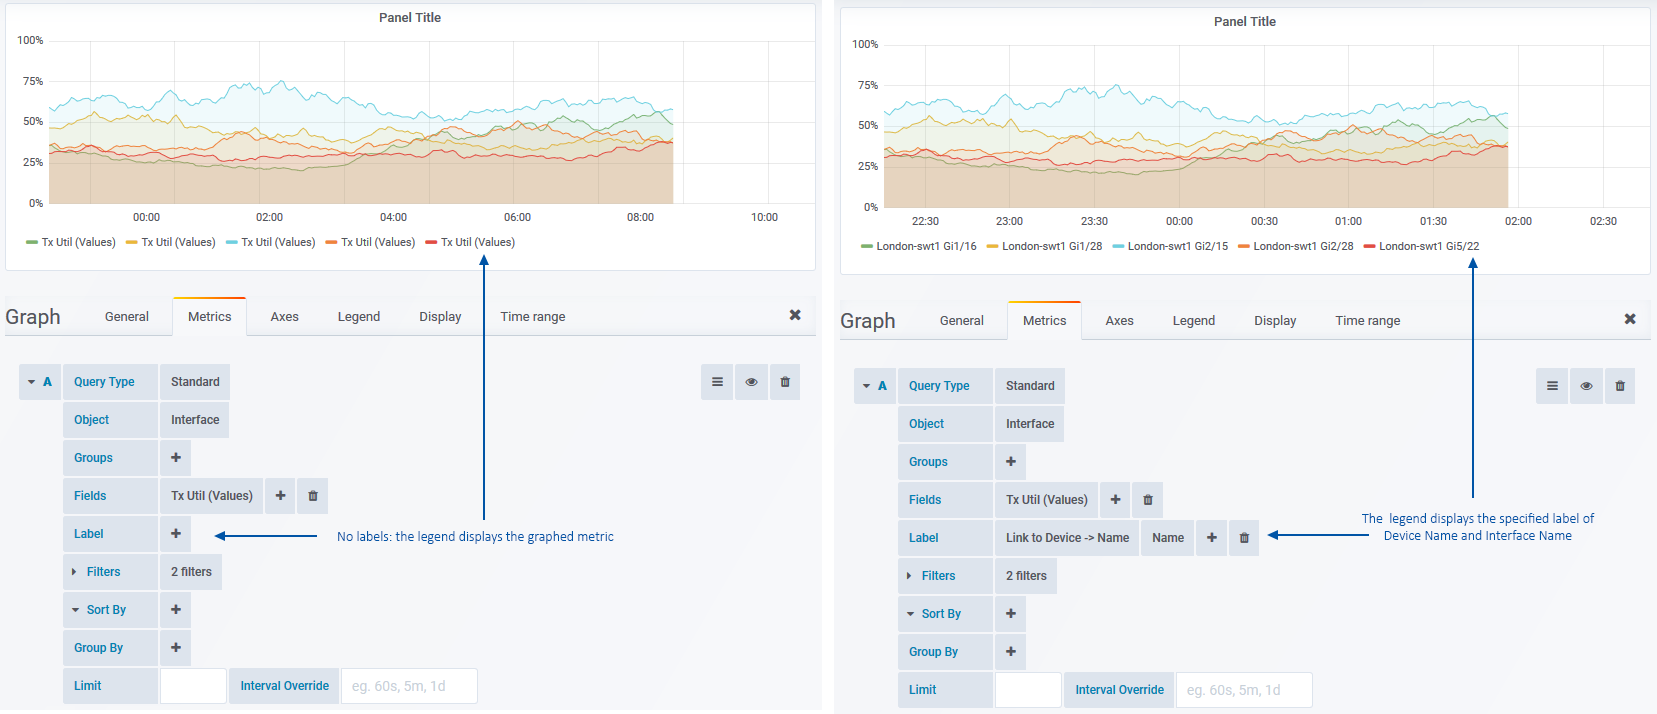
Label
The Label field is used with the Graph and Pie Chart panels to replace the graphed metric name with an identifying label. Multiple fields can be selected to create the label, with entries being displayed in the order that they are added.
To specify a label:
- Select the label from the list of fields, or begin typing the name of the field to filter the list.
To remove a label:
- Click the trashcan () to remove the label
To re-order labels:
- Click and drag the label
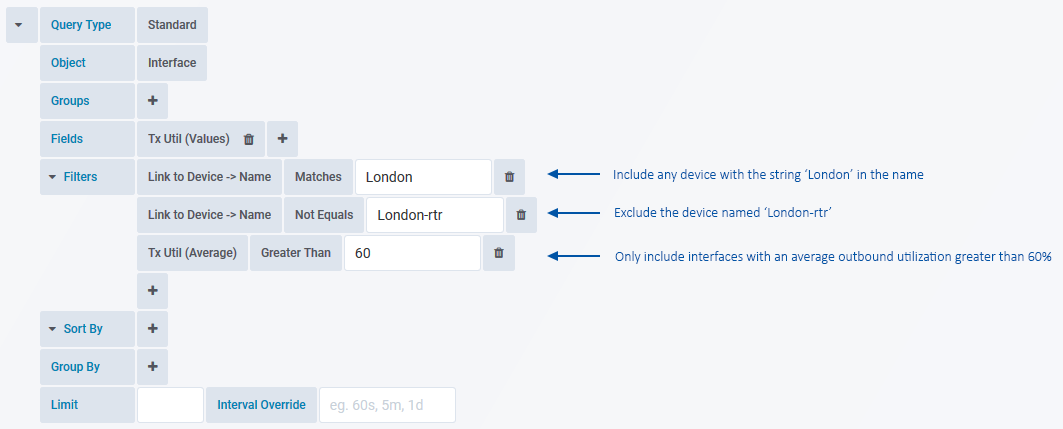
Filters
The Filters entry allows you to filter the content displayed in the panel, without filters every panel would display data from every instance of the specified Object.
Filters are configured by specifying a field, and then applying a filter, consisting of an operator and a value, to that field. Multiple filters can be applied, and only data series satisfying all filters will be returned.
The available operators are:
- Equals – enter a string to match exactly
- Not Equals – enter a string to match exactly, and then exclude
- Matches – enter a sub-string to match against
- In – requires non-timeseries field. Enter a comma separated array of values, any data series matching any one of these values will be included.
- Greater Than – requires timeseries field and format. Enter a value, any data series with the specified metric exceeding the value will be included.
- Less Than – requires timeseries field and format. Enter a value, any data series with the specified metric below the value will be included.
- Between – requires timeseries field and format. Enter two comma separated values, any data series with the specified metric between the two values will be included.
Examples
- Device Name Equals London-rtr – the entity named ‘London-rtr’
- Device IP Matches 10.100.59 – any device with an IP in the 10.100.59.0/24 subnet
- Interface Tx Util (Avg) Greater Than 40 – interfaces with an average outbound utilization of greater than 40% over the reporting period
- Device Location In London,Paris,Madrid – any device where the Location is set to any of London, Paris or Madrid
- Interface Tx Util (Maximum) Between 25,45 – any interface where the maximum outbound utilization was between 25% – 45% for the reporting period
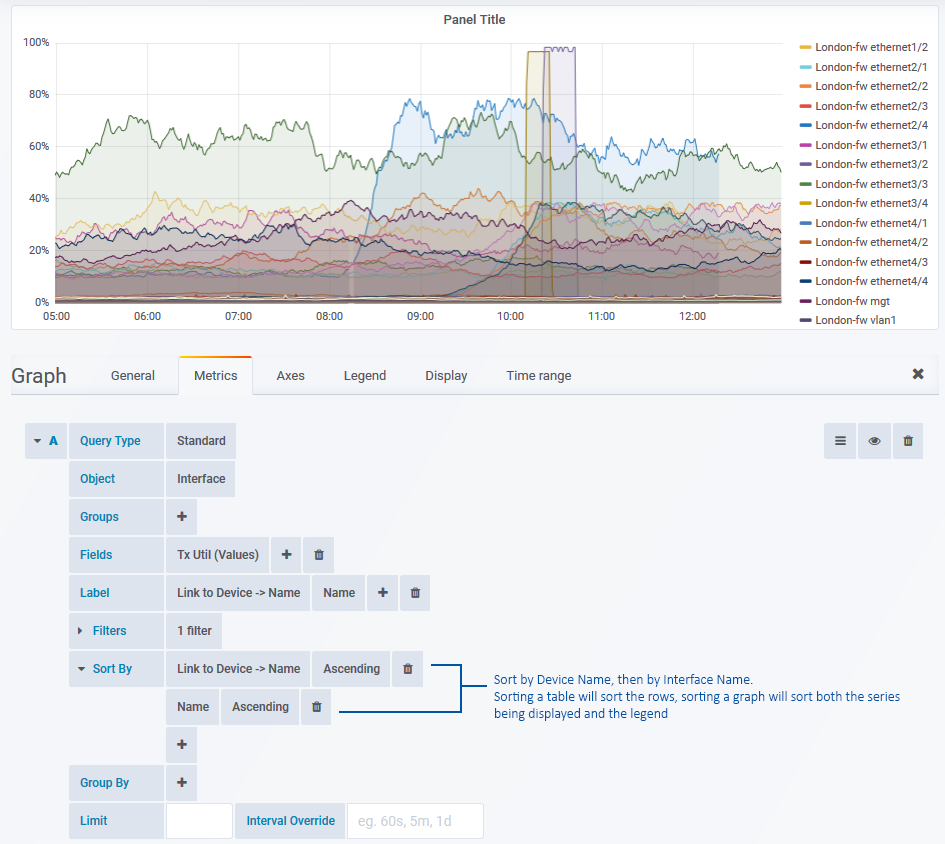
Sort By
Specify the default sorting to be applied to data within the panel. When sorting graphs, the sort is applied to the data series being displayed and is also passed through to the graph legend.
Applying a sort to a table will set the default sort, but clicking the header of any column will toggle sorting by that selection. To reset to the default sort, either manually apply that sort or reload the dashboard.
Group By
The Group By entry allows you to aggregate data by the selected field.
Selecting an event field will require you to select an entry from a range of field specific event data and format combinations. Selecting a timeseries field will require you to specify the aggregation format.
The following timeseries aggregation formats can be used:
- 95th – 95th percentile of the data
- anomaly_metric – Metric from -100 to 100 indicating whether requested timeseries values are unusually large or small
- anomaly_strength – Metric from 0 to 100 indicating whether requested timeseries values are typical or unusual
- avg – Average of the data
- count – Number of non-null data points
- cvals – Cumulative data values
- forecast_boundary_time – the time at which the forecast value exceeds feasible value range, if that point is within the specified reporting period
- forecast_daily_change – The average daily change of forecast values
- forecast_fit – An array of forecast values without periodic deviations at peak and offpeak times
- forecast_max – Upper boundary of feasible forecast value range
- forecast_min – Lower boundary of feasible forecast value range
- forecast_predict – Long term prediction value calculated from historical data
- forecast_predict_offpeak – Long term prediction value calculated from historical data at offpeak times
- forecast_predict_peak – Long term prediction value calculated from historical data at peak times
- forecast_vals – An array of forecast values with periodic deviations at peak and offpeak times
- max – Maximum data value
- median – Median of the data
- min – Minimum data value
- percentile – Custom percentile of the data
- start_time – Time of the first data point
- start_tz_offset – The timezone offset of the first data point
- stddev – Standard deviation of the data
- total – Sum of the data
- trendline_daily_change – Slope of the trendline (units/day)
- trendline_fit – Trendline data values
- trendline_lwr – Trendline confidence interval values (lower)
- trendline_predict – Prediction value from the trendline
- trendline_start – Value of the first trendline data point
- trendline_strength – Goodness of fit (R-squared) of the trendline
- trendline_upr – Trendline confidence interval values (upper)
- vals – Timeseries data values
Limit
The number of entries to return. When limiting the number of returned results it is highly recommended that you also set Sort By to ensure that the most relevant data is displayed.
Interval Override
Set to override the default polling interval for the returned data. The default polling interval for all timeseries metrics is 1 minute, and 1 day for all configuration data.
The interval should always be smaller than the panel timefilter.
Aggregation
Specify the aggregation format to use, available for Singlestat panels only. The following aggregation formats can be used:
- 95th Percentile – The 95th percentile of the values
- Average – The average of the values
- Concatenate – Concatenation of the values
- Count – The number of rows that match, and have a non-null value
- Count (include NULL) – The number of rows that match, including NULL values
- First – The first matching value
- Last – The last matching value
- List – Concatenate values as per the concatenation format, but return the output as a comma separated list of values
- Maximum – The maximum value
- Median – The median value
- Minimum – The minimum value
- Standard deviation – The standard deviation value
- Sum – The sum of all values
- Total – Similar to sum, but returns 0 instead of NULL if there are only NULL values in the data being aggregated
- Unique count – The number of non-matching, non-null rows
- Unique count (include NULL) – The number of non-matching rows
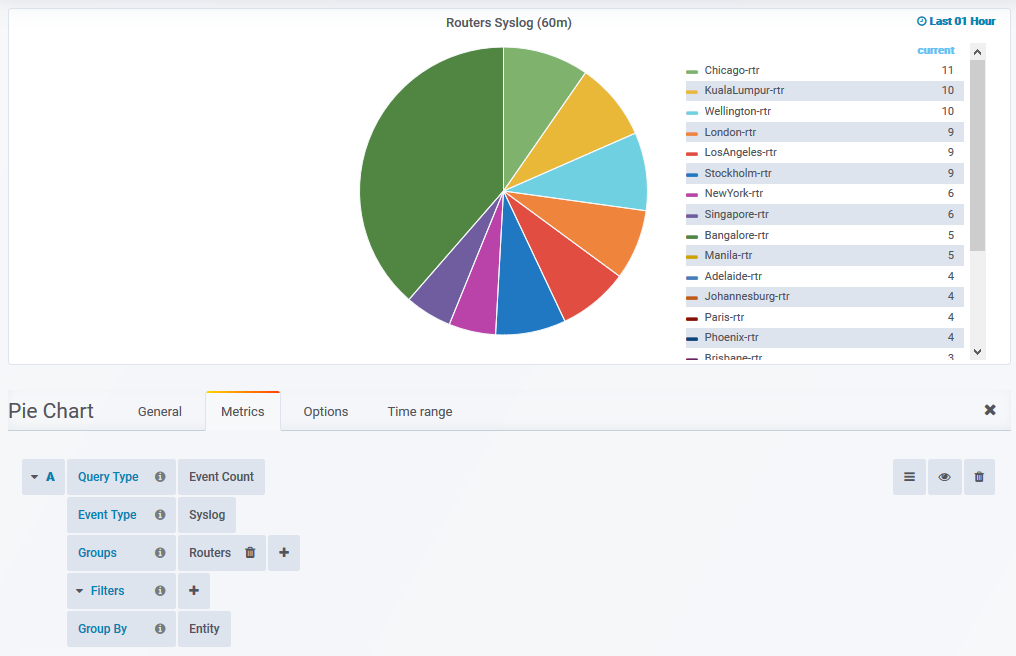
Event Count
Used to generate reports of Statseeker event data, such as syslog and SNMP trap messages, as well as device, interface and threshold events.
Event Type
The event type to display in the panel
- Event – Statseeker device (ping events) and interface (ifOperStatus and ifAdminStatus) events
- Threshold – events related to configured thresholds
- Syslog – Syslog messages that have been forwarded to Statseeker
- Trap – SNMP Trap message that have been sent to Statseeker
Thresholds
Displayed when Type = Threshold. Filter threshold records by the specified threshold/s. The list of available thresholds reflects the currently configured thresholds on your Statseeker server. Select a threshold to apply it as a filter for the panel query.
Groups
The groups option will have the same effect as selecting a group in the Console when running a report, or apply a group filter to a custom report configuration. The panel contents will be filtered by the contents of the specified group. When multiple groups are specified, the panels content is filtered by the contents of any group (group1, and/or group2, … and/or groupN).
To specify a group:
- Select the group from the list, or begin typing the name of the group to filter the list.
To remove a group:
- Click the trashcan () to remove the group
Filters
The Filters entry allows you to filter the content displayed in the panel, without filters every panel would display data from every instance of the specified Object.
Filters are configured by specifying a field, and then applying a filter, consisting of an operator and a value, to that field. Multiple filters can be applied, and only data series satisfying all filters will be returned.
The available operators are:
- Equals – enter a string to match exactly
- Not Equals – enter a string to match exactly, and then exclude
- Matches – enter a sub-string to match against
- In – requires non-timeseries field. Enter a comma separated array of values, any data series matching any one of these values will be included.
- Greater Than – requires timeseries field and format. Enter a value, any data series with the specified metric exceeding the value will be included.
- Less Than – requires timeseries field and format. Enter a value, any data series with the specified metric below the value will be included.
- Between – requires timeseries field and format. Enter two comma separated values, any data series with the specified metric between the two values will be included.
Examples
- Device Equals London-rtr – the device named ‘London-rtr’
- Event matches ping – all event records containing the string ‘ping’ in the Event field
- State equals down – all events with a State of ‘down’
- A query featuring the 3 filters listed above would return all ping-down events for the device named London-rtr
Interval
The bucket size to be used for the aggregated events data. Only available for graph (histogram) and table panels.
The interval should always be smaller than the panel timefilter.
Label
The label to display for the data series being reported. Only available for graph and pie chart panels.
Group By
The Group By entry allows you to aggregate data by the selected field. This field is only available in Pie Chart panels.
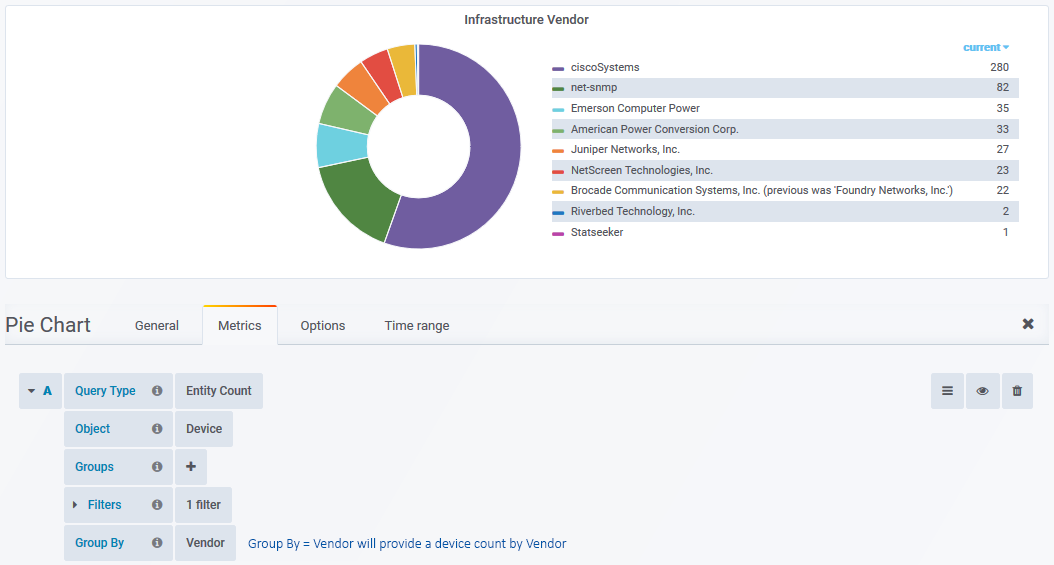
Entity Count
Used to generate counts of physical and virtual hardware such as network devices (routers, servers, switches, firewalls, etc.), interfaces on devices as well as hardware/IP related configuration data.
Object
This is the Statseeker object that the query will be returning data on. These objects are logical groupings of data representing everything that Statseeker monitors on your network, as well as the configuration entities used to manage your Statseeker environment, and include:
- Network Devices
- Interfaces on devices
- Temperature, CPU, Memory and File System entities associated with devices
- Device, interface, and threshold events
- Syslog and SNMP Trap messages
- Threshold configurations, and alerts
These objects have been categorized to allow you to easily locate and select the required object by navigating the object tree, or alternatively you can filter the object tree by typing the name of the object you are looking for.
Groups
The groups option will have the same effect as selecting a group in the Console when running a report, or apply a group filter to a custom report configuration. The panel contents will be filtered by the contents of the specified group. When multiple groups are specified, the panels content is filtered by the contents of any group (group1, and/or group2, … and/or groupN).
To specify a group:
- Select the group from the list, or begin typing the name of the group to filter the list.
To remove a group:
- Click the trashcan () to remove the group
Filters
The Filters entry allows you to filter the content displayed in the panel, without filters every panel would display data from every instance of the specified Object.
Filters are configured by specifying a field, and then applying a filter, consisting of an operator and a value, to that field. Multiple filters can be applied, and only data series satisfying all filters will be returned.
The available operators are:
- Equals – enter a string to match exactly
- Not Equals – enter a string to match exactly, and then exclude
- Matches – enter a sub-string to match against
- In – requires non-timeseries field. Enter a comma separated array of values, any data series matching any one of these values will be included.
- Greater Than – requires timeseries field and format. Enter a value, any data series with the specified metric exceeding the value will be included.
- Less Than – requires timeseries field and format. Enter a value, any data series with the specified metric below the value will be included.
- Between – requires timeseries field and format. Enter two comma separated values, any data series with the specified metric between the two values will be included.
Examples
- Device Name Equals London-rtr – the entity named ‘London-rtr’
- Device IP Matches 10.100.59 – any device with an IP in the 10.100.59.0/24 subnet
- Interface Tx Util (Avg) Greater Than 40 – interfaces with an average outbound utilization of greater than 40% over the reporting period
- Device Location In London,Paris,Madrid – any device where the Location is set to any of London, Paris or Madrid
- Interface Tx Util (Maximum) Between 25,45 – any interface where the maximum outbound utilization was between 25% – 45% for the reporting period
Group By
The Group By entry allows you to aggregate data by the selected field. This field is available for Table and Pie Chart panels.
Selecting an event field will require you to select an entry from a range of field specific event data and format combinations. Selecting a timeseries field will require you to specify the aggregation format.
The following timeseries aggregation formats can be used:
- 95th – 95th percentile of the data
- anomaly_metric – Metric from -100 to 100 indicating whether requested timeseries values are unusually large or small
- anomaly_strength – Metric from 0 to 100 indicating whether requested timeseries values are typical or unusual
- avg – Average of the data
- count – Number of non-null data points
- cvals – Cumulative data values
- forecast_boundary_time – the time at which the forecast value exceeds feasible value range, if that point is within the specified reporting period
- forecast_daily_change – The average daily change of forecast values
- forecast_fit – An array of forecast values without periodic deviations at peak and offpeak times
- forecast_max – Upper boundary of feasible forecast value range
- forecast_min – Lower boundary of feasible forecast value range
- forecast_predict – Long term prediction value calculated from historical data
- forecast_predict_offpeak – Long term prediction value calculated from historical data at offpeak times
- forecast_predict_peak – Long term prediction value calculated from historical data at peak times
- forecast_vals – An array of forecast values with periodic deviations at peak and offpeak times
- max – Maximum data value
- median – Median of the data
- min – Minimum data value
- percentile – Custom percentile of the data
- start_time – Time of the first data point
- start_tz_offset – The timezone offset of the first data point
- stddev – Standard deviation of the data
- total – Sum of the data
- trendline_daily_change – Slope of the trendline (units/day)
- trendline_fit – Trendline data values
- trendline_lwr – Trendline confidence interval values (lower)
- trendline_predict – Prediction value from the trendline
- trendline_start – Value of the first trendline data point
- trendline_strength – Goodness of fit (R-squared) of the trendline
- trendline_upr – Trendline confidence interval values (upper)
- vals – Timeseries data values
Value by Location
Display timeseries metric values aggregated across all devices in the same geographical location. This query type:
- Is only available in the Worldmap panel
- Requires that latitude and longitude data has been provided for network devices
Object
This is the Statseeker object that the query will be returning data on. These objects are logical groupings of data representing everything that Statseeker monitors on your network, as well as the configuration entities used to manage that your Statseeker environment, and include:
- Network Devices
- Interfaces on devices
- Temperature, CPU, Memory and File System entities associated with devices
- Device, interface, and threshold events
- Syslog and SNMP Trap messages
- Threshold configurations, and alerts
These objects have been categorized to allow you to easily locate and select the required object by navigating the object tree, or alternatively you can filter the object tree by typing the name of the object you are looking for.
Groups
The groups option will have the same effect as selecting a group in the Console when running a report, or apply a group filter to a custom report configuration. The panel contents will be filtered by the contents of the specified group. When multiple groups are specified, the panels content is filtered by the contents of any group (group1, and/or group2, … and/or groupN).
To specify a group:
- Select the group from the list, or begin typing the name of the group to filter the list.
To remove a group:
- Click the trashcan () to remove the group
Field
The field entry is used to specify the field that is to be displayed in the panel, only a single field can be included in the query. The list of available fields is determined by the selected Object and includes all fields associated with that object as well as any linked object.
Linked objects are typically the parent object, all interfaces, CPU’s, Memory and FileSystems reside on a ‘device’, so all fields pertaining to that device are also available when configuring the query.
The available fields contain either configuration or timeseries data. When selecting a timeseries data field you are also required to specify a data format:
- 95th percentile – 95th percentile of the data
- Anomaly metric – Metric from -100 to 100 indicating whether requested timeseries values are unusually large or small
- Anomaly strength – Metric from 0 to 100 indicating whether requested timeseries values are typical or unusual
- Average – Average of the data
- Count – Number of non-null data points
- Cumulative Values – Cumulative data values
- Forecast boundary time – Time forecast exceeds feasible value range if before end of timefilter range
- Forecast daily change – The average daily change of forecast values
- Forecast fit – An array of forecast values without periodic deviations at peak and offpeak times
- Forecast maximum – Upper boundary of feasible forecast value range
- Forecast minimum – Lower boundary of feasible forecast value range
- Forecast values – An array of forecast values with periodic deviations at peak and offpeak times
- Maximum – Maximum data value
- Median – Median of the data
- Minimum – Minimum data value
- Standard deviation – Standard deviation of the data
- Start time – Time of the first data point
- Start TZ offset – The timezone offset of the first data point
- Total – Sum of the data
- Trendline daily change – Slope of the trendline (units/day)
- Trendline fit – Trendline data values
- Trendline lower confidence interval – Lower boundary for Trendline confidence
- Trendline Start – Value of the first trendline data point
- Trendline strength – Goodness of fit (R-squared) of the trendline
- Trendline upper confidence interval – Upper boundary for Trendline confidence
- Values – Timeseries data values (individual data points, use for plotting graphs)
To specify a field:
- Select the field from the list, or begin typing the name of the field to filter the list.
Filters
The Filters entry allows you to filter the content displayed in the panel, without filters every panel would display data from every instance of the specified Object.
Filters are configured by specifying a field, and then applying a filter, consisting of an operator and a value, to that field. Multiple filters can be applied, and only data series satisfying all filters will be returned.
The available operators are:
- Equals – enter a string to match exactly
- Not Equals – enter a string to match exactly, and then exclude
- Matches – enter a sub-string to match against
- In – requires non-timeseries field. Enter a comma separated array of values, any data series matching any one of these values will be included.
- Greater Than – requires timeseries field and format. Enter a value, any data series with the specified metric exceeding the value will be included.
- Less Than – requires timeseries field and format. Enter a value, any data series with the specified metric below the value will be included.
- Between – requires timeseries field and format. Enter two comma separated values, any data series with the specified metric between the two values will be included.
Examples
- Interface Tx Util (Avg) Greater Than 40 – interfaces with an average outbound utilization of greater than 40% over the reporting period
- Device Location In London,Paris,Madrid – any device where the Location is set to any of London, Paris or Madrid
- Interface Tx Util (Maximum) Between 25,45 – any interface where the maximum outbound utilization was between 25% – 45% for the reporting period
Sort By
Specify the default sorting to be applied to data within the panel. When sorting graphs, the sort is applied to the data series being displayed and is also passed through to the graph legend.
Aggregation
Specify the aggregation format to use:
- 95th Percentile – The 95th percentile of the values
- Average – The average of the values
- Concatenate – Concatenation of the values
- Count – The number of rows that match, and have a non-null value
- Count (include NULL) – The number of rows that match, including NULL values
- First – The first matching value
- Last – The last matching value
- List – Concatenate values as per the concatenation format, but return the output as a comma separated list of values
- Maximum – The maximum value
- Median – The median value
- Minimum – The minimum value
- Standard deviation – The standard deviation value
- Sum – The sum of all values
- Total – Similar to sum, but returns 0 instead of NULL if there are only NULL values in the data being aggregated
- Unique count – The number of non-matching, non-null rows
- Unique count (include NULL) – The number of non-matching rows
Limit
The number of entries to return.
Interval Override
Set to override the default polling interval for the returned data. The default polling interval for all timeseries metrics is 1 minute, and 1 day for all configuration data.
The interval should always be smaller than the panel timefilter.
Count by Location
Display Statseeker object (monitored devices, events and messages linked to devices, etc.) counts by geographical location. This query type:
- Is only available in the Worldmap panel
- Requires that latitude and longitude data has been provided for network devices
Object
This is the Statseeker object that the query will be returning data on. These objects are logical groupings of data representing everything that Statseeker monitors on your network, as well as the configuration entities used to manage that your Statseeker environment, and include:
- Network Devices
- Interfaces on devices
- Temperature, CPU, Memory and File System entities associated with devices
- Device, interface, and threshold events
- Syslog and SNMP Trap messages
- Threshold configurations, and alerts
These objects have been categorized to allow you to easily locate and select the required object by navigating the object tree, or alternatively you can filter the object tree by typing the name of the object you are looking for.
Groups
The groups option will have the same effect as selecting a group in the Console when running a report, or apply a group filter to a custom report configuration. The panel contents will be filtered by the contents of the specified group. When multiple groups are specified, the panels content is filtered by the contents of any group (group1, and/or group2, … and/or groupN).
To specify a group:
- Select the group from the list, or begin typing the name of the group to filter the list.
To remove a group:
- Click the trashcan () to remove the group
Filters
The Filters entry allows you to filter the content displayed in the panel, without filters every panel would display data from every instance of the specified Object.
Filters are configured by specifying a field, and then applying a filter, consisting of an operator and a value, to that field. Multiple filters can be applied, and only data series satisfying all filters will be returned.
The available operators are:
- Equals – enter a string to match exactly
- Not Equals – enter a string to match exactly, and then exclude
- Matches – enter a sub-string to match against
- In – requires non-timeseries field. Enter a comma separated array of values, any data series matching any one of these values will be included.
- Greater Than – requires timeseries field and format. Enter a value, any data series with the specified metric exceeding the value will be included.
- Less Than – requires timeseries field and format. Enter a value, any data series with the specified metric below the value will be included.
- Between – requires timeseries field and format. Enter two comma separated values, any data series with the specified metric between the two values will be included.
Examples
- Interface Tx Util (Avg) Greater Than 40 – interfaces with an average outbound utilization of greater than 40% over the reporting period
- Device Location In London,Paris,Madrid – any device where the Location is set to any of London, Paris or Madrid
- Interface Tx Util (Maximum) Between 25,45 – any interface where the maximum outbound utilization was between 25% – 45% for the reporting period
Multiple Queries
Multiple Queries can be applied to a single panel allowing for data from multiple objects, or more typically, the same object with different filters applied. Queries can be added, duplicated and deleted as needed to suit your requirements.
An example of using multiple queries can be seen in the Device Count by Latency pie-chart used in the default Network Summary dashboard. We can see that an initial query was configured to return a count of all devices with an average ping less than 50ms.
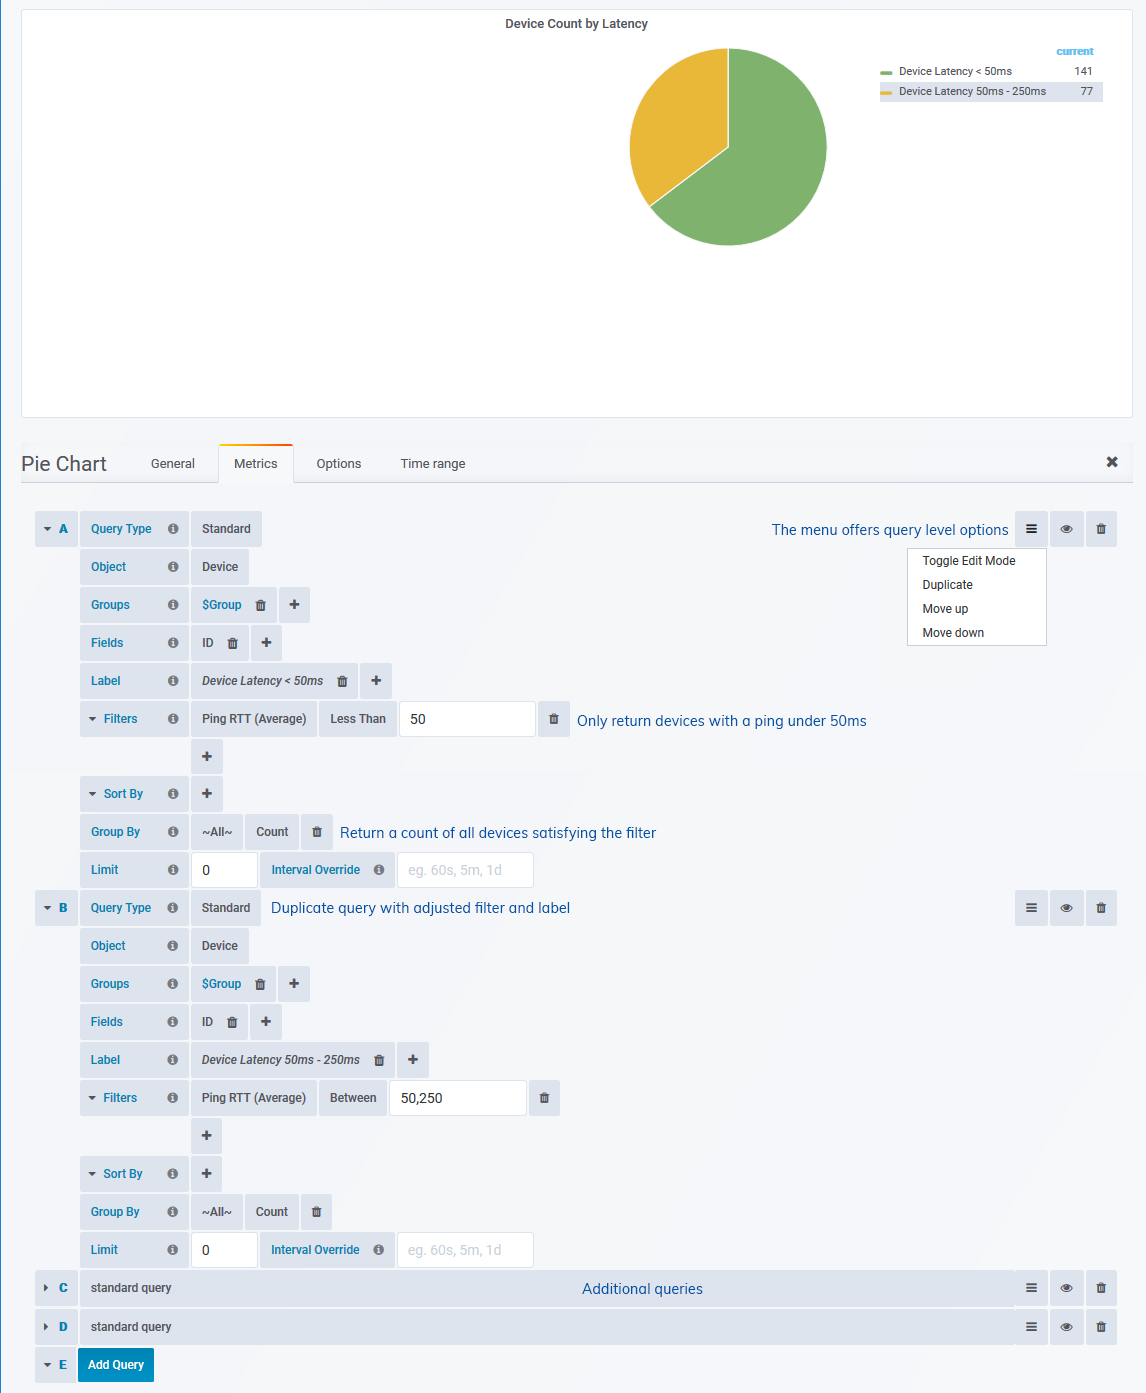
This query was then duplicated, and the filter changed to produce additional queries returning counts of devices with average ping times in various ranges (0ms-50ms, 50ms-250ms, 250ms-500ms, >500ms). The network being monitored in the example above does not contain a device reporting an average ping greater than 250ms, so only two of the ranges are displayed in the panel.
Multiple queries are available for graph, table and pie-chart panels.