Release Date: 15-September-2020
- Major Features
- System and Administration
- Reporting
- Dashboards
- Thresholds & Alerting
- API
- Upgrade Paths
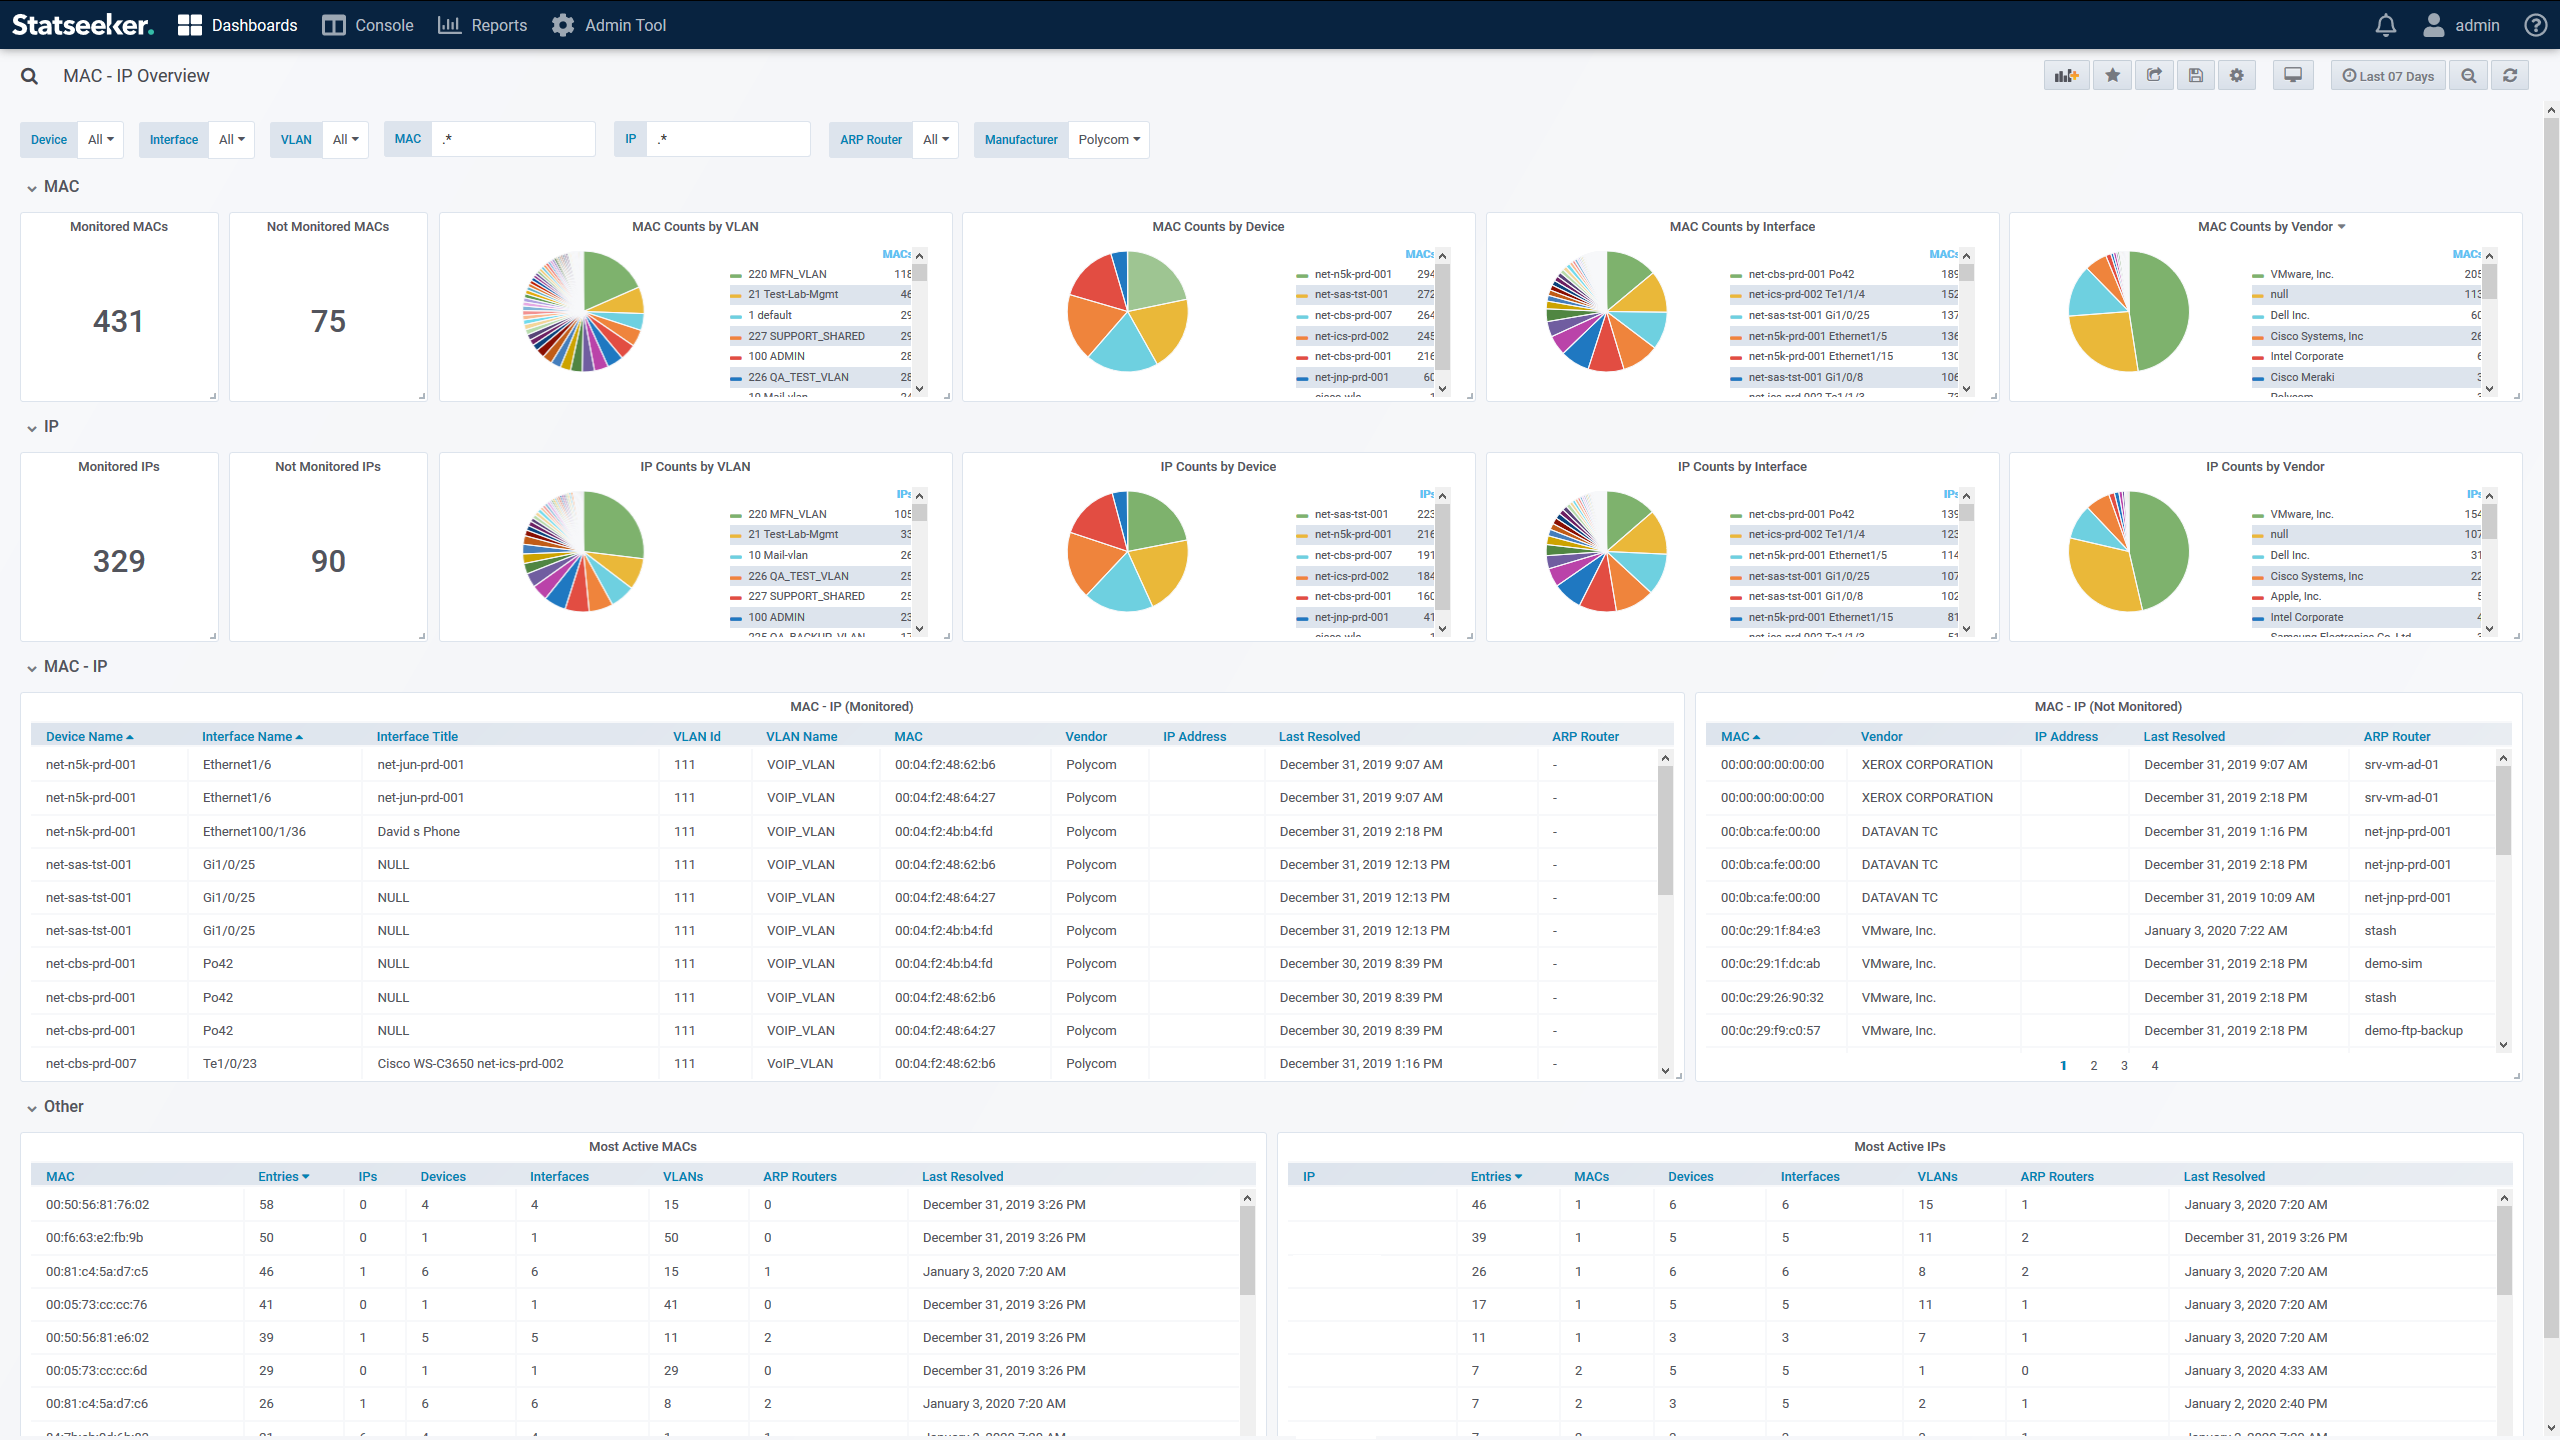
New MAC - IP Default Dashboard
We have added a new MAC-IP dashboard to the Default Dashboards folder. This dashboard offers an overview of the network’s MAC/IP/Switchport configuration with breakdowns by VLAN, device, interface, and ARP Router.

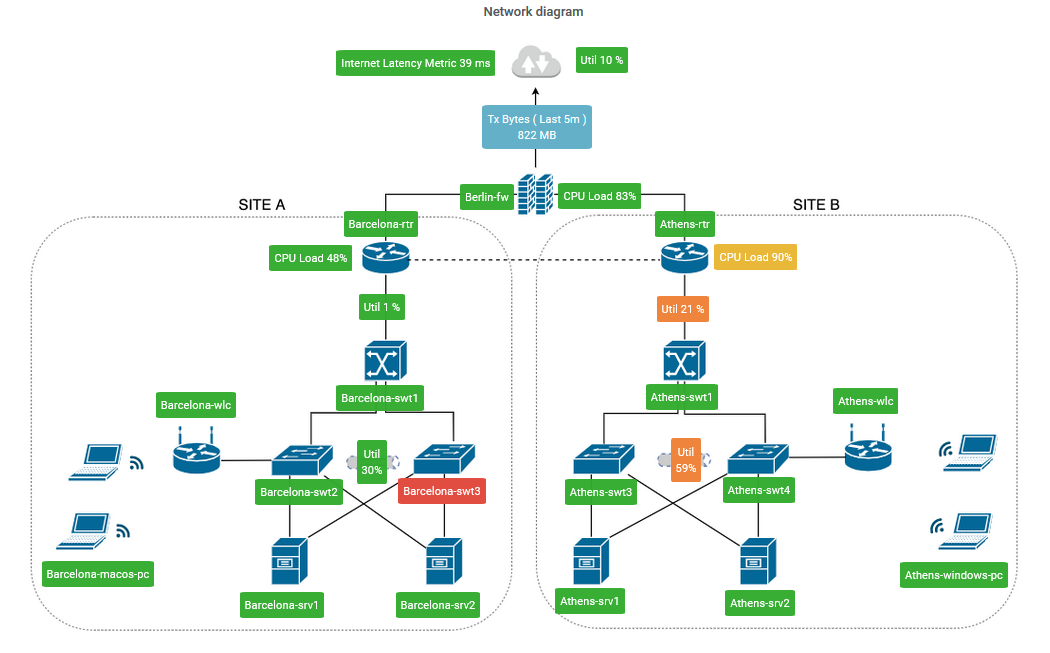
Image Map Dashboard Panel
Added a new Image Map dashboard panel type, this panel allows you to place nodes over a custom background image, and have those nodes display configuration, state or timeseries data. See Dashboard Image Map Panel for details and example configurations.

Report Replacement
The following reports have been replaced with new versions. Any existing custom links from dashboards/custom reports will still access the old report but should be updated to point to the new report.
- Ping Current Status
- Ping Current Unavailable
- Ping Top Delay (ms) Graphs
- Ping Statistics
- Interface Current Unavailable
The following reports have been replaced with new versions. Any existing custom links from dashboards/custom reports will no longer work and should be updated to point to the new report.
- Syslog Report
- SNMP Traps Report
In-Report Filtering Options
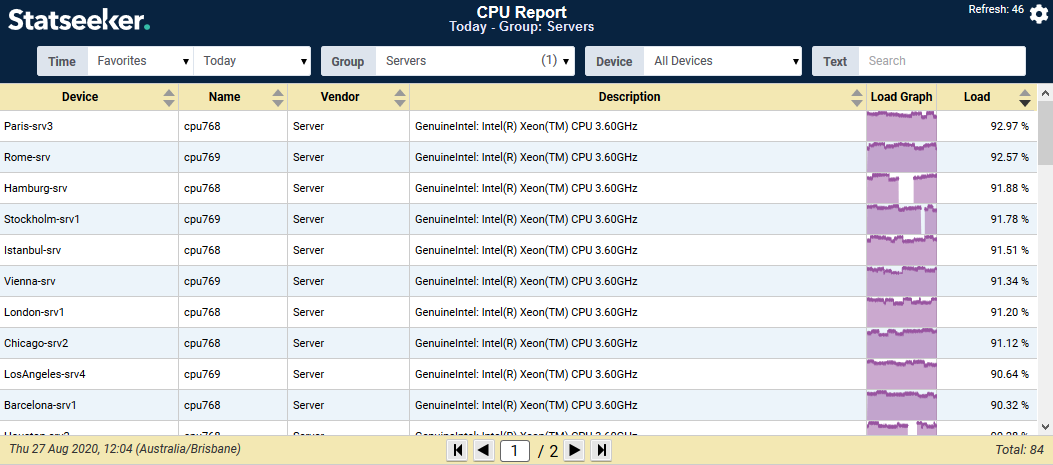
Custom reports now feature in-report Group, Device and Text/RegEx filtering options, see In-Report Filters for details.

Product Changes
- OS updated to FreeBSD 11.4-RELEASE-p3, for details see the FreeBSD website
- Added support for configuring local server for IPv6
- Added support for monitoring devices over IPv6 network
- Added SFTP support for backup and restoration processes
- Added CDT packages to the default install providing additional reporting options for:
- VPN session and connection details for Cisco, F5, Juniper, Palo Alto and SonicWall
- WAN details for Cisco WAAS, Cisco AppNav, and Riverbed
- Added an option to the Admin Tool to purge existing MAC-IP data
- 'Statseeker Classic' license tier renamed to 'Statseeker Core'
- FTP and Telnet connection to the Statseeker server are disabled by default
- Added options when uninstalling SCS packages to also remove associated reports and entity records
- Removed the 'Standard Console' display option
- Added the ability to override the default port used for SNMP polling of an entity
- Statseeker Classic/Core tier licenses now allow custom data polling
Resolved Issues
- Resolved an issue where very large event databases can cause the diagnostic report to fail
- Resolved an issue allowing the TRACE command to be run on Statseeker's Apache server
- Resolved an issue that could prevent device deletion from completing cleanly
- Fixed an issue preventing the collection of timeseries data due to the ID of the parent entity being lost
- Database pruning processes no longer lock the Events database
- Resolved an issue that could prevent clean database deletion during the upgrade process
- Resolved an issue which could produce excessively large Write-Ahead-Logging files on very large networks
- Clicking a link in the Admin Tool menu no longer clears the content of the search field
- Fixed an issue causing requests to the timeseries cache to load the incorrect range in specific circumstances
- Retired devices are now excluded from processes updating IP addresses
- Resolved an issue that could cause the incorrect License expiry to be displayed after upgrade
- Stale MAC/IP entries are now cleaned up correctly regardless of the cleanup process interval
- Fixed an issue that could cause High-Availability failovers on very large networks to trigger device down events
- Resolved a dashboard issue preventing the title of the first repeated row from updating correctly
Product Changes
- Custom graph reports can now display a custom sub-title for each graph presented in the report, see Custom Reports > Graph Section > Graph Title for details
- Added a 'search' feature to the report list in the Reporting editor
- Added the ‘current’ data format for use within reporting
- Added an option to repair custom report lists to the Admin Tool
- Added an alternate, user-specific, row spacing option offering a more compact view for tabular reports, see Editing Users and Updating Preferences
- Improved the performance when exporting reports to pdf
Resolved Issues
- Fixed a memory leak when editing custom graph reports
- Fixed an issue preventing Threshold report drilldowns from returning data
- Resolved an issue preventing Scheduled reports from running after first run
- Scheduled reports now use report specific page size/orientation settings where provided
- Resolved an issue preventing the correct interval being used when returning to the 'Original Query' option in the report filters
- Fixed an issue preventing exported reports from using the timefilter in use at the time of export
- Fixed an issue with sorting by column header on the Device Details report
- Fixed an issue that could result in incorrect ping states being displayed after upgrade
- Resolved an issue preventing scheduled reports, that include Custom reports, from being sent
Product Changes
- World Map dashboard panels now offer expanded node-coloring options for maps featuring multiple queries, see Multi-Query Map for an example configuration
- Added the ‘current’ data format for use within dashboards
- Updated the Default Dashboards to utilize new product capabilities and add contextual information
- Added 'weekday' and 'time of day' filters to Dashboard timefilter options, see Dashboard Time Filters for details
- Added the ability to specify the date format displayed on dashboard graphs, see Graph Panel: Axes for more information
Resolved Issues
- Updated incorrect filters in some Default Dashboard panels
- Filtering dashboard content by a nonexistent event state no longer returns all event records
- Fixed an issue that prevented dashboard histograms from interpreting 'interval' correctly
- Singlestat panels no longer present '0' as 'N/A' by default
- Dashboard panels now use the correct default aggregation format for time fields
Product Changes
- Threshold configurations can now be disabled but retained
Resolved Issues
- Repeatedly clicking the Alert configuration Save button no longer creates multiple alerts
- Fixed a bug preventing thresholds featuring group filters from triggering in some instances
- Fixed a bug preventing some thresholds from upgrading correctly
Product Changes
- Added the ability to create custom links between resources - see Linked Resources: Custom Links for details
- The '/describe' endpoint response now includes details on all known links
- Added the ability to specify a custom field and have it populated with the result of formulae applied to other fields within the query - see Field Formulas for details
- New API Resources:
Details on all API resource level endpoints can be found in the Resource Reference.
- cdt_cpu_juniper_pulse
- cdt_dell_inventory
- cdt_fan_sensor
- cdt_fan_sensor_cisco
- cdt_fan_sensor_entity
- cdt_ip_address
- cdt_juniper_pulse_vpn_users
- cdt_optical_sensor_cisco
- cdt_other_sensor
- cdt_other_sensor_cisco
- cdt_other_sensor_entity
- cdt_palo_alto_vpn
- cdt_poe_main
- cdt_poe_main_cisco
- cdt_poe_port
- cdt_poe_port_cisco
- cdt_power_amps_sensor
- cdt_power_amps_sensor_cisco
- cdt_power_amps_sensor_entity
- cdt_power_volts_sensor
- cdt_power_volts_sensor_cisco
- cdt_power_volts_sensor_entity
- cdt_power_watts_sensor
- cdt_power_watts_sensor_cisco
- cdt_power_watts_sensor_entity
- cdt_sonicwall_vpn_users
- cdt_temperature_sensor
- cdt_temperature_sensor_cisco
- link
API v2.1 r11: Modified API Resources
- cdt_f5_loadbalance renamed to cdt_f5_loadbalancer_ltm_pool
- New fields: activeMembers, availState
- cdt_f5_loadbalance_member renamed to cdt_f5_loadbalancer_ltm_pool_member
- New fields: availState, enabledState, ipaddress, nodeName, portNumber
- cdt_f5_loadbalance_virtual renamed to cdt_f5_loadbalancer_ltm_virtual_server
- New fields: availState, defaultPool, enabledState, ipNetmask, ipProtocol, ipaddress, portNumber
- Removed fields: virtualServName
- cdt_f5_firewall_connections renamed to cdt_f5_loadbalancer_ltm_virtual_server
- New fields: clientSSLAvgConns, clientSSLCurConns
- cdt_cisco_vpn_sessions
- New fields: maxSvcSessions
- cdt_device
- New fields: ping_rtt_ms
- cdt_device_apic
- New fields: ping_rtt_ms
- cdt_mis
- ip field type changed from 'ipv4' to 'string'
- user
- New fields: reportRowSpacing
Resolved Issues
- API now uses RxBytes to calculate if90days
- cdt_port - packet fields now specify the correct unit
- Resolved an issue that would apply query response limits prior to global filters in some instances
- When sending multi-object requests, the API now returns an error if one object fails validation while others pass
