** Legacy Documentation for Statseeker v5.5.1 **
Index
Overview
As offices transition to a more ‘remote worker’ environment, greater emphasis is placed on the VPN side of your network. This article will look at monitoring and reporting on VPN connections into your network, as well as configuring thresholds and alerts against your VPN capacity. In addition, we will look at pulling this data into your Statseeker dashboards.
The ability to monitor VPN session data is initially provided to Statseeker users via Custom Data Packages (CDT’s), and these CDT’s are periodically rolled into the default Statseeker installation. In response to the COVID-19 issue Statseeker has expanded the default VPN sessions monitoring functionality with an updated VPN Monitoring Bundle containing expanded reporting, alerting and dashboarding options for Cisco, F5, Palo Alto and Juniper Pulse.
To acquire the latest Statseeker VPN Monitoring Bundle, please contact either:
For details on installing this CDT package, see Custom Data Types.
Reporting
A standard Statseeker installation comes with a range of vendor specific VPN reports for Cisco VPN sessions. The scope of these reports has been expanded with the new VPN Sessions package, these new reports provide current values and data history for VPN Session details including:
- Users and user groups
- Remote access sessions
- Email proxy sessions
- Secure VPN client sessions
- WebVPN client sessions
- LAN to LAN sessions
- IPSec sessions
- Load Balancer sessions
- Terminated sessions
- Number of remote access users, groups and sessions supported by the device
This data is provided via a number of linked reports:
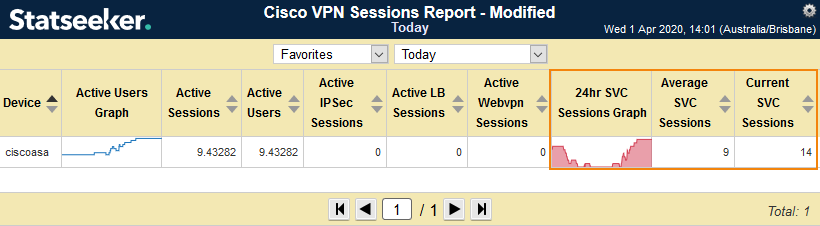
- Cisco VPN Sessions Report
- Cisco VPN Sessions SVC Sessions Graphs
- Cisco VPN Sessions Email Graphs
- Cisco VPN Sessions Graphs
- Cisco VPN Sessions IPSec Graphs
- Cisco VPN Sessions LAN to LAN Graphs
- Cisco VPN Sessions Load Balancing Graphs
- Cisco VPN Sessions User Graphs
- Cisco VPN Sessions User Group Graphs
- Cisco VPN Sessions Webvpn Graphs
- Cisco VPN IPSec Active Tunnels Graphs
- Cisco VPN IPSec Global Bytes Graphs
- Cisco VPN IPSec Global Packets Graphs
- Cisco VPN IPSec Global Report
- Cisco VPN IPSec Tunnels Bytes Graphs
- Cisco VPN IPSec Tunnels Packets Graphs
- Cisco VPN IPSec Tunnels Report
By default, these reports will target all monitored Cisco devices which are providing VPN data, but you can filter the report to a specific device or group of devices by selecting those entities (devices and/or groups) in the Console prior to running the report.
- F5 APM Sessions
- F5 APM Sessions Graphs
- Juniper Pulse VPN Graph
- Juniper Pulse VPN Report
- Palo Alto VPN Graph
- Palo Alto VPN Report
- SonicWall VPN Users Graph
- SonicWall VPN Users Report
Report Time Range
Reports default to any timefilter that has been specified within the report configuration, if there is not timefilter specified, then the report will fallback to the timefilter specified in the Console when the report is run.
Statseeker v5.5+ vs Older Versions
Statseeker v5.5 introduced the in-report Time Selector, allowing you to alter the reporting period while viewing the report (see Custom Reporting: Time Selector for more details). The VPN reports available through older versions of Statseeker do not feature this functionality, instead the report timefilter is static and must be specified in the NIM console prior to running the report, just like the device and group filters.
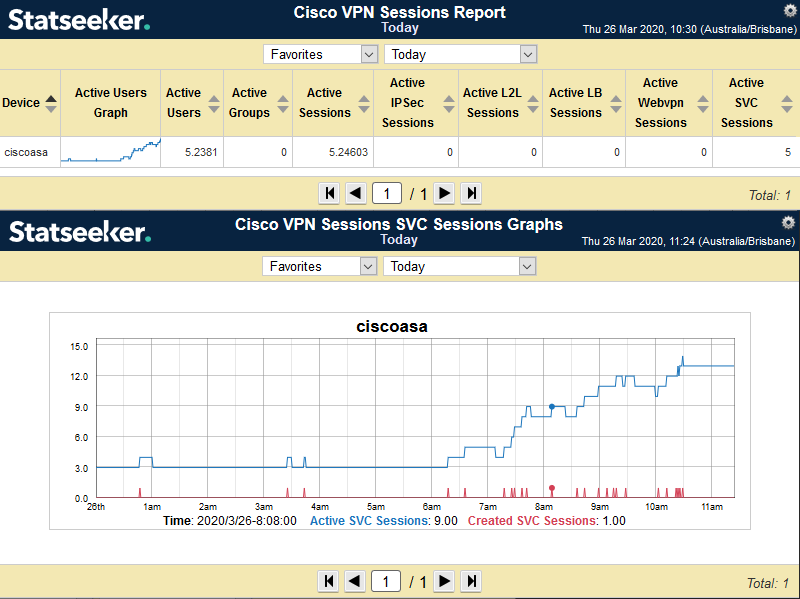
How do I see current values?
Statseeker v5.5+
Use the time selector within the report to select Favorites > Last 05 Minutes.
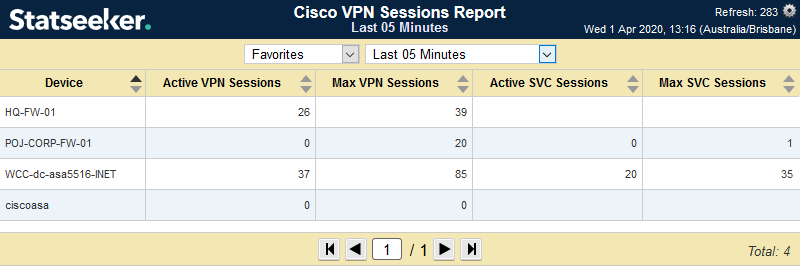
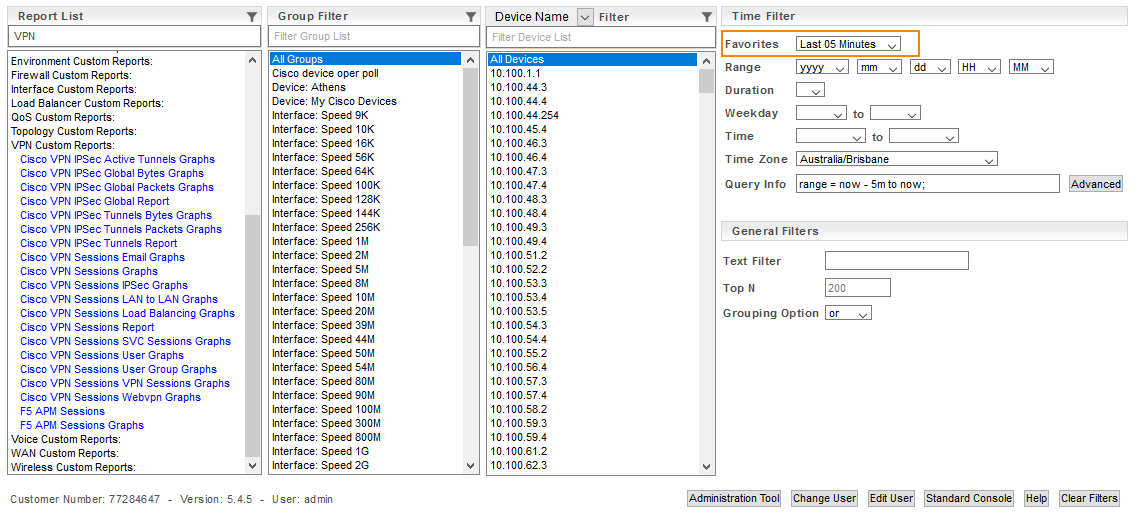
Statseeker v5.4.5 and earlier
Specify the Last 05 Minutes in the NIM Console timefilter prior to running the report.
Customizing the Default Reports
Any VPN Sessions reports can be expanded or customized via Statseeker’s Custom Reporting. A quick (2min) video running through the process to show some of the options available can be seen here.
When building tabular reports, you are able to specify a column-specific timefilter. This will allow you to build a report containing both average values (for the reporting period as specified by the report timefilter) and another column presenting the current value for the same metric. For a short (2min) video running through the process see: Column Specific Timefilters.
Thresholds and Alerting
Statseeker alerts can be triggered by, syslog and SNMP trap messages, device and interface events, and thresholds that have been configured against timeseries data. When configuring alerts for your VPN infrastructure you may want to consider:
- Ping down alerts for the hardware itself – if needed, apply group/device filters for tailored alert content specific for these devices. You also want to consider employing Upstream Device Configuration to better manage ping down alerting.
- Thresholding on aggregated CPU load for critical hardware – setting Device Aggregation Format = Average in the threshold configuration will threshold against the average load across all CPU on the device, avoiding false alerts arising from ‘spikey’ load behavior on a single CPU
- Configuring thresholds against the number of active connections (VPN/SVC/IPSec, etc.) or total traffic across the device- if the capacity of individual devices varies, then setup specific thresholds, filtered by groups or devices, to suit. A single alert configuration, using the Email (Advanced) template, can be triggered from any number of thresholds variations. An event satisfying any of the configured triggers, will produce the alert.
For details on threshold and alert configuration options, as we as general example configations, see:
Dashboards
While Statseeker installs come with some default dashboards, Statseeker periodically provides additional themed, or technology specific, v5.5+ dashboards. These dashboards can be downloaded from the Dashboard Library. These additional dashboards are free to use and, unlike the default dashboards, are able to be edited or customized to suit your requirements.
Our intention is that these dashboards provide a starting point for you to tailor to your environment – edit or remove elements that do not apply, and expand upon those aspects that are critical to your network.
Statseeker does not produce or distribute dashboards for Statseeker v5.4.5 or earlier, to upgrade your server please contact:
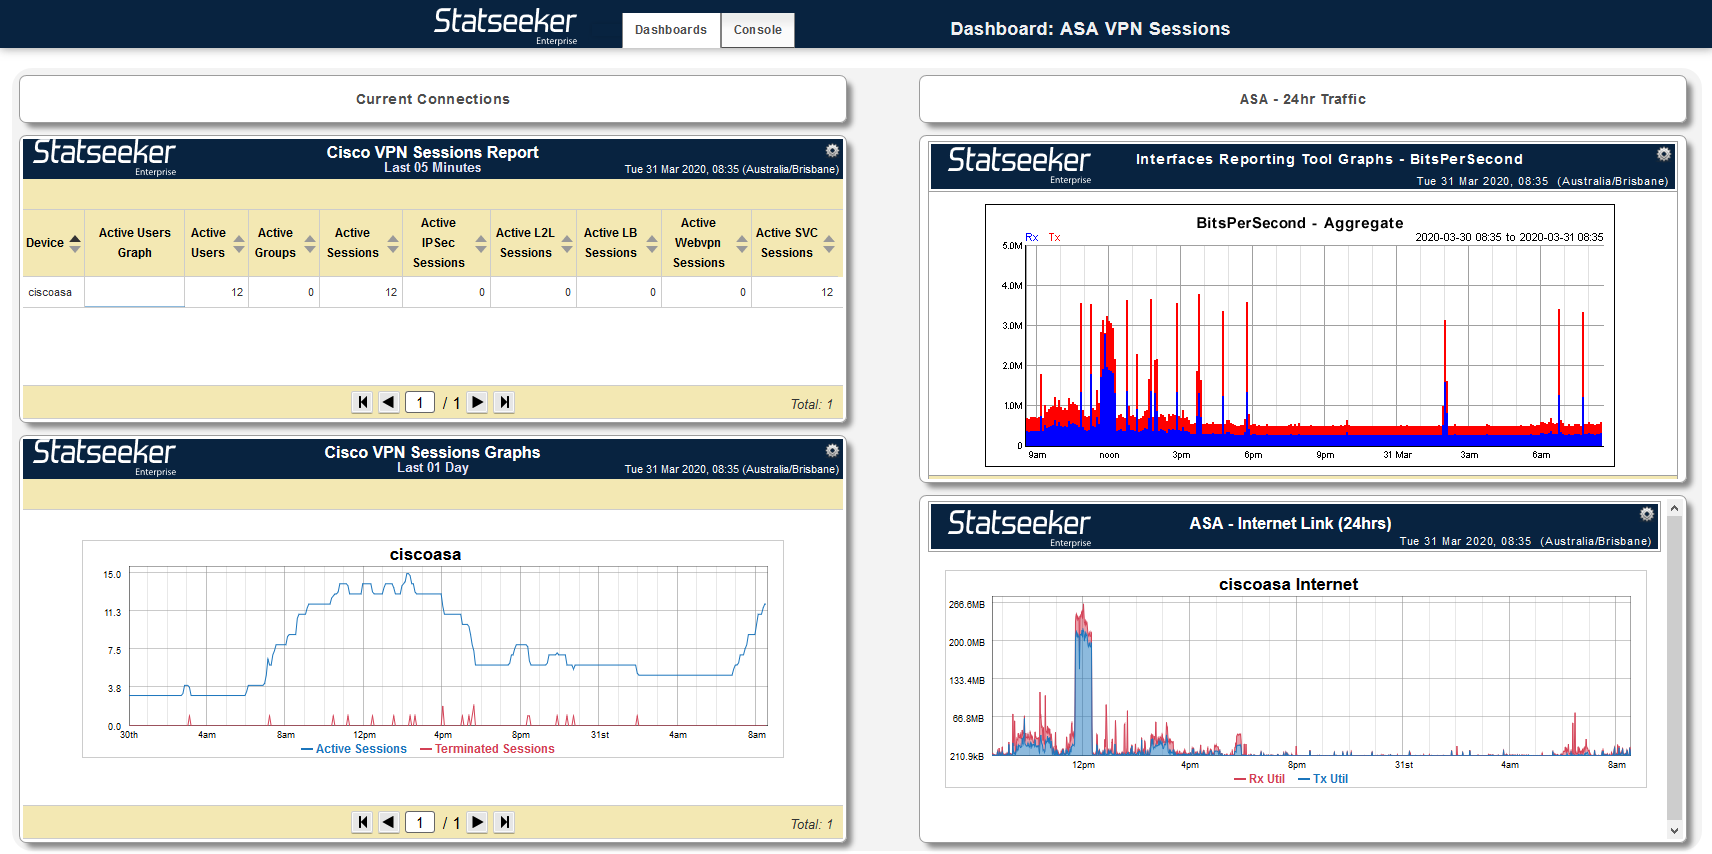
Statseeker v5.5+
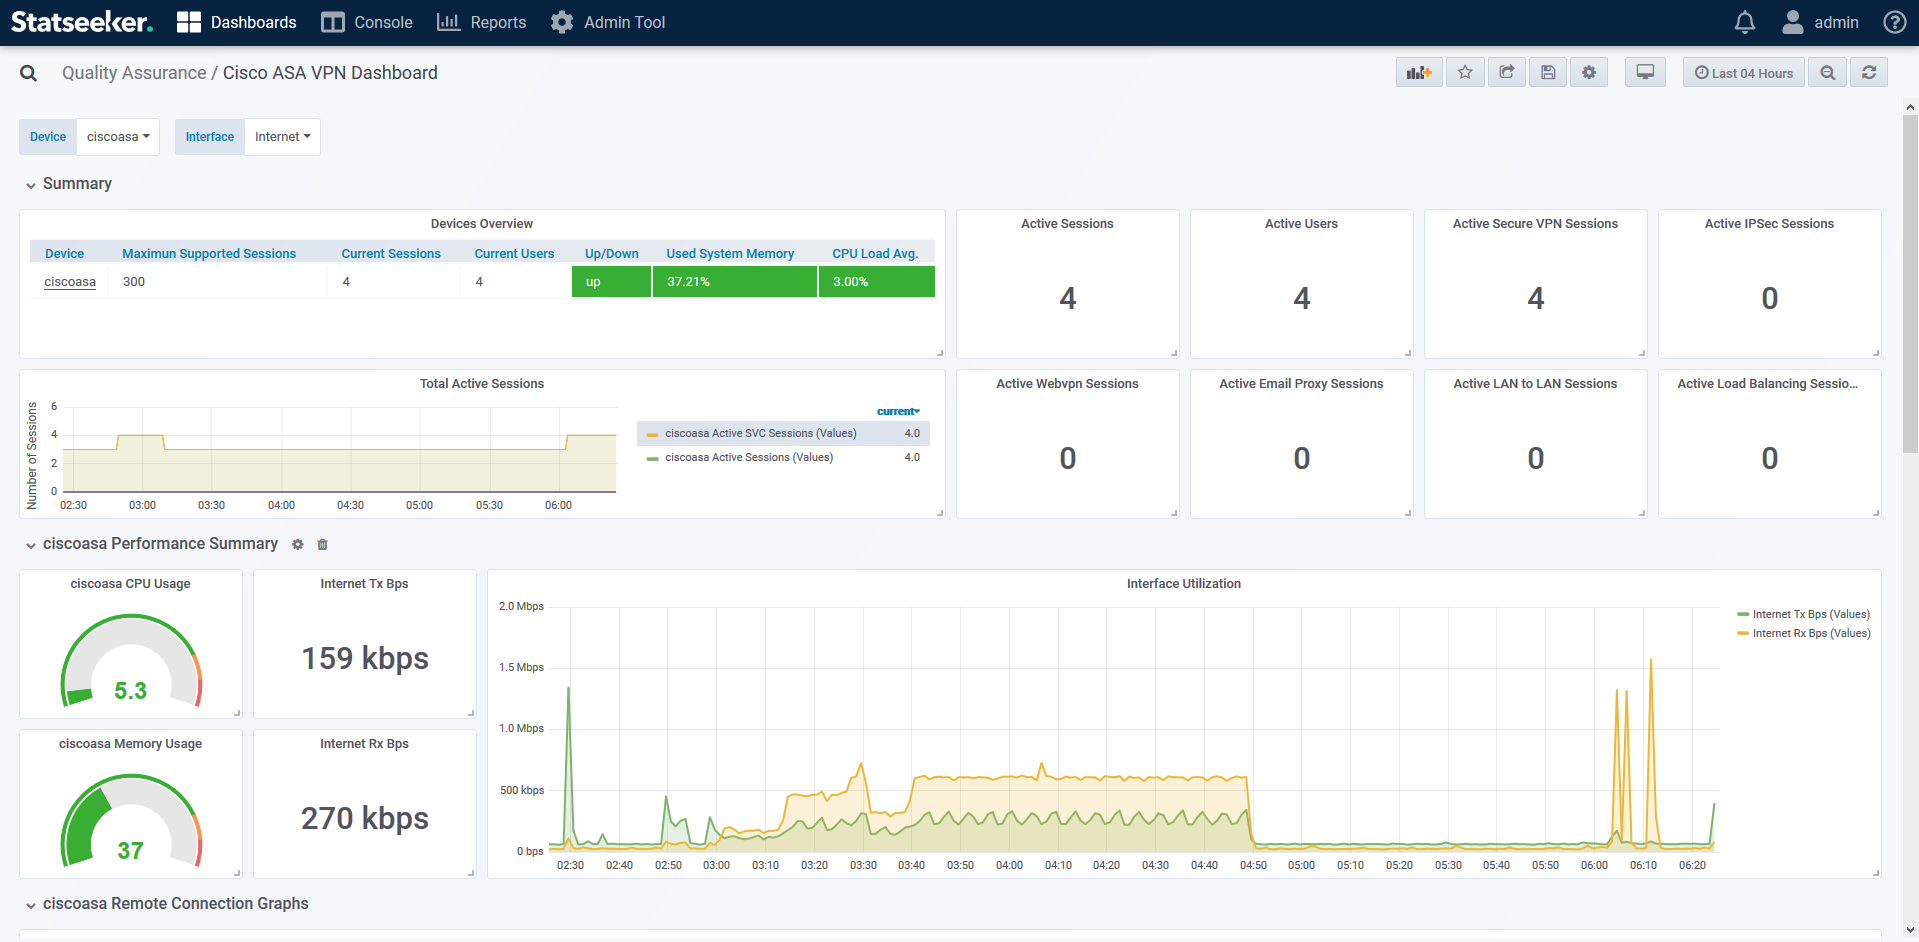
Cisco VPN Sessions Dashboard – available from the Statseeker Dashboard Library
The dashboard offers current state and historical data covering a range of VPN related metrics such as:
- Active users and user groups
- Active remote access sessions
- Established email proxy sessions
- Secure VPN client sessions
- WebVPN client sessions
- Active LAN to LAN sessions
- Active IPSec sessions
- Established load balancer sessions
- Terminated sessions
- Number of remote access users, groups and sessions supported by the device
Requirements:
- Statseeker v5.5.0+
- VPN Monitoring Bundle – contact Statseeker Support for access to this package, and see Statseeker Custom Script Packages for instructions on installing the package.
Download the dashboard and import it to your Statseeker server, for detailed instructions on how to do this see Importing Dashboards.
For details, examples and videos on editing your dashboards, refer to the Dashboard sections (in both the Documentation and Videos tabs) in the Statseeker Documentation Library
Older Versions
An updated VPN Sessions package is also available for older versions of Statseeker (v5.4 and earlier), but as Statseeker no longer produces dashboard content for the legacy dashboarding system you will need to create your own dashboard content.
Once the VPN Sessions package has been installed, and you have confirmed that data is being collected from the devices you wish report on, you can begin adding that data to your dashboards.
The legacy dashboards have limited options with regard to reporting on this data, but you are able to embed any Statseeker report into one of these dashboards. This includes:
- Legacy NIM Console reports
- Statseeker Custom Reports
- Reports generated by Reporting Tool
Documentation detailing how to configure and edit your legacy dashboards can be found at:
To add a report into your legacy dashboard:
- Run the report and copy the URL from the browser window/tab
In your dashboard:
- Add a new dashlet and set Dashlet Type to Link
- Paste the URL for the report into the Link field
- Set the report Scrolling and Refresh options as required
- Click Done
- Repeat the process to add additional reports as needed for your VPN Sessions dashboard
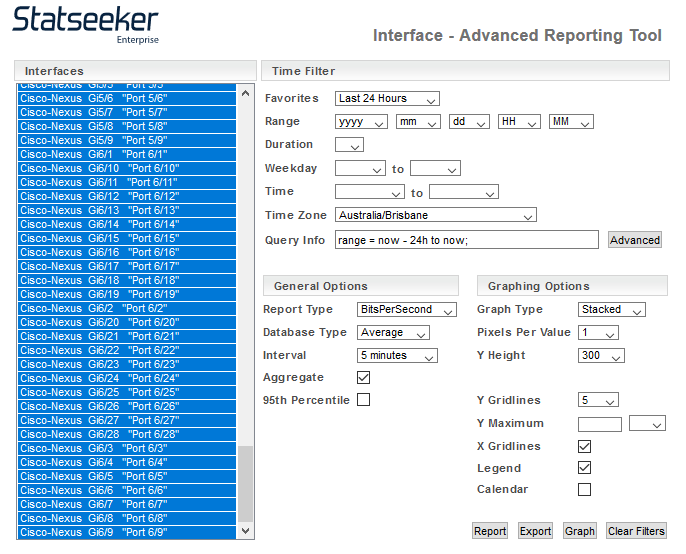
If you require dashboard content providing aggregated data summaries, such as total traffic (or traffic rates), across an entire device, then you can use the Reporting Tool to generate the report. Each of the legacy report sections in your NIM Console contains a Reporting Tool component.
- Select the device and run the Interfaces > Reporting Tool
- Select all interfaces on the device
- Set Report Type, Interval and Aggregate
- Select the Graph Type – selecting stacked will give you total traffic across the device broken into inbound and outbound traffic
- Click Graph
You will notice that graphs created via the reporting tool do not include a report header identifying the report content or scope. When adding reporting tool output to your dashboard, you may want to add a Heading element to identify the content.