** Legacy Dashboard System **
Statseeker v5.5.0 introduced a new dashboarding system. The legacy system was removed from new installations, but is still available to users upgrading an existing Statseeker server. This documentation is specific to that legacy system.
For documentation relating to the current dashboarding system see Statseeker Dashboards.
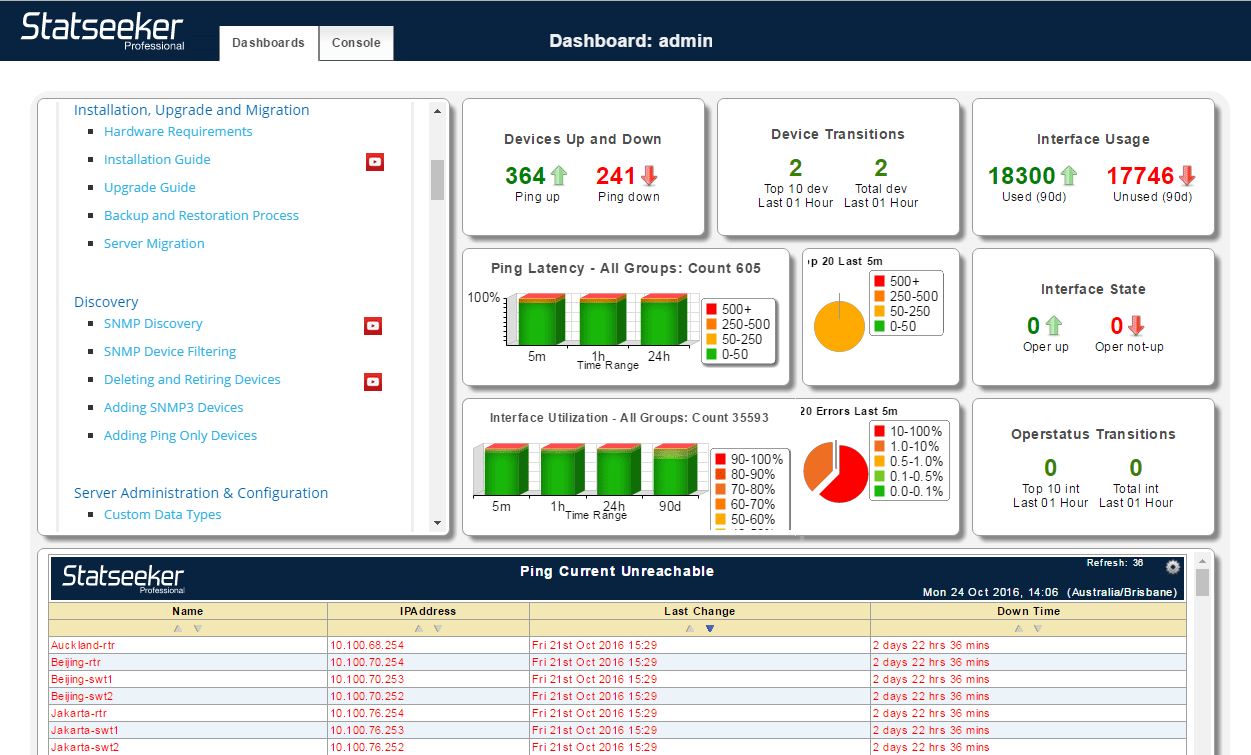
The Statseeker Dashboard is the default view when accessing Statseeker via the web interface. It is an editable view comprised of one or more ‘dashlets’, which contain:
- A Statseeker report (graph, table, summary, etc.)
- Output from a 3rd party tool
- HTML
- Static text
The dashboard is both user and group aware, meaning that you can restrict access to a dashboard as well as tailor a dashboard to a given user (or group of users). Dashboards and users have a many-to-many relationship in Statseeker, meaning that:
- A dashboard can be accessed by one or more users
- A user can access one or more dashboards
In this way, you can tailor any number of dashboards to offer:
- A high-level overview of the entire network
- A view covering all devices of a specific type or in a specific location
- A focused snapshot of a group of interfaces
- A view into your hardware inventory and licensing requirements
All Statseeker report views contained in a dashboard are also links to the full Statseeker reporting interface for that report, allowing you to use the dashboard to highlight a potential hotspot and then investigate that issue with a single click.