
* Legacy Documentation for Statseeker v5.5.5 *
Index
- Overview
- Viewing a Report
- Console Report Filters
- Filtering Within Reports
- Report Links, Drill Downs & Historical Views
- Advanced Reporting Tool
- Statseeker Stock Reports
- Vendor and Technology Specific Reports
- Report List
- Managing Availability and Display of Reports
Overview
The Statseeker Console is the primary entryway into the Statseeker reporting functionality. From here you have access to every Statseeker report (pre-packaged or custom made), as well as options and filters to present your data in the way you want.
The Console tailors the stock Report List to reflect those devices/interfaces being polled by Statseeker, filtering out any pre-packaged report that does not apply to your network. The report list is updated as new hardware becomes available on your network, exposing applicable reports that were previously hidden.
Viewing A Report
To view a report from the Console:
- Select any number of groups or devices
- Then select the report to run
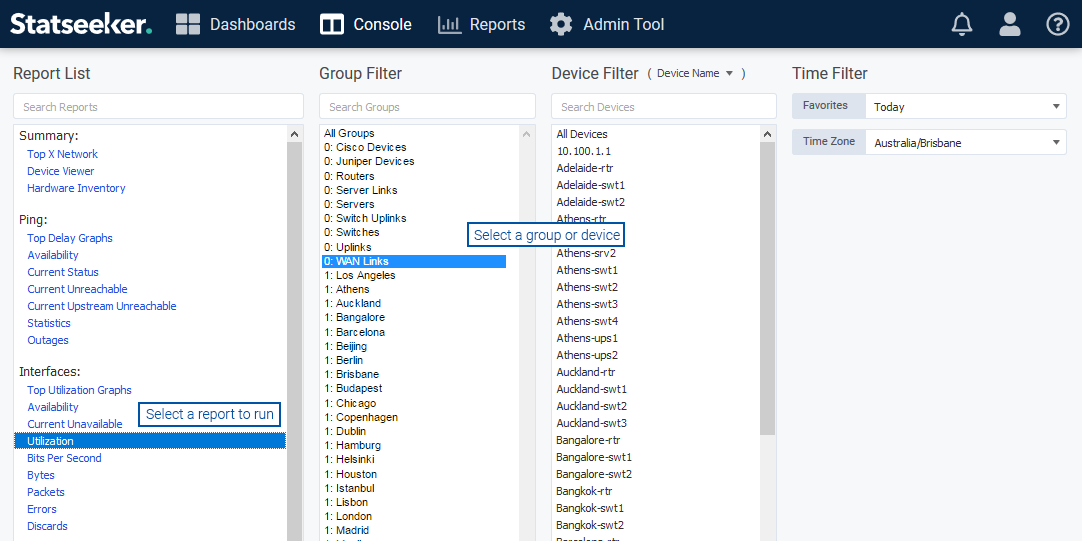
The report will launch in a new window.
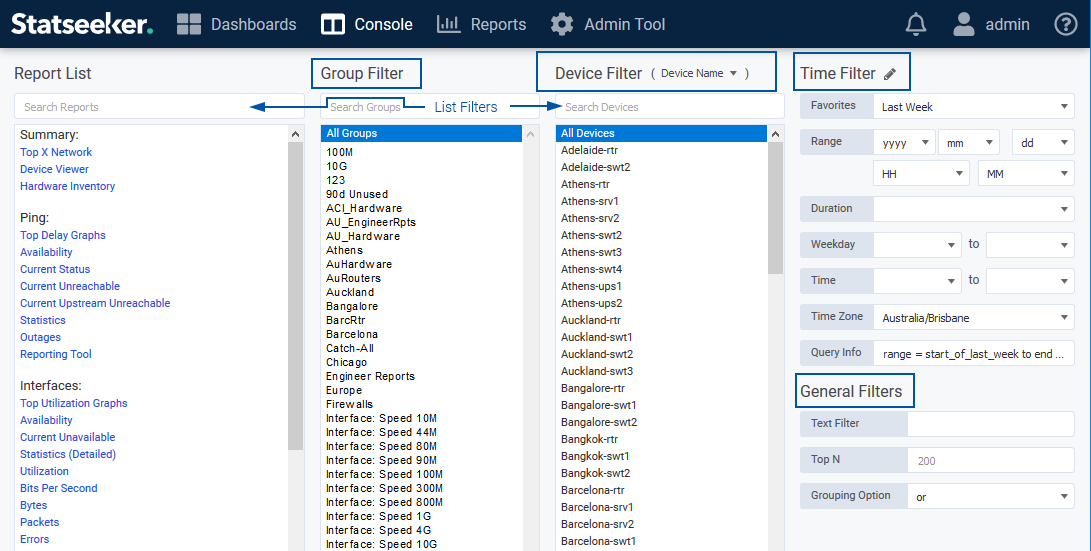
Console Report Filters
Reports generally focus upon one or more devices or interfaces and present configuration, event, or timeseries data. The report content can be filtered to better highlight the relevant data using the console filters:
- Group Filter
- Device Filter (can be configured to display and filter against Device Name, IP Address, or sysName)
- Time Filter
- General Filters: Text and Top N
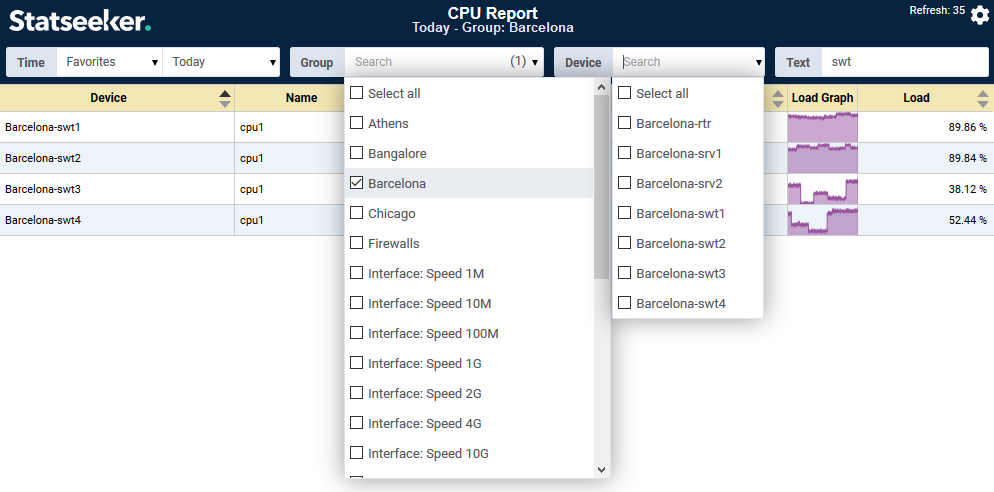
Group and Device Filters
Selecting entries from either the Devices or Groups columns in the console will limit the report content to that selection. These selections are passed through to in-report filters where applicable and may then be further modified within the report.
Not applying Group\Device filters means that the report will request data from your entire network, and this may negatively impact report performance in some instances, depending on the Statseeker server resources.
- Shift + click while clicking to select groups of devices
- Ctrl + click to add/remove a single item to/from the selection
When selecting multiple groups, the General Filters > Grouping Option determines how that selection is processed:
- OR – entities from any of the selected groups
- AND – only entities which appear in all of the selected groups
The displayed content of the Report, Group, and Devices lists can be filtered by entering text in the Search field above each column. In addition, the Device list features a dropdown allowing you to display, and search against, device name, IP address, or sysName.
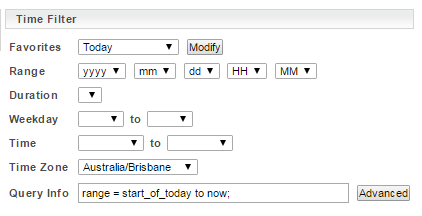
Time Filter
The Console Time Filter presents a range of options that can be used to specify a reporting period and are applied to:
- Any stock or custom report where the report configuration does not include a specified timefilter. If the report configuration does include a timefilter, then the console timefilter value is ignored when running the report, but typically these reports include in-report timefilter options to update the reporting period from within the report.
- Any legacy ‘event’ based report (legacy reports looking at availability, syslog, SNMP traps, or threshold breaches)
Time Filter Options
- Favorites – a list of pre-configured timefilters, the list can be configured from the Admin Tool, see Creating a Time Filter Favorite
- Range and Duration – can be used together to specify a reporting period
- Weekday and Time – can be used together to filter a specified reporting period
- Time Zone – select the timezone for the specified reporting period
- Query Info – the timefilter query that will be used to populate the report (updates as you specify the timefilter but can be manually edited)
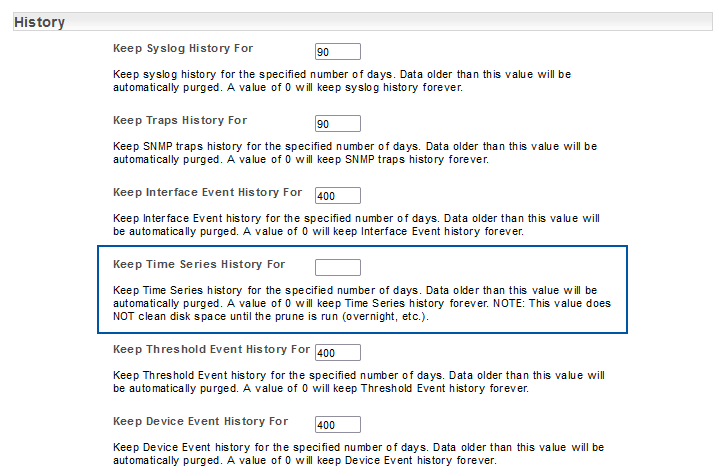
Timeseries Data Retention
Be default, Statseeker stores all timeseries data indefinitely. This default data retention period can be updated from the Admin Tool:
- Select Admin Tool > Network Discovery – Advanced Options > Advanced Options
- In the History section, locate the Keep Time Series History For setting and update as needed
- Click Save
General Filters
Text Filter
Enter a string or regex expression to be used in filtering the report content. The supplied filter will be compared to all graph names (typically these are device + entity) in graphical reports, and all device name columns in tabular reports.
Top N
Specifies a limit to the number of results to return.
- The default value is a user-specific setting which can be configured from the edit user screen
- Custom reports can be configured with a specific Results per page setting which will override the user’s Top N setting
Grouping Option
Specify the operator to be applied when making multiple selections in the Group Filter column.
- OR – entities from any of the selected groups
- AND – only entities which appear in all of the selected groups
Filtering Within Reports
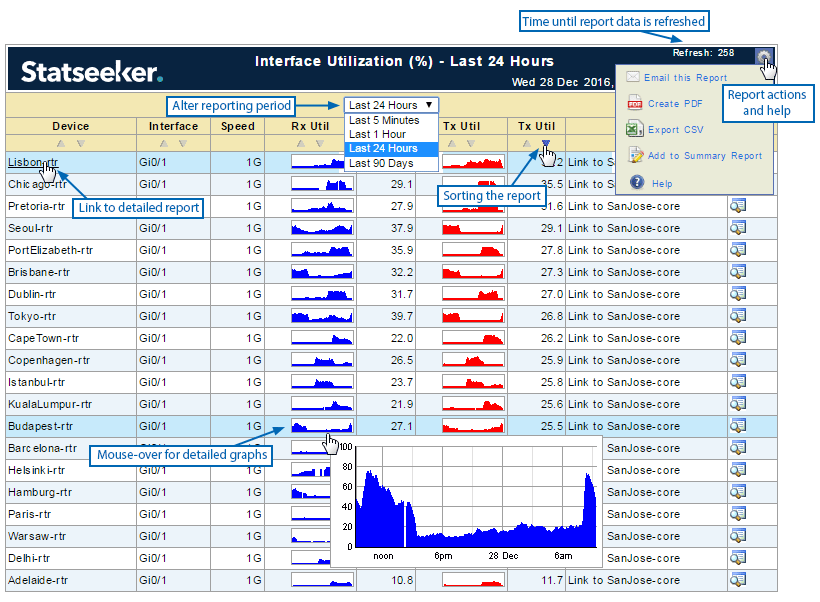
Most reports contain filter options within the report header allowing you to assign/modify filters after the report has been launched.
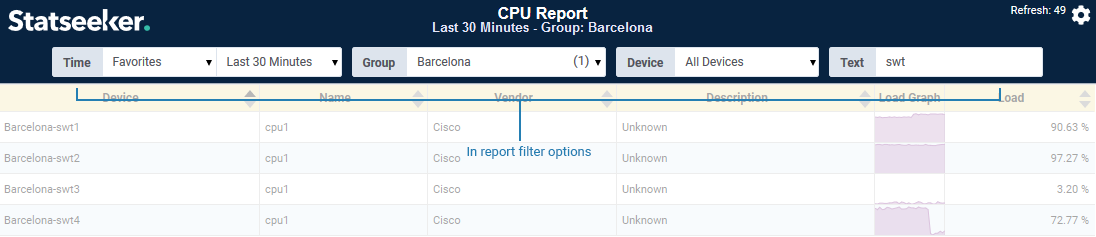
- Any filters applied in the Console prior to running the report are assigned as the default filters used when the report is launched
- If it is a custom report and the configuration specifies filters:
- These will be assigned as the default, overriding the Console filters
- The report header will contain a notification of this override
Time Selector
Most reports feature a time selector in the report header. This selector functions as a timefilter and can be used to dynamically alter the reporting period of the report while viewing it. When opening a report containing a time filter, the time selector defaults to this value. When opening a report that does not have a time filter configured, the time selector will use the filter specified in the Console, by default this will be Today.
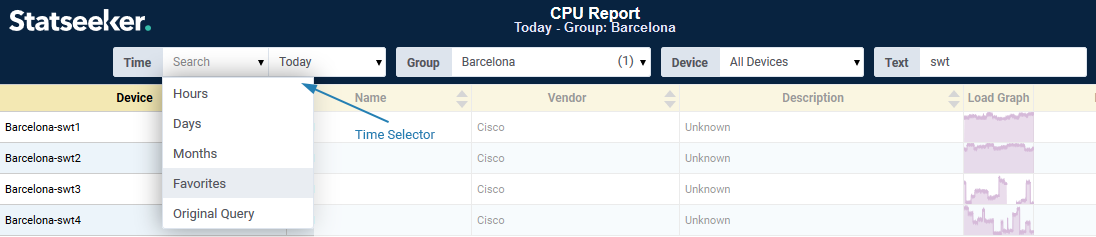
- Favorites – offers the current content of the time filter favorites list
- Hours – a 24hr slider with 1-hour increments
- Days – the selector contains ‘today so far’, plus the previous 7 days, with 1-day increments
- Months – the selector contains ‘this month so far’, plus the previous 12 months, with 1-month increments
- Original Query – reset the report to the original/default time filter
By default, reports display the report timefilter in the header (this can be disabled in the report configuration, see Custom Reporting). When using the time selector to modify the reporting period, the report header is updated to reflect your selection.
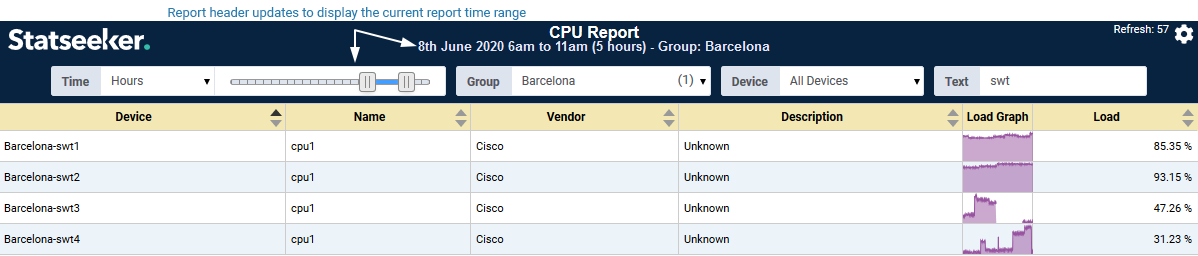
When modifying the reporting period via the Time Selector, the Resolution (interval between plotted data points, and the size of aggregated data ‘buckets’) used in the report is automatically updated to best suit the scope of the report.
For example: on a graph with a reporting period of the previous 3 months, the default interval may be 15 minutes. If the reporting period is updated to the Last 8hrs, then the interval would be updated to 1 minute, giving a granular view more suited to the reporting period. Conversely, using the Time Selector to take a report looking at a single day’s data out to the previous 6 months, might update the interval from 1 minute out to 12 hours. Any slice of that 6 months history can still be viewed at 1-minute resolution when the reporting period is set accordingly.
Group and Device Filters
The Group and Device filters will reflect any group/device selections that were applied in the Console prior to launching the report. This filter selection can be modified to refocus the report while viewing the report.
- The Group filter contains all groups on the server that the user has access to, see Managing User Access & Permissions with Grouping
- Group selection determines the content of the in-report Device filter
- Multiple selections can be made in both the Group and Device filters
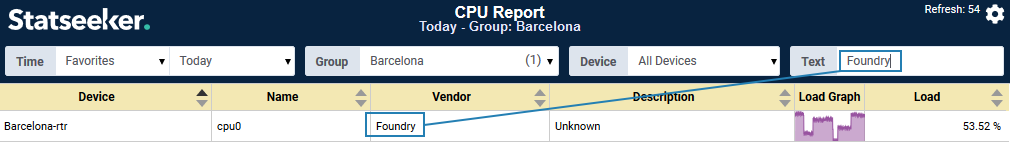
Text Filter
The Text filter will reflect the content of the General > Text filter that was applied in the Console prior to launching the report. This filter can be modified to refocus the report while viewing the report.
The filter:
- Accepts either a simple string or RegEx
- Matches that string/expression across strings within the report (entity names in graphs, string columns in tables), but not match against timeseries data fields
When a RegExp exclusion filter is applied to tabular reports, the filter is matched against every string/date column in the report, and not against the entire row as a whole. This means that if any filtered column does not contain the exclusion string, the filter is satisfied and the row is displayed, even if other columns do feature the exclusion string.
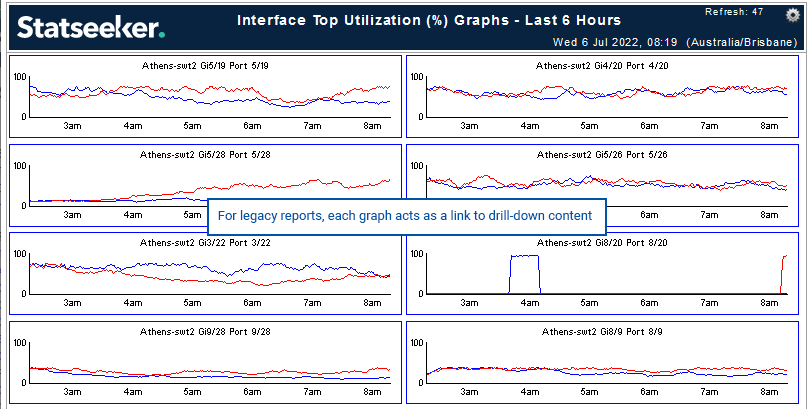
Report Links, Drill Downs & Historical Views
Most reports will offer the ability to drill-down to more specific data regarding a device, interface, property, or activity presented in the report. In this way you can review a metric across a range of devices, or a range of metrics returned from a single device, identify anomalous values, and then investigate further to resolve the issue as required.
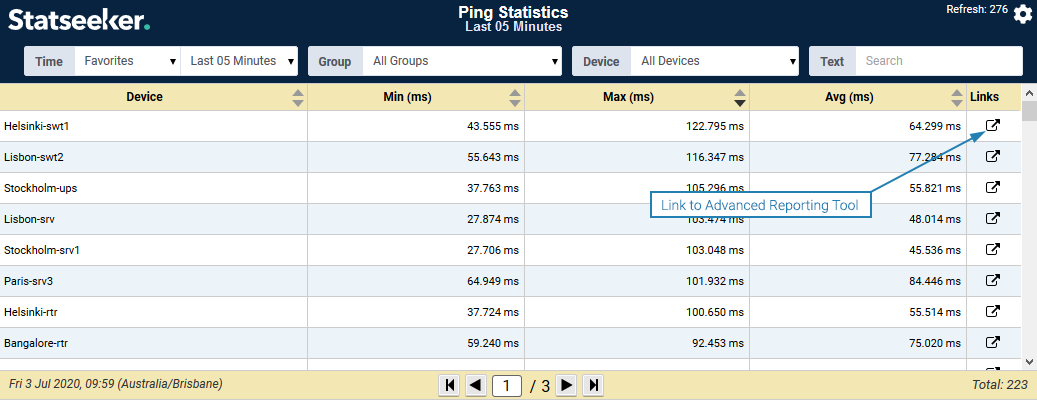
In tabular reports, these drilldowns and pointers to other reports are provided as links on each of the appropriate cell contents, simply click to access the new report.
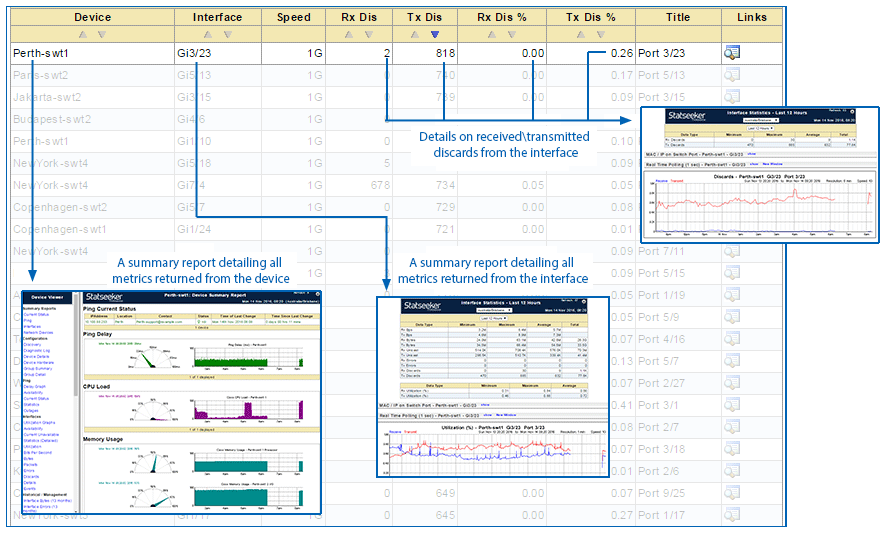
All graphs act as links to a ‘details’ report for that metric on that device, but these links differ between legacy and newer reports.
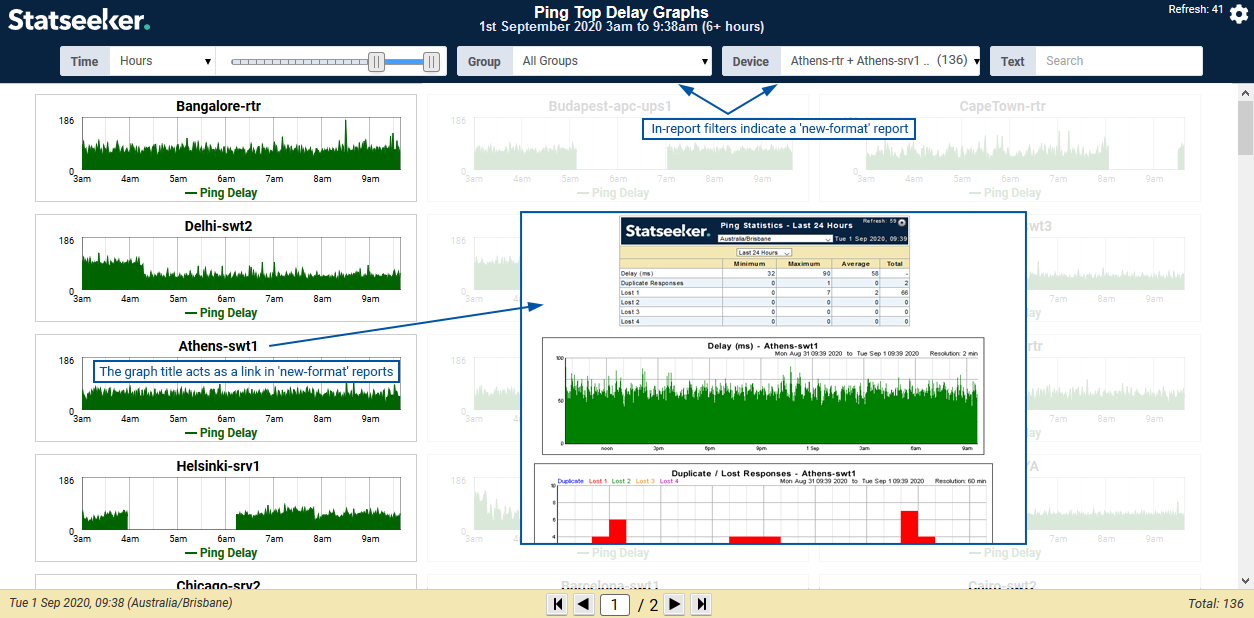
In a similar manner, you can zoom out to review a device or metric over a larger time scale. By default most reports will present what is currently happening, but you can easily alter the report period to ascertain if the current behavior is anomalous or typical.
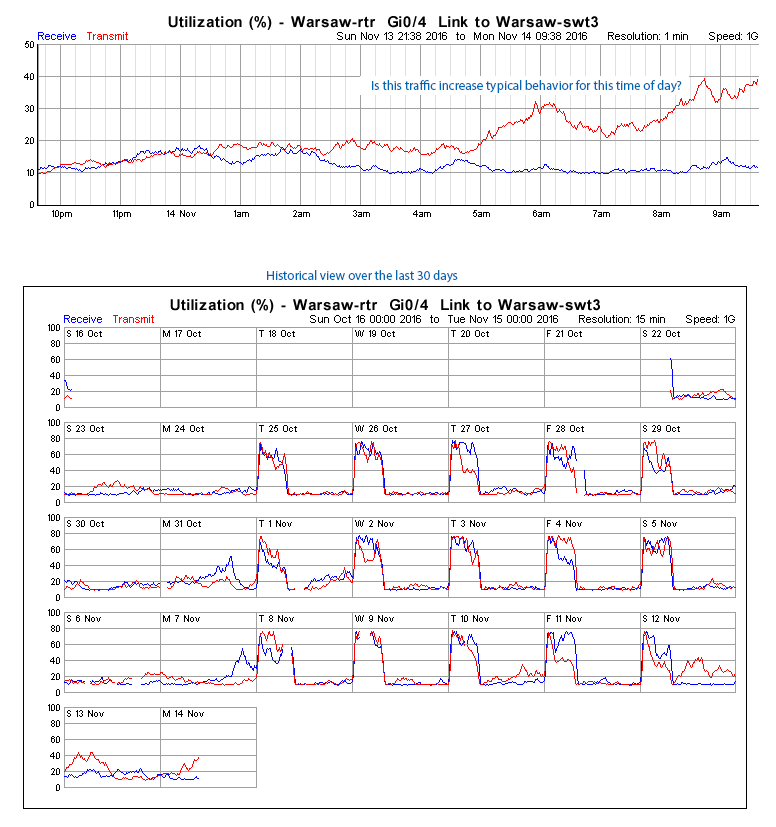
Historical data is available for all devices/interfaces from the moment that they are discovered, and this data is always available at the same 1-minute interval resolution in which it was collected. Statseeker will never ‘roll-up’ (average) your historical data, regardless of how long ago it was collected.
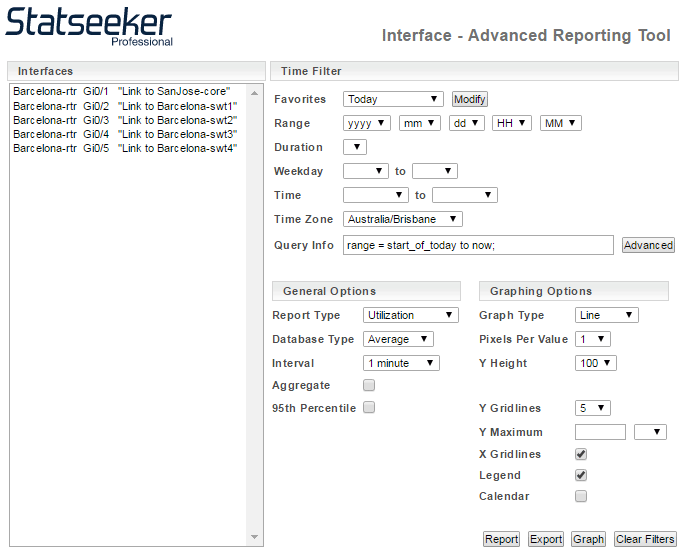
Advanced Reporting Tool
Many of the sections in the Report List feature an entry called Reporting Tool which provides access to additional reporting customization options useful for quickly configuring one-off reports. This feature is also available as a link from within many reports.
The Advanced Reporting Tool breaks available filters and options into 3 groups:
- Time Filter – offering the same options as the console time filter
- General Options – options which vary depending on the focus of the report (server, device, interface, etc.) but can include:
- Report Type – which metric to report on
- Database Type – data manipulation options (display averages, totals, maximums, etc.)
- Interval – resolution of the data
- Aggregate – toggle to select individual or aggregate values
- 95th Percentile – toggle to identify the 95th percentile values for the metric
- Graphing Options – presentation options for graphs
- Graph Type – line, bar, etc.
- Pixels Per Value – how large to display each data point, useful for modifying how bar graphs are presented
- Y Height – modify the y-axis height by the selected % of standard Statseeker graph height
- Y Gridlines – select number of y-axis reference lines to display
- Y Maximum – specify a value and a unit of measurement and only values under that limit will be plotted
- X Gridlines – toggle to display x-axis reference lines
- Legend – display toggle
- Calendar – toggle to wrap the x-axis and remove the requirement for horizontal scrolling when viewing large data sets
The tool allows you to produce tabular reports (using the Report button) or graphical reports (Graph button) and to export (Export button) the report data in *.csv format.
Statseeker Stock Reports
Statseeker is packaged with over 350 stock reports covering all aspects of network monitoring, providing the ability to interrogate and visualize network infrastructure and activity with no requirement for additional report configuration.
By default many of these reports are hidden and only listed once Statseeker discovers a device capable of providing data that would be present in the report. This keeps reporting options focused on the content of your network.
- Select Administration Tool > Network Discovery / Advanced Options > Advanced Options
- Scroll down to the Reports section and:
- to display all reports for all users, set Report Hiding to Off
- to only display all reports to Admin users, set Report Hiding to On and Admin Show All Reports to On
- Click Save
- Return to the Console and refresh the page
Notable Statseeker Reports
An extensive range of reports (350+) are available by default with every Statseeker server, and while some are applicable to networks with specific types of hardware, others are applicable to every Statseeker deployment.
Some of these are:
- Summary: Device Viewer
- General: Device Details
- General: Device Hardware Inventory
- Ping: Current Unreachable
- Ping: Statistics
- Interface: Current Unavailable
- Interface: Utilization Baselines
- Network Devices: CPU/Memory/Temperature Reports
Device Viewer
The Device Viewer report is a summary report offering all reports, across all metrics, applicable to the device. The report window is broken into two parts, the left offering a list of all reports for the device and the right which displays the selected report. At launch, the Device Viewer will display a current state performance view for the device. This report also offers the ability to rewalk the device to retrieve any recent changes to the MIB (Management Information Base) for the device.
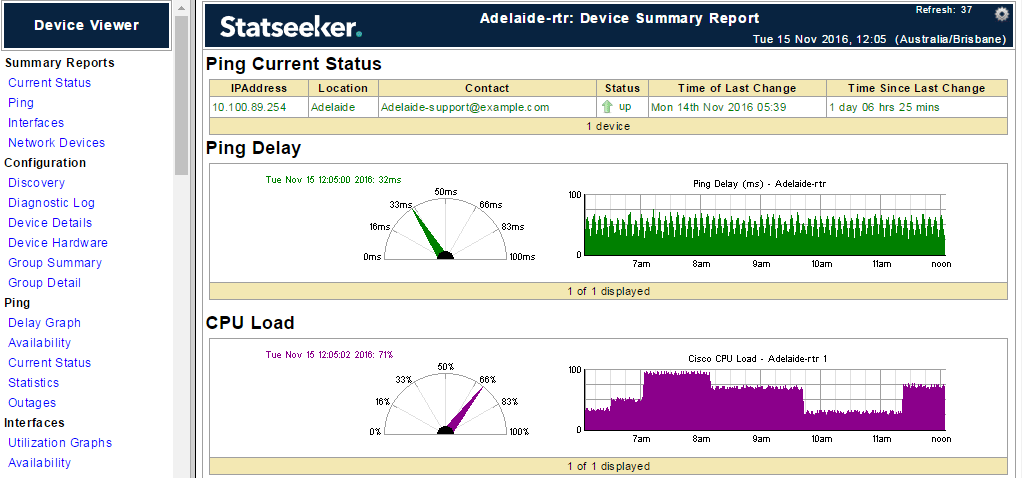
The Device Viewer requires a device to be selected prior to running.
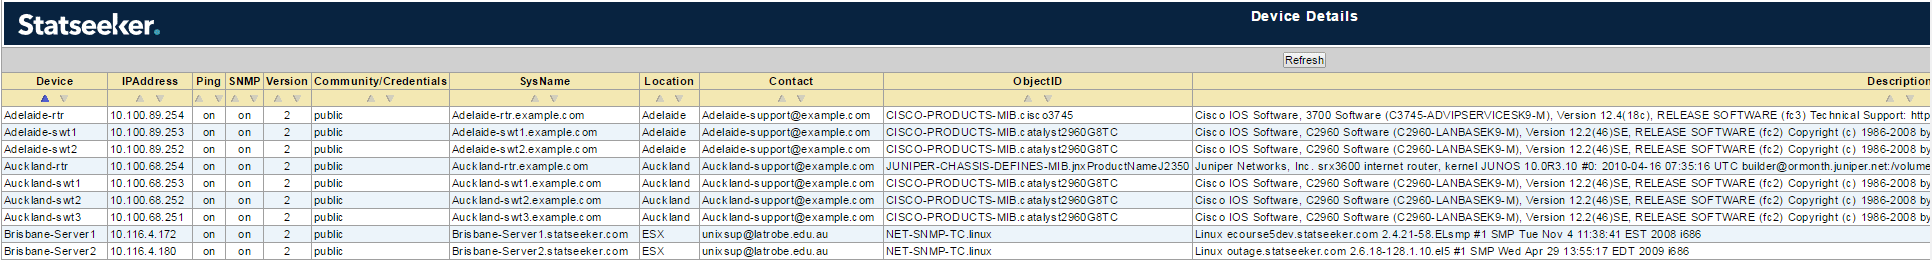
General: Device Details
The General: Device Details report presents configuration details on the selected device/s and provides Admin level users the ability to:
- Toggle both ping and SNMP polling
- Rename the device: edit Device, Hostname or IPAddress, changes will be propagated on next config build (every few minutes)
- Reconfigure the devices SNMP credentials
- Add latitude and longitude details to the device record
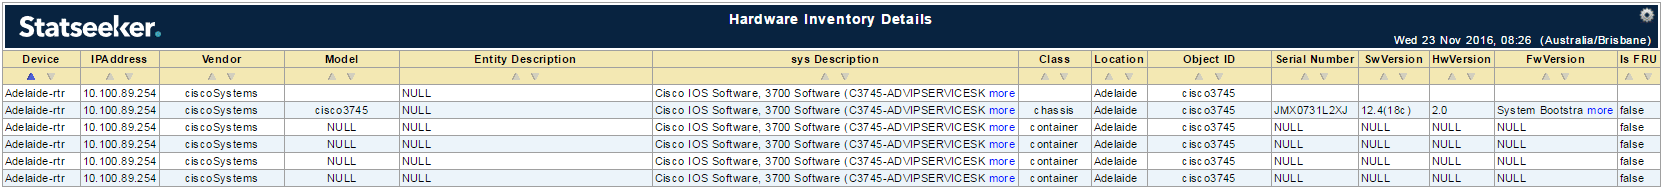
General: Device Hardware Inventory
The General: Device Hardware Inventory report offers inventory details for the selected devices. These details include:
- Vendor, model, and serial number
- Location
- Software, hardware, and firmware versions
The report also offers links to the Summary Reports > Device Viewer for the selected device.
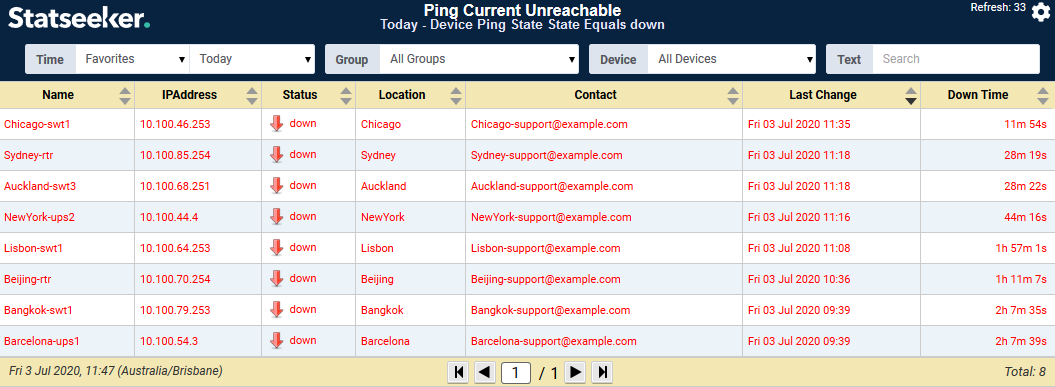
Ping: Current Unreachable
The Ping: Current Unreachable report details those devices that are currently not returning a ping response. The report offers drilldowns to the Summary Reports > Device Viewer and the Ping Outages reports.
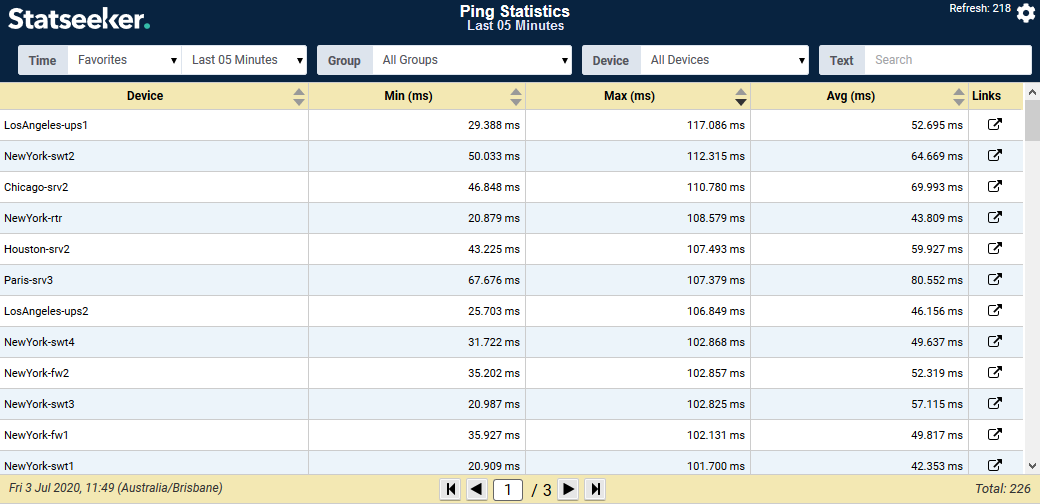
Ping: Statistics
The Ping: Statistics report details minimum, maximum, and average ping response times for devices. The report offers drilldowns to the Summary Reports > Device Viewer and a Ping Response details report.
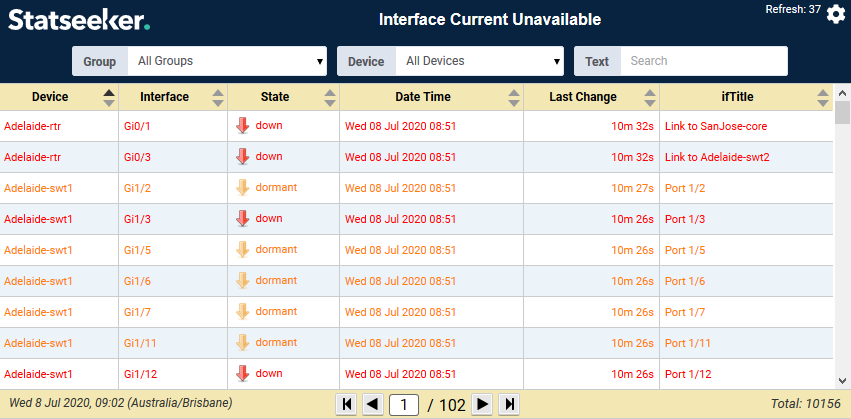
Interface: Current Unavailable
The Interface: Current Unavailable report details those interfaces that are currently not returning a ping response. The report offers drilldowns to the Summary Reports > Device Viewer and an Interface Outages report.
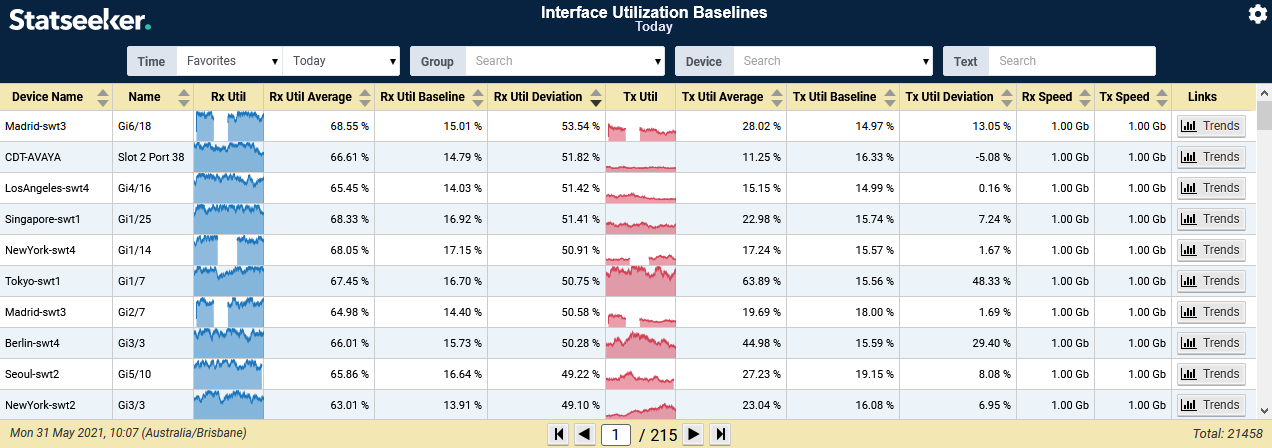
Interface: Utilization Baselines
The Interface: Utilization Baselines report returns graphical and text-based data on the utilization percentages for interfaces and details on how this behavior compares to historical baseline data for that interface. The default sort is by inbound deviation from historically ‘typical behavior’ and default time period is ‘today’, this time period can be altered from within the report to expand the scope.
The report offers drilldowns to:
- the Device Viewer
- Interface Statistics
- Utilization Baseline Details
- Utilization Trend Details
Network Devices: CPU/Memory/Temperature Reports
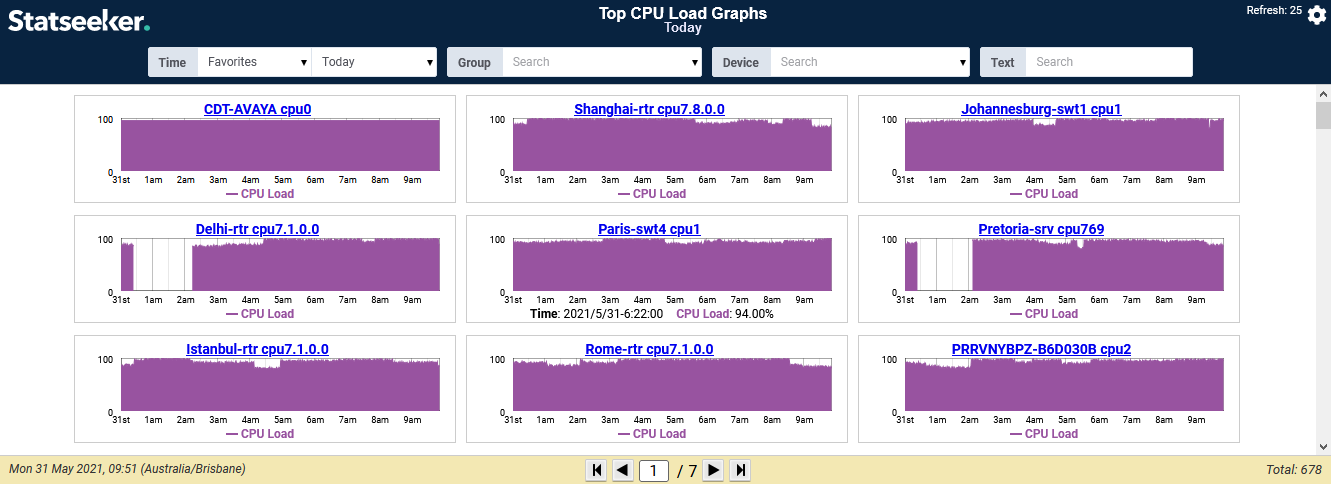
Graphical and tabular reports for the major device health metrics of CPU and Memory load and temperature. All reports use a default sort pushing highest load/temperature to the top and feature drilldowns to the Device Viewer.
For a complete list of reports available in a standard Statseeker deployment, see the Report List.
Vendor and Technology Specific Reports
In addition to the more generic reports and the Advanced Reporting Tool, Statseeker offers an extensive range of reports targeting specialist functionality and a wide range of manufacturer-specific network devices, and device configurations.
All of these reports are also available from the Console Report List, and can be added to dashboards, included in their own version of summary reports (See Embedded Reports), and have automated emailing schedules applied. For details on creating your own custom reports see Statseeker Custom Reporting.
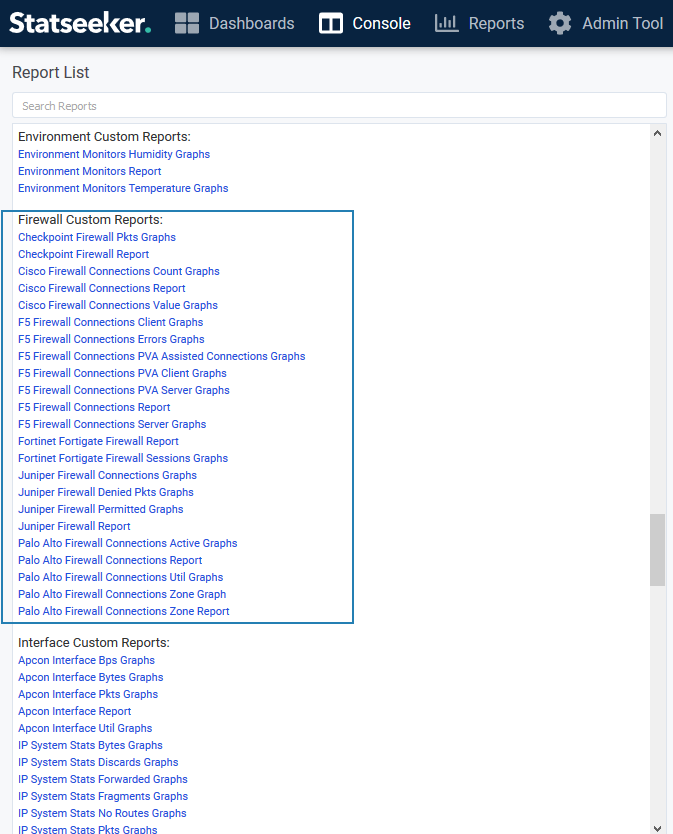
These reports (and any custom report that you create, and flag as available from the Console) are automatically grouped according to the report data type and located at the bottom of the Report List in the Console. By default, Statseeker hides from the Console (they are always available from the Reports panel) those reports which don’t apply to any devices currently being monitored on your network. As Statseeker discovers these devices, the corresponding custom reports are displayed in the Console.
- Select Administration Tool > Network Discovery / Advanced Options > Advanced Options
- Scroll down to the Reports section and set Report Hiding to Off
- Click Save
- Return to the Console and refresh the page
Report List
As of Statseeker v5.5.5, a standard deployment with no additional Custom Data Type (CDT) packages added to the server comes with the following reports available ‘out-of-the-box’:
- Summary: Top X Network
- Summary: Device Viewer
- Summary: Hardware Inventory
- Ping: Top Delay Graphs
- Ping: Availability
- Ping: Current Status
- Ping: Current Unreachable
- Ping: Current Upstream Unreachable
- Ping: Statistics
- Ping: Outages
- Ping: Reporting Tool
- Ping: Current Status (Legacy)
- Ping: Current Unreachable (Legacy)
- Ping: Statistics (Legacy)
- Ping: Top Delay Graphs (Legacy)
- Interfaces: Top Utilization Graphs
- Interfaces: Availability
- Interfaces: Current Unavailable
- Interfaces: Statistics (Detailed)
- Interfaces: Statistics (Summary)
- Interfaces: Utilization
- Interfaces: Utilization Baselines
- Interfaces: Utilization Trends
- Interfaces: Bits Per Second
- Interfaces: Bytes
- Interfaces: Packets
- Interfaces: Errors
- Interfaces: Discards
- Interfaces: Details
- Interfaces: Reporting Tool
- Interfaces: Current Unavailable (Legacy)
- General: Device Details
- General: Device Hardware Inventory
- General: Custom Data Details
- General: Configuration Details
- General: MAC Report
- General: MAC – IP – Switch Port
- General: Traffic Analyzer
- General: Statseeker Process Details
- General: MAC / IP / Switch Port (Legacy)
- General: Printers (Legacy)
- Historical / Management: Device Group SLA Availability ( months)
- Historical / Management: Interface Group SLA Availability ( months)
- Historical / Management: Interface Bytes ( months)
- Historical / Management: Interface Errors ( months)
- Historical / Management: Interface Discards ( months)
- Historical / Management: Interface Usage ( days)
- Network Devices: Top CPU Load Graphs
- Network Devices: Top Memory Usage Graphs
- Network Devices: Top Temperature Graphs(C)
- Network Devices: Top Temperature Graphs(F)
- Network Devices: CPU Load
- Network Devices: Memory Usage
- Network Devices: Temperature
- Network Devices: Reporting Tool
- Network Devices: Top CPU Load Graphs (Legacy)
- Network Devices: Top Memory Usage Graphs (Legacy)
- Network Devices: Top Temperature Graphs(C) (Legacy)
- Network Devices: Top Temperature Graphs(F) (Legacy)
- Servers: Top CPU Load Graphs
- Servers: Top Memory Usage Graphs
- Servers: CPU Load
- Servers: File System Usage
- Servers: Memory Usage (Physical)
- Servers: Memory Usage (Virtual)
- Servers: Reporting Tool
- Servers: Top CPU Load Graphs (Legacy)
- Servers: Top Memory Usage Graphs (Legacy)
- Events: Syslog
- Events: SNMP Traps
- Events: Device Events
- Events: Interface Events
- Thresholds: Threshold Summary
- Thresholds: Threshold Report
- Thresholds: Threshold Event Report
- Cisco: Top IPSLA Graphs
- Cisco: IPSLA
- Cisco: NBAR Interfaces
- Cisco: Process Table
- Cisco: Events
- Cisco: Reporting Tool (IPSLA)
- UPS: Events
- UPS: Battery
- UPS: Input
- UPS: Output
- UPS: Reporting Tool
- APC: Events
- APC: UPS Battery
- APC: UPS Input
- APC: UPS Output
- APC: Reporting Tool
- Frame Relay: Top Utilization Graphs
- Frame Relay: Statistics
- Frame Relay: Details
- Frame Relay: Reporting Tool
- ACI Custom Reports: ACI Application Health Graphs
- ACI Custom Reports: ACI Bridging Domain Details
- ACI Custom Reports: ACI Bridging Domain Health Graphs
- ACI Custom Reports: ACI Bridging Domain Subnet Details
- ACI Custom Reports: ACI Client Endpoint Details
- ACI Custom Reports: ACI Fault Domain Summary
- ACI Custom Reports: ACI Fault Type Summary
- ACI Custom Reports: ACI Faults
- ACI Custom Reports: ACI Health Graphs
- ACI Custom Reports: ACI Node Details
- ACI Custom Reports: ACI Node Health Graphs
- ACI Custom Reports: ACI Pod Health Graphs
- ACI Custom Reports: ACI Private Network Details
- ACI Custom Reports: ACI Private Network Health Graphs
- ACI Custom Reports: ACI Tenant Health Graphs
- ACI Custom Reports: APIC Application Profiles Graphs
- ACI Custom Reports: APIC Bridging Domains Graphs
- ACI Custom Reports: APIC Client Endpoints Graphs
- ACI Custom Reports: APIC Controllers Graphs
- ACI Custom Reports: APIC Details
- ACI Custom Reports: APIC Endpoint Groups Graphs
- ACI Custom Reports: APIC Leaves Graphs
- ACI Custom Reports: APIC Pods Graphs
- ACI Custom Reports: APIC Private Networks Graphs
- ACI Custom Reports: APIC Spines Graphs
- ACI Custom Reports: APIC Tenants Graphs
- Application Custom Reports: Cisco NBAR Bits Per Second Graph
- Application Custom Reports: Cisco NBAR Bytes Graph
- Application Custom Reports: Cisco NBAR Interfaces Report
- Application Custom Reports: Cisco NBAR Packets Graph
- Application Custom Reports: Cisco NBAR Report
- Application Custom Reports: Cisco NBAR Util Graph
- Asset Custom Reports: Hardware Inventory Report
- Asset Custom Reports: Inventory Dell DNOS
- Device Health Custom Reports: CPU – UCD Table Report
- Device Health Custom Reports: CPU Graphs
- Device Health Custom Reports: CPU Idle – UCD Graph Report
- Device Health Custom Reports: CPU Interrupt – UCD Graph Report
- Device Health Custom Reports: CPU Kernel – UCD Graph Report
- Device Health Custom Reports: CPU Load – UCD Graph Report
- Device Health Custom Reports: CPU Nice – UCD Graph Report
- Device Health Custom Reports: CPU Report
- Device Health Custom Reports: CPU System – UCD Graph Report
- Device Health Custom Reports: CPU User – UCD Graph Report
- Device Health Custom Reports: Cisco TCAM Graphs
- Device Health Custom Reports: Cisco TCAM Summary Report
- Device Health Custom Reports: File System Graphs
- Device Health Custom Reports: File System Report
- Device Health Custom Reports: Memory Graphs
- Device Health Custom Reports: Memory Report
- Device Health Custom Reports: Sensor – Fan Graph
- Device Health Custom Reports: Sensor – Fan Report
- Device Health Custom Reports: Sensor – Other Graph
- Device Health Custom Reports: Sensor – Other Report
- Device Health Custom Reports: Temperature Graphs
- Device Health Custom Reports: Temperature Report
- Embedded Custom Reports: ACI Summary
- Embedded Custom Reports: APIC Summary
- Embedded Custom Reports: Cisco NBAR Graphs
- Embedded Custom Reports: Device Health Viewer
- Environment Custom Reports: Environment Monitors Dew Point
- Environment Custom Reports: Environment Monitors Humidity Graphs
- Environment Custom Reports: Environment Monitors Report
- Environment Custom Reports: Environment Monitors Temperature Graphs
- Firewall Custom Reports: Checkpoint Firewall Pkts Graphs
- Firewall Custom Reports: Checkpoint Firewall Report
- Firewall Custom Reports: Cisco Firewall Connections Count Graphs
- Firewall Custom Reports: Cisco Firewall Connections Report
- Firewall Custom Reports: Cisco Firewall Connections Value Graphs
- Firewall Custom Reports: F Firewall Connections Client Graphs
- Firewall Custom Reports: F Firewall Connections Errors Graphs
- Firewall Custom Reports: F Firewall Connections PVA Assisted Connections Graphs
- Firewall Custom Reports: F Firewall Connections PVA Client Graphs
- Firewall Custom Reports: F Firewall Connections PVA Server Graphs
- Firewall Custom Reports: F Firewall Connections Report
- Firewall Custom Reports: F Firewall Connections Server Graphs
- Firewall Custom Reports: F SSL Connections Graph
- Firewall Custom Reports: Fortinet Fortigate Firewall Report
- Firewall Custom Reports: Fortinet Fortigate Firewall Sessions Graphs
- Firewall Custom Reports: Juniper Firewall Connections Graphs
- Firewall Custom Reports: Juniper Firewall Denied Pkts Graphs
- Firewall Custom Reports: Juniper Firewall Permitted Graphs
- Firewall Custom Reports: Juniper Firewall Report
- Firewall Custom Reports: Palo Alto Firewall Connections Active Graphs
- Firewall Custom Reports: Palo Alto Firewall Connections Report
- Firewall Custom Reports: Palo Alto Firewall Connections Util Graphs
- Firewall Custom Reports: Palo Alto Firewall Connections Zone Graph
- Firewall Custom Reports: Palo Alto Firewall Connections Zone Report
- Interface Custom Reports: Apcon Interface Bps Graphs
- Interface Custom Reports: Apcon Interface Bytes Graphs
- Interface Custom Reports: Apcon Interface Pkts Graphs
- Interface Custom Reports: Apcon Interface Report
- Interface Custom Reports: Apcon Interface Util Graphs
- Interface Custom Reports: Cisco IF Extension Graphs
- Interface Custom Reports: Cisco IF Extension Report
- Interface Custom Reports: IP System Stats Bytes Graphs
- Interface Custom Reports: IP System Stats Discards Graphs
- Interface Custom Reports: IP System Stats Forwarded Graphs
- Interface Custom Reports: IP System Stats Fragments Graphs
- Interface Custom Reports: IP System Stats No Routes Graphs
- Interface Custom Reports: IP System Stats Pkts Graphs
- Interface Custom Reports: IP System Stats Reassembly Graphs
- Interface Custom Reports: IP System Stats Report
- Interface Custom Reports: IP System Stats Rx Delivers Graphs
- Interface Custom Reports: IP System Stats Rx Errors Graphs
- Interface Custom Reports: IP System Stats Tx Requests Graphs
- Interface Custom Reports: Interface EtherLike Graphs
- Interface Custom Reports: Interface EtherLike Report
- Interface Custom Reports: Optical Signal Monitoring – ADVA Graph
- Interface Custom Reports: Optical Signal Monitoring – ADVA Report
- Interface Custom Reports: Optical Signal Monitoring – NBS Graph
- Interface Custom Reports: Optical Signal Monitoring – NBS Report
- Interface Custom Reports: Sensor – Optical – Cisco Report
- Interface Custom Reports: Sensor – Optical – Cisco dBm Graph
- Interface Custom Reports: Sensor – Optical – Cisco mW Graph
- Load Balancer Custom Reports: Alteon Group Octets Graph
- Load Balancer Custom Reports: Alteon Group Sessions Graph
- Load Balancer Custom Reports: Alteon Group Sessions Report
- Load Balancer Custom Reports: Alteon Real Server Octets Graph
- Load Balancer Custom Reports: Alteon Real Server Sessions Graph
- Load Balancer Custom Reports: Alteon Real Server Sessions Report
- Load Balancer Custom Reports: Alteon Virtual Server Octets Graph
- Load Balancer Custom Reports: Alteon Virtual Server Sessions Graph
- Load Balancer Custom Reports: Alteon Virtual Server Sessions Report
- Load Balancer Custom Reports: F Load Balancer LTM Pool Active Members Graphs
- Load Balancer Custom Reports: F Load Balancer LTM Pool Bytes Graphs
- Load Balancer Custom Reports: F Load Balancer LTM Pool Connections Graphs
- Load Balancer Custom Reports: F Load Balancer LTM Pool Member Bytes Graphs
- Load Balancer Custom Reports: F Load Balancer LTM Pool Member Connections Graphs
- Load Balancer Custom Reports: F Load Balancer LTM Pool Member Packets Graphs
- Load Balancer Custom Reports: F Load Balancer LTM Pool Member Stats
- Load Balancer Custom Reports: F Load Balancer LTM Pool Packets Graphs
- Load Balancer Custom Reports: F Load Balancer LTM Pool Stats
- Load Balancer Custom Reports: F Load Balancer LTM Virtual Server Bytes Graphs
- Load Balancer Custom Reports: F Load Balancer LTM Virtual Server Connections Graphs
- Load Balancer Custom Reports: F Load Balancer LTM Virtual Server Packets Graphs
- Load Balancer Custom Reports: F Load Balancer LTM Virtual Server Stats
- Power Systems Custom Reports: PoE Device – Cisco Stats
- Power Systems Custom Reports: PoE Device Power Graphs
- Power Systems Custom Reports: PoE Device Stats
- Power Systems Custom Reports: PoE Device Usage Threshold Graphs
- Power Systems Custom Reports: PoE Interface – Cisco Power Graphs
- Power Systems Custom Reports: PoE Interface – Cisco Stats
- Power Systems Custom Reports: PoE Interface Invalid Signature Counter Graphs
- Power Systems Custom Reports: PoE Interface Overload Counter Graphs
- Power Systems Custom Reports: PoE Interface Power Denied Counter Graphs
- Power Systems Custom Reports: PoE Interface Short Circuit Counter Graphs
- Power Systems Custom Reports: PoE Interface Stats
- Power Systems Custom Reports: Power Systems Battery Remaining Graphs
- Power Systems Custom Reports: Power Systems Battery Report
- Power Systems Custom Reports: Power Systems Input Graph
- Power Systems Custom Reports: Power Systems Input Report
- Power Systems Custom Reports: Power Systems Output Graph
- Power Systems Custom Reports: Power Systems Output Report
- Power Systems Custom Reports: Sensor – Power – Amps Graph
- Power Systems Custom Reports: Sensor – Power – Amps Report
- Power Systems Custom Reports: Sensor – Power – Volts Graph
- Power Systems Custom Reports: Sensor – Power – Volts Report
- Power Systems Custom Reports: Sensor – Power – Watts Graph
- Power Systems Custom Reports: Sensor – Power – Watts Report
- QoS Custom Reports:Cisco CB QoS Class Data
- QoS Custom Reports:Cisco CB QoS ClassMap Config
- QoS Custom Reports:Cisco CB QoS Match BitRate Graphs
- QoS Custom Reports:Cisco CB QoS Match Config
- QoS Custom Reports:Cisco CB QoS Match Data
- QoS Custom Reports:Cisco CB QoS Policy BitRate Graphs
- QoS Custom Reports:Cisco CB QoS Policy and Class Config
- QoS Custom Reports:Cisco CB QoS PolicyMap Config
- QoS Custom Reports:Cisco CB QoS Queue Config
- QoS Custom Reports:Cisco CB QoS Queue Data
- QoS Custom Reports:Cisco CB QoS Queue Used Graphs
- Remote Service Custom Reports: Cisco IPSLA ICPIF Graph
- Remote Service Custom Reports: Cisco IPSLA Jitter Dst to Src Graph
- Remote Service Custom Reports: Cisco IPSLA Jitter Graph
- Remote Service Custom Reports: Cisco IPSLA Jitter Report
- Remote Service Custom Reports: Cisco IPSLA Jitter Src to Dst Graph
- Remote Service Custom Reports: Cisco IPSLA MOS Graph
- Remote Service Custom Reports: Cisco IPSLA RTT Completion Time Graph
- Remote Service Custom Reports: Cisco IPSLA RTT Report
- Remote Service Custom Reports: Juniper Ping Report
- Remote Service Custom Reports: Juniper Ping Rtt Graphs
- Remote Service Custom Reports: Software Defined Custom Reports:
- Remote Service Custom Reports: T Peer Status Report
- Topology Custom Reports: BGP Peer FSM Established Time Graphs
- Topology Custom Reports: BGP Peer FSM Established Transitions Graphs
- Topology Custom Reports: BGP Peer Messages Graphs
- Topology Custom Reports: BGP Peer Report
- Topology Custom Reports: BGP Peer Rx Update Elapsed Time Graphs
- Topology Custom Reports: BGP Peer Updates Graphs
- Topology Custom Reports: Cisco BGP Peer Prefix Graphs
- Topology Custom Reports: Cisco BGP Peer Prefix Report
- Topology Custom Reports: Cisco Discovery Protocol Report
- Topology Custom Reports: Cisco EIGRP Ack Graphs
- Topology Custom Reports: Cisco EIGRP Hello Graphs
- Topology Custom Reports: Cisco EIGRP Neighbor Count Graphs
- Topology Custom Reports: Cisco EIGRP Peer Report
- Topology Custom Reports: Cisco EIGRP Query Graphs
- Topology Custom Reports: Cisco EIGRP Reply Graphs
- Topology Custom Reports: Cisco EIGRP Retransmission Timeout Graphs
- Topology Custom Reports: Cisco EIGRP Retransmit Graphs
- Topology Custom Reports: Cisco EIGRP Route Graphs
- Topology Custom Reports: Cisco EIGRP SRTT Graphs
- Topology Custom Reports: Cisco EIGRP Stats Report
- Topology Custom Reports: IP Address Table (Including IPv) Report
- Topology Custom Reports: IP Address Table Report
- VPN Custom Reports: Checkpoint VPN Active IPsec Tunnels Graphs
- VPN Custom Reports: Checkpoint VPN Sessions Errors Graphs
- VPN Custom Reports: Checkpoint VPN Sessions Packets Graphs
- VPN Custom Reports: Checkpoint VPN Sessions Report
- VPN Custom Reports: Checkpoint VPN Sessions User Tunnels Graphs
- VPN Custom Reports: Cisco VPN IPSec Active Tunnels Graphs
- VPN Custom Reports: Cisco VPN IPSec Global Bytes Graphs
- VPN Custom Reports: Cisco VPN IPSec Global Packets Graphs
- VPN Custom Reports: Cisco VPN IPSec Global Report
- VPN Custom Reports: Cisco VPN IPSec Tunnels Bytes Graphs
- VPN Custom Reports: Cisco VPN IPSec Tunnels Packets Graphs
- VPN Custom Reports: Cisco VPN IPSec Tunnels Report
- VPN Custom Reports: Cisco VPN Sessions Email Graphs
- VPN Custom Reports: Cisco VPN Sessions Graphs
- VPN Custom Reports: Cisco VPN Sessions IPSec Graphs
- VPN Custom Reports: Cisco VPN Sessions LAN to LAN Graphs
- VPN Custom Reports: Cisco VPN Sessions Load Balancing Graphs
- VPN Custom Reports: Cisco VPN Sessions Report
- VPN Custom Reports: Cisco VPN Sessions SVC Sessions Graphs
- VPN Custom Reports: Cisco VPN Sessions User Graphs
- VPN Custom Reports: Cisco VPN Sessions User Group Graphs
- VPN Custom Reports: Cisco VPN Sessions Webvpn Graphs
- VPN Custom Reports: Citrix Netscaler AAA Graphs
- VPN Custom Reports: Citrix Netscaler AAAATM Graphs
- VPN Custom Reports: Citrix Netscaler Auth Graphs
- VPN Custom Reports: Citrix Netscaler Authorization Report
- VPN Custom Reports: Citrix Netscaler ICA Graphs
- VPN Custom Reports: Citrix Netscaler Session Report
- VPN Custom Reports: F APM Sessions
- VPN Custom Reports: F APM Sessions Graphs
- VPN Custom Reports: Fortinet Fortigate SSL Tunnels Graphs
- VPN Custom Reports: Fortinet Fortigate SSL Users Graphs
- VPN Custom Reports: Fortinet Fortigate VPN Stats Report
- VPN Custom Reports: Fortinet Fortigate Web Sessions Graphs
- VPN Custom Reports: Juniper Pulse VPN Graph
- VPN Custom Reports: Juniper Pulse VPN Report
- VPN Custom Reports: Palo Alto VPN Graph
- VPN Custom Reports: Palo Alto VPN Report
- VPN Custom Reports: SonicWall VPN Users Graph
- VPN Custom Reports: SonicWall VPN Users Report
- VPN Custom Reports: Voice Custom Reports:
- VPN Custom Reports: Cisco Active DS Report
- VPN Custom Reports: Cisco Active DSs Graphs
- VPN Custom Reports: Cisco Call Stats Calls Graphs
- VPN Custom Reports: Cisco Call Stats Report
- VPN Custom Reports: Cisco Call Stats Total Active Connections Graphs
- WAN Custom Reports: Cisco APPNAV Report
- WAN Custom Reports: Cisco WAAS Graphs
- WAN Custom Reports: Cisco WAAS Report
- WAN Custom Reports: Riverbed WAN Accelerator Bandwidth Optimization Bps Graphs
- WAN Custom Reports: Riverbed WAN Accelerator Bandwidth Optimization Bps Report
- WAN Custom Reports: Riverbed WAN Accelerator Graphs
- WAN Custom Reports: Riverbed WAN Accelerator Report
- Wireless Custom Reports: Cisco WAN G Bytes Graphs
- Wireless Custom Reports: Cisco WAN G EcIo Graphs
- Wireless Custom Reports: Cisco WAN G Nearby Cells Report
- Wireless Custom Reports: Cisco WAN G RSSI Graphs
- Wireless Custom Reports: Cisco WAN G Report
- Wireless Custom Reports: Cisco WAN G Retries Remaining Graphs
- Wireless Custom Reports: Cisco WAN G Temperature Graphs
- Wireless Custom Reports: Cisco WAN G RSRP Graphs
- Wireless Custom Reports: Cisco WAN G RSRQ Graphs
- Wireless Custom Reports: Cisco WAN G Report
- Wireless Custom Reports: Cisco WAN G SINR Graphs
- Wireless Custom Reports: Cisco WAN G SNR Graphs
- Wireless Custom Reports: Ubiquiti AirMAX Graphs
- Wireless Custom Reports: Ubiquiti AirMAX Report
- Wireless Custom Reports: Ubiquiti Radio Report
- Wireless Custom Reports: Ubiquiti Wireless Statistics Bps Graphs
- Wireless Custom Reports: Ubiquiti Wireless Statistics CCQ Graphs
- Wireless Custom Reports: Ubiquiti Wireless Statistics RSSI Graphs
- Wireless Custom Reports: Ubiquiti Wireless Statistics Report
- Wireless Custom Reports: Ubiquiti Wireless Statistics Signal Strength Graphs
- Wireless Custom Reports: Wireless AP Cisco Graph
- Wireless Custom Reports: Wireless AP Cisco Report
- Wireless Custom Reports: Wireless AP Client Count Graph
- Wireless Custom Reports: Wireless AP Report
Managing Availability and Display of Reports
There are a couple of factors which determine the visibility of reports:
- Global report settings
- User-specific report visibility settings
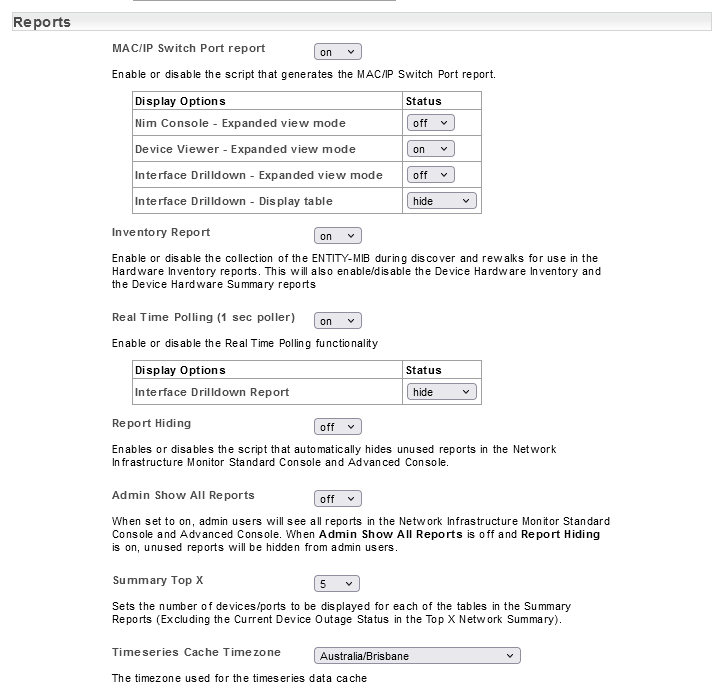
Global Report Settings
The Admin Tool contains settings which impact the visibility of MAC-IP and Inventory reports, unused reports, and the real-time interface poller.
These settings can be reviewed and updated altered as needed:
- Select Admin Tool > Network Discovery – Advanced Options > Advanced Options
- Locate the settings in the Reporting section and update as needed
- Click Save
User-specific Report Visibility
By default a new Statseeker user account has no visibility of your network via Statseeker. To allow the user to access reports and view data collected from your network you need to associate the user account with one or more groups containing network infrastructure and reports. For more details on this process see Managing User Access & Permissions with Grouping.