* Legacy Documentation for Statseeker v5.5.5 *
Index
- Overview
- Configuring Alerts
- Editing Alerts
- Cloning an Alert
- Enabling/Disabling Alerts
- Deleting Alerts
- Syslog, Trap and Event Data Historical Records
Overview
Statseeker can be used as a comprehensive proactive, and reactive, alerting solution. Alerts can be triggered for:
- Threshold Events – by configuring thresholds for specific metrics you can have Statseeker alert to you when, among other things, your network is experiencing unusual activity, or a device is nearing capacity. For more details, see Threshold Configuration.
- Device Events – device level events, such as ping state changes, on any devices monitored by Statseeker
- Interface Events – interface level events, such as ifOperStatus state changes, on any interfaces monitored by Statseeker
- Syslog Events – if your network contains devices that have been configured to output messages to a remote syslog server, then these devices can send those messages to Statseeker. Statseeker can review these logs and use the content to trigger alerts relating to those events.
- SNMP Trap Events – if your network contains devices that have been configured to output SNMP trap messages to Statseeker, then Statseeker can review these messages and trigger alerts based on their content.
Alerting is achieved through:
- Targeted Emails: with a range of email templates, and the ability to customize those templates, it is simple to have the alert contain the level of detail needed to pursue the issue efficiently. Since the alerts are delivered via email you will need to configure Statseeker to send those alerts, see Email Configuration for more information.
- Syslog Messages: Statseeker events can be used to trigger an alert which will send a syslog message to a specified IP address; useful if you have a 3rd party solution monitoring and responding to syslog messages
- Custom Script: run literally any shell script that you create; we offer you the option to respond to an alert trigger in any way you want
Once an alert has been configured, every recorded event satisfying the requirements for the alert will trigger the alert. In some instances, during scheduled maintenance for example, you may wish to suppress some alerts. This can be achieved by disabling those alerts, see Disabling Alerts for more.
When a more targeted approach is needed, Event Management rules can be defined to discard a specific type of event from a specified device (or group of devices). For more information, see Event Management.
Configuring Alerts
To configure a new alert:
- Select Administration Tool > Alerting / Event Management > Alerting
This will display a list of currently configured alerts.
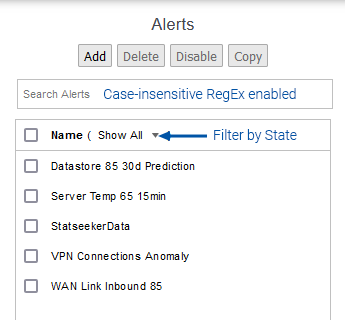
- Click Add
This will display the New Alert screen.
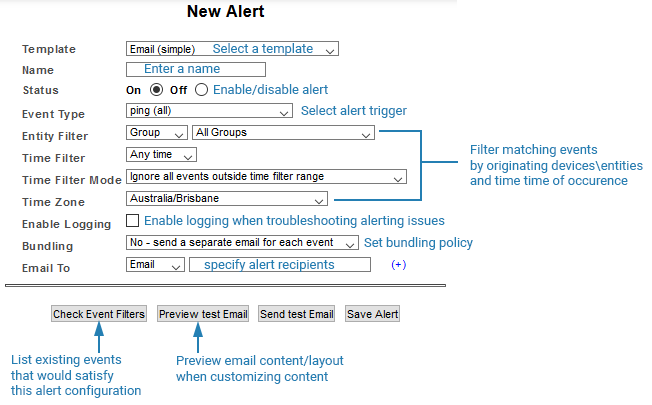
| Field | Description |
| Template | Alert template to use, for details on templates see Alert Templates |
| Name | Name of the alert configuration |
| Status |
|
| Event Type | What event type will trigger the alert |
| Entity Filter | Only events originating from the specified devices/groups can trigger alerts |
| Time Filter | Matching events which occur within the specified time period will generate alerts. For more information on generating these, see Time Filters |
| Time Filter Mode | Determines if the alert is triggered by events in effect at the beginning of the alerting period. E.g. You have an alert which references an ‘on transition’ threshold. At the start of your alerting period (as specified by the alert time filter), this threshold is in breach.
|
| Time Zone | Used in conjunction with the time filter |
| Enable Logging | Only enable logging when troubleshooting alerting issues |
| Bundling | Bundling policy to be used, for details see Bundling Policies |
| Email To |
|
| Email Subject/Body | Depending on the template, configure the email subject and contents, see Email Shortcodes for more information |
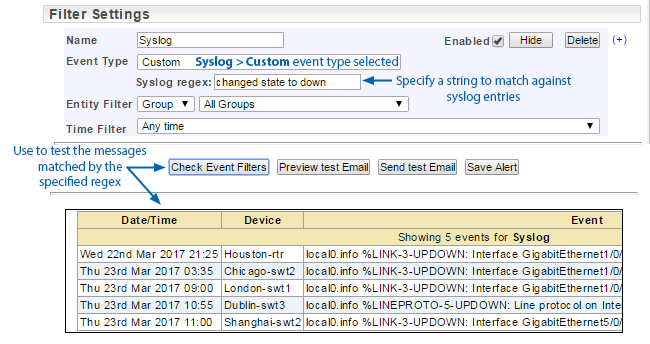
| Check Event Filters | Runs the alert configuration against the Events database and returns recent events that would trigger the alert. |
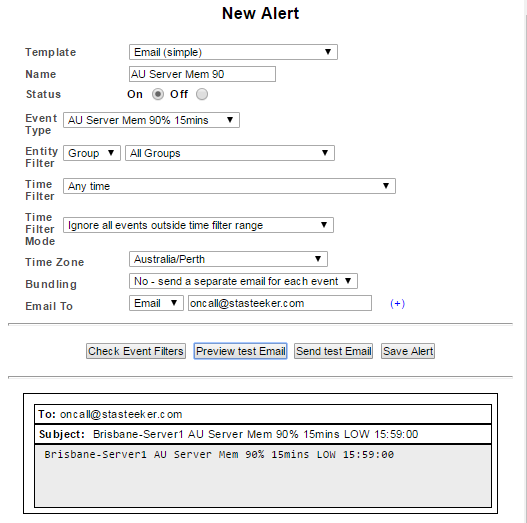
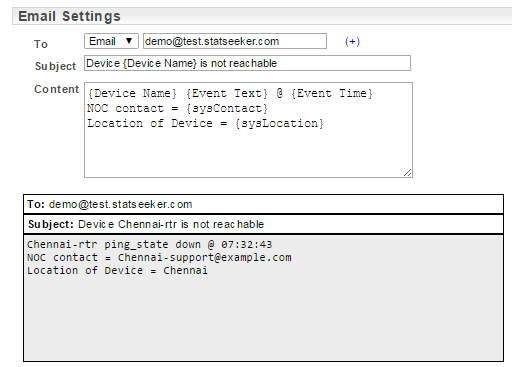
| Preview Test Email | Display a preview of the email content. This is useful when adding shortcodes to your alert email subject line or body. |
| Send Test Email | Test mail server and alert configuration by sending a test alert email |
Alert Templates
There are a range of email templates that allow varying levels of customization to the alert configuration and alert email content.
Email (simple) – a single event filter set and no email content customization
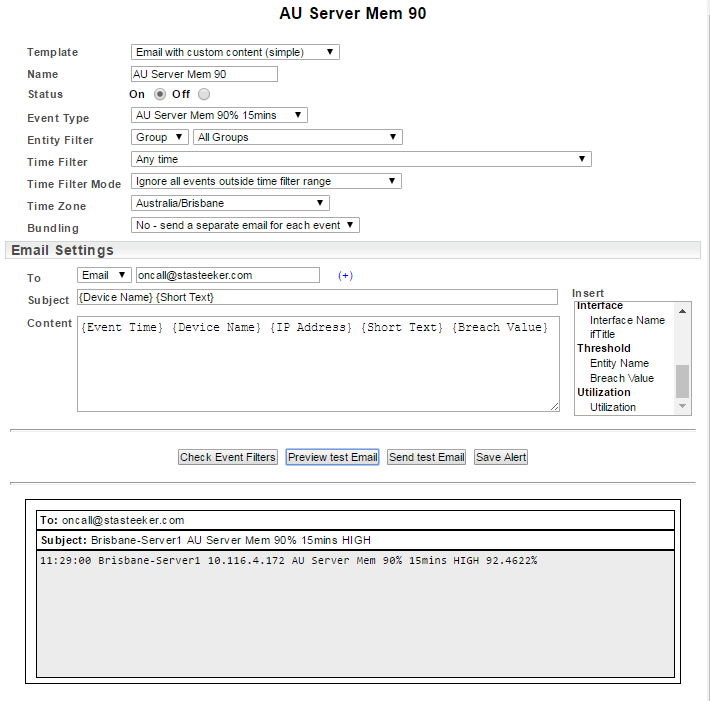
Email with custom content (simple) – a single event filter set and basic email content customization
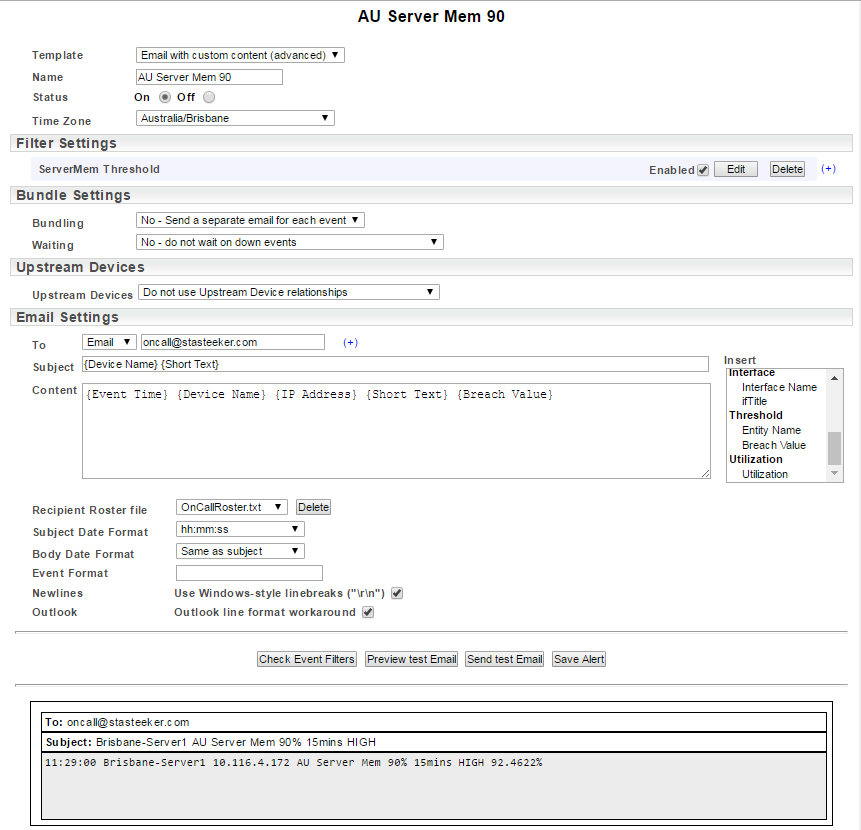
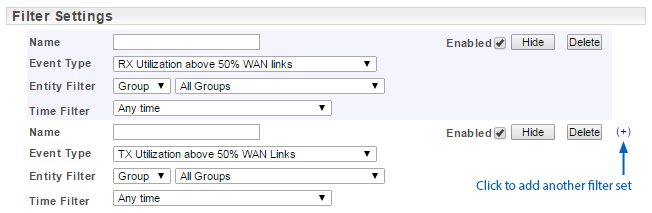
Email with custom content (advanced) – multiple event filter sets, advanced bundling options, upstream device relationships and advanced email content customization.
- Multiple event filters: if any of the specified event filter sets is satisfied, an alert will be sent
- Bundling: set a period within which to bundle alerts (events occurring outside of this period are not bundled) and a schedule for the sending of bundled alerts
- Upstream Devices: suppress alerts for downstream devices when alerts exist for their upstream neighbors. See Upstream Device Configuration.
See Working with the Advanced Template for more information on the options available with this template.
Send syslog message – send an alert containing a syslog message
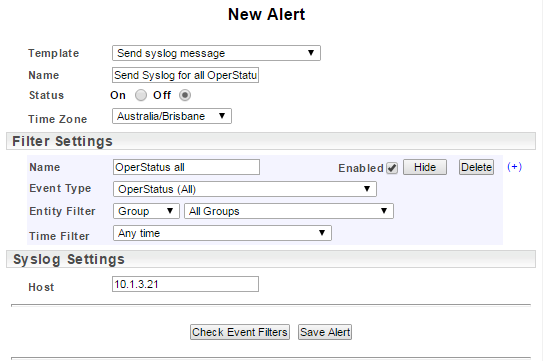
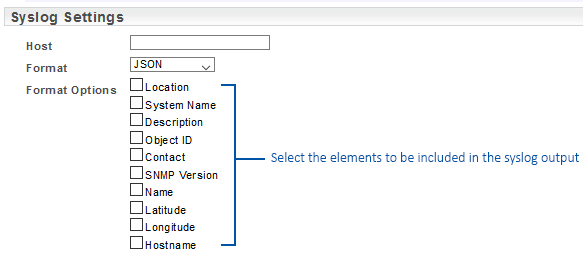
The syslog output can be in either the legacy Statseeker format, or an industry standard JSON format. The JSON format allows you to configure the message content to suit your requirements
The legacy format is contains the following data:
- Message number
- Timestamp
- Facility code
- Application/Process
- Loghost
- Message
The JSON format includes all of the details from the Statseeker format and offers additional fields containing configuration data from the message source.
Sample basic syslog output for device down event:
010642 2019-08-28 15:29:51 NewYork-srv1 10.2.26.138 user.notice root: 10.124.1.1 Upstream-Neighbour-1 ping_state down,20671
Sample syslog JSON output for device down event with additional message elements selected:
010682 2019-08-28 15:32:51 NewYork-srv1 10.2.26.138 user.notice root:
{
“product”: “Statseeker”,
“version”: “5.4.5.1908280800”,
“source”: “Upstream-Neighbour-1”,
“event_type”: “ping_state”,
“state”: “down”,
“duration”: 150,
“ipaddress”: “10.124.1.1”,
“sysLocation”: “NewYork”,
“sysName”: “Upstream-Neighbour-1.example.com”,
“sysDescr”: “Cisco IOS Software, C2960 Software (C2960-LANBASEK9-M), Version 12.2(46)SE, RELEASE SOFTWARE (fc2) Copyright (c) 1986-2008 by Cisco Systems, Inc. Compiled Thu 21-Aug-08 15:59 by nachen”,
“sysObjectID”: “CISCO-PRODUCTS-MIB.catalyst2960G8TC”,
“sysContact”: “NewYork-support@example.com”,
“snmp_version”: 2,
“manual_name”: null,
“latitude”: 40.7306,
“longitude”: -73.9352,
“hostname”: null
}
Run a custom script – an event satisfying the filters will trigger the specified custom script.
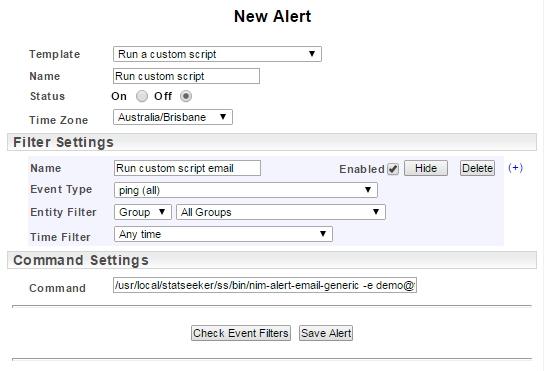
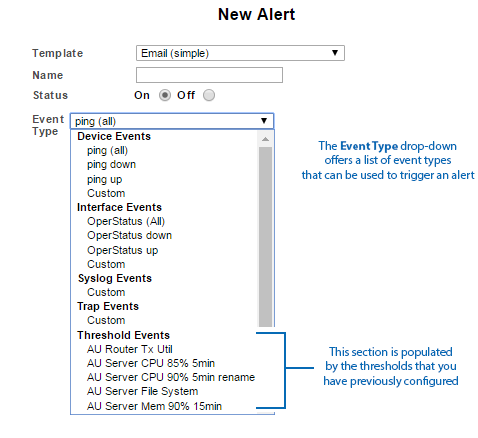
Event Types
The Event Type specifies the type of event that will be used to trigger the alert. The content of the drop-down is a combination of pre-configured options and references to any Threshold that has been configured.
Selecting the Custom option, available under each of the main Event Type categories, will display a RegEx field. The contents of this field will be used to match against the relevant event records, trap, and log messages. While device and interface event types offer a range of pre-configured triggers, the Syslog and SNMP Trap event types require that you specify a string in the associated RegEx field.
Bundling Policies
Bundling refers to holding onto alerts for a specified period of time, and then sending all alerts generated over that period in a single alert email. This allows for a more efficient handling of events where several alerts are raised in a very short period of time, often in response to a single cause. Each alert configuration contains a bundling policy specific to that alert configuration, consequently, only alerts generated by that configuration are bundled according to that bundling policy.
Basic bundling options are available for the Email (simple) and Email with custom content (simple) templates. These options are:
- No – no bundling occurs, and an alert is sent for each event
- Yes – bundle the alerts for a specified duration
- The duration of the bundling period
Once an event occurs and an alert is generated, Statseeker will hold onto the alert, and collect any other alert generated from the same alert configuration, until the specified bundling period is complete. At that time, a single alert email is sent detailing every alert collected over the bundling period.
Advanced bundling options are available for the Email with custom content (advanced) template. The bundling options available here are:
- No – no bundling occurs, and an alert is sent for each event
- Yes, with a duration – as per the bundling options offered with the simple templates
- Yes, choose bundle times
When the bundle times option is selected the following fields are made available:
- Bundle from – the time of day to begin bundling
- Send email at – the time of day and days of the week, to stop bundling and send an alert email
In addition, the advanced template offers a Waiting field. This field is used to, optionally, specify an alternate action to be taken when device up/down events are received. The options here are:
- No – do not wait, send alerts on down events as they are received
- Yes, with a duration – wait for the specified duration prior to sending alerts on device down events. This option exposes a field to specify the duration.
- Yes, wait over a specified period – this option exposes several additional fields
- Behavior
- Non-matching events sent as normal – events other than ping up/down are sent as normal during the specified waiting period
- Only send up/down events relating to this period – ping up/down events outside of the specified period do not generate alerts
- Start waiting – the start-time for the waiting policy
- Finish waiting – the end-time for the waiting policy
- Behavior
Email Shortcodes
Statseeker uses shortcodes to enable customization of email subject and body content. A shortcode is a placeholder to mark the inclusion of variable text strings, in this case, text relating to the event generating the alert.
Example:
| Shortcode | Description |
| Event Time | The time the event which triggered the alert was recorded in the format hh:mm:ssE.g. 09:44:02 |
| Event Text | The text description for the event.E.g. IF-MIB.ifOperStatus up |
| Short Text | The short text for the event.E.g. Oper UP |
| Device Name | The name of the device.E.g. Warsaw-rtr |
| IP Address | The IP address for the device.E.g. 10.100.57.254 |
| sysContact | The defined contact for issues relating to the device.E.g. Warsaw-support@example.com |
| sysLocation | The defined location of the device.E.g. Warsaw |
| sysDescription | The devices’ system description.E.g. Juniper Networks, Inc. srx3600 internet router, kernel JUNOS 10.0R3.10 #0: 2010-04-16 07:35:16 UTC builder@ormonth.juniper.net:/volume/build/junos/10.0/release/10.0R3.10/obj-powerpc/bsd/sys/compile/JUNIPER-SRX Build date: 2010-04-16 06:36:30 UTC Copy |
| sysName | The devices’ system name.E.g. warsaw-rtr@example.com |
| Interface Name | Available with interface alerts.The interface name.E.g. Gi0/1 |
| ifTitle | Available with interface alerts.The interface title.E.g. Link to SanJose-core |
| Duration | Available with ping_up and OperStatus alerts.The duration that the device/interface was in a down state.E.g. 2h 11m 28s |
| Breach Value | Available with threshold alerts. The value of the metric at the time that the event was recorded.E.g. 93.43% |
| Utilization | Available with CPU, memory, and file-system alerts.The % of the resource (CPU, memory, file system) used.E.g. 84.6% |
Working with the Advanced Template
The Email with custom content (advanced) template offers a high degree of customizability in relation to both the alert configuration and the content.
The template allows for multiple event filters; a match against any of the configured filters will trigger an alert.
- Bundle Settings: contains additional configuration options for handling device/interface up/down (ping up/down and OperStatus up/down) events, see Bundling Policies for more details on these options
- Upstream Device: template also offers the ability to use your upstream device configurations to suppress ping/OperStatus down alerts from downstream devices when an alert exists for their upstream neighbor, see Upstream Device Configuration for details
- Recipient Roster File: (*.txt) allows you to define alternate alert recipients based upon a pre-configured roster. Each line in the roster file should contain a start date-time followed by one or more email addresses.
The format for the date-time is YYYY MM DD HH MM SS.
Example: 2017 02 03 17 30 00, February the 3rd at 5:30pm.
The format for the roster file is:
{date-time} {email1} {email2} … {emailn}{date-time2} {email1} {email2} … {emailn}{date-time3} {email1} {email2} … {emailn}
Example:
2017 02 03 17 30 00 sysadmin1@example.com sysadmin2@example.com
2017 02 10 17 30 00 sysadmin3@example.com sysadmin4@example.com
2017 02 17 17 30 00 sysadmin1@example.com sysadmin2@example.com
2017 02 24 17 30 00 sysadmin3@example.com sysadmin4@example.com
2017 03 03 17 30 00 sysadmin1@example.com sysadmin2@example.com
Once a date-time is reached, all alerts generated from this alert configuration will be addressed to the specified email addresses. When the next date-time is reached, the recipients are replaced by those specified.
- Subject Date Format: select an alternate date-time format to be used for events times when the {Event Time} shortcode is included in the email subject line
- Body Date Format: select an alternate date-time format to be used for events times when the {Event Time} shortcode is included in the email body
- Event Format: replace the default content of the {Event Text} with your own custom content via the {Short Text} shortcode
The format for this is: /event_string_to_match/replacement_string/.
E.g.
Event Format: /ping_state down/DOWN/
Content: {Event Time} {Device Name} {Short Text}
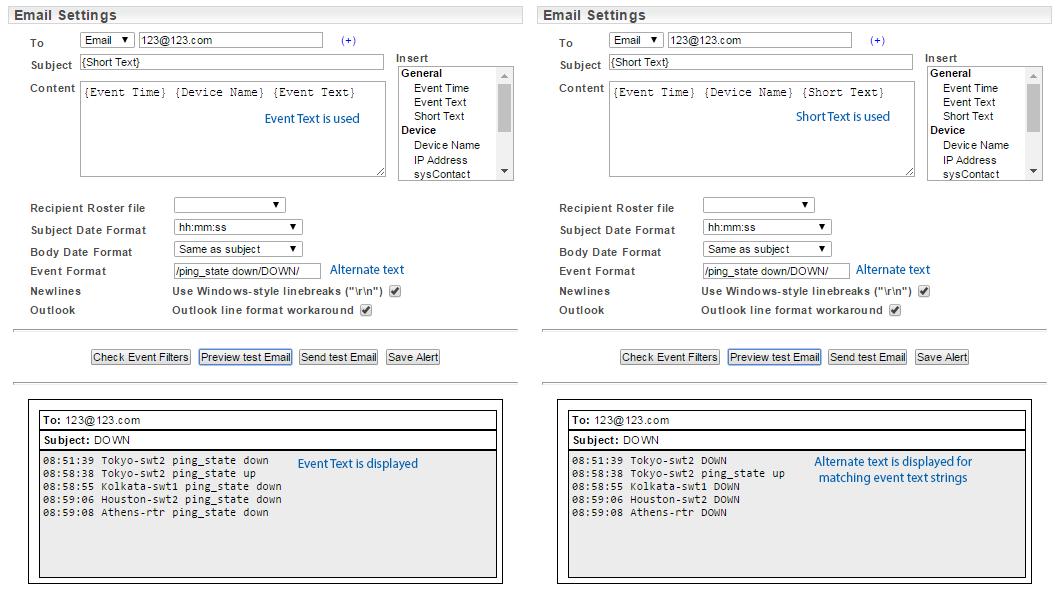
The advanced template also exposes additional email body content formatting options that are hidden in other templates.
- Newlines: better email body content layout for Windows end users, disable when email recipients are non-Windows users
- Outlook: better email body content layout for Windows Outlook users, disable when email recipients are non-Windows users
Editing Alerts
To edit an existing alert:
- Select Administration Tool > Alerting / Event Management > Alerting
- Select the alert from the list, populating the configuration panel
- Modify the alert configuration as required
- If you modify the alert filters, then use Check Event Filters to preview the impact of those changes
- If you modify the alert email subject line or body content, then use Preview Test Email to preview the impact of those changes
- Click Save Alert
Enabling/Disabling Alerts
To enable/disable alerts:
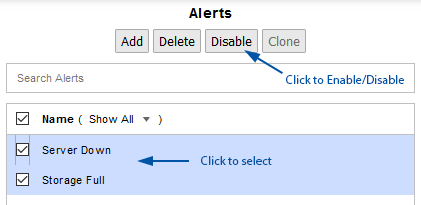
- Select Administration Tool > Alerting / Event Management > Alerting
- Click to select the alert/s and click Enable/Disable
To disable an alert from within the alert configuration:
- Select Administration Tool > Alerting / Event Management > Alerting
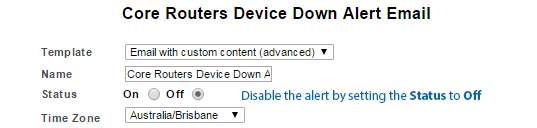
- Select the alert from the list, populating the configuration panel
- Set Status to Off
- Click Save Alert
The alert is now disabled, and no action will be taken based on this alert configuration until it is enabled again.
Cloning an Alert
To clone an existing alert configuration:
- Select Administration Tool > Alerting / Event Management > Alerting
- Select the configuration to be cloned
- Click Clone
A new alert configuration will be created, but not saved, be sure to save the alert prior to leaving the configuration screen.
- Modify the alert configuration as required
- If you modify the alert filters, then use Check Event Filters to preview the impact of those changes
- If you modify the alert email subject line or body content, then use Preview Test Email to preview the impact of those changes
Deleting Alerts
Deleting the alert configuration prevents the alert from being triggered and removes the alert configuration. To prevent an alert from being triggered but retain the alert configuration, Disable the alert rather than deleting it.
To delete an existing alert:
- Select Administration Tool > Alerting / Event Management > Alerting
- Select the alert/s from the list and click Delete
- Click OK to confirm the action
The alert has now been removed from Statseeker.
Syslog, Trap, and Event Data Historical Records
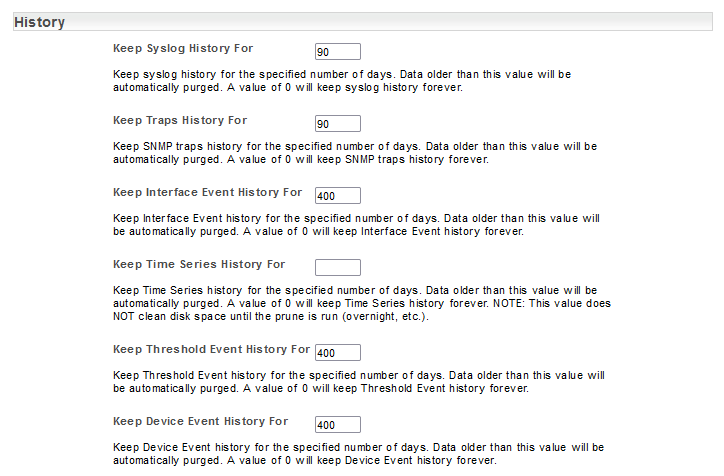
While timeseries data is stored indefinitely, by default Statseeker stores syslog messages, SNMP Trap messages, and event (device, interface and threshold) records for a limited amount of time:
- Syslog – 90 days
- SNMP Traps – 90 days
- Interface Events – 400 days
- Threshold Events – 400 days
- Device Events – 400 days
These values can be altered as needed and the records can be kept indefinitely if required (set storage time to 0). To update the default values:
- Select Admin Tool > Network Discovery – Advanced Options > Advanced Options
- Locate the settings in the History section and update as needed
- Click Save