Legacy Documentation for Statseeker version 5.5.3
Index
- Overview
- Whitelisting Map Source
- Panel Configuration
- Example Configurations
Overview
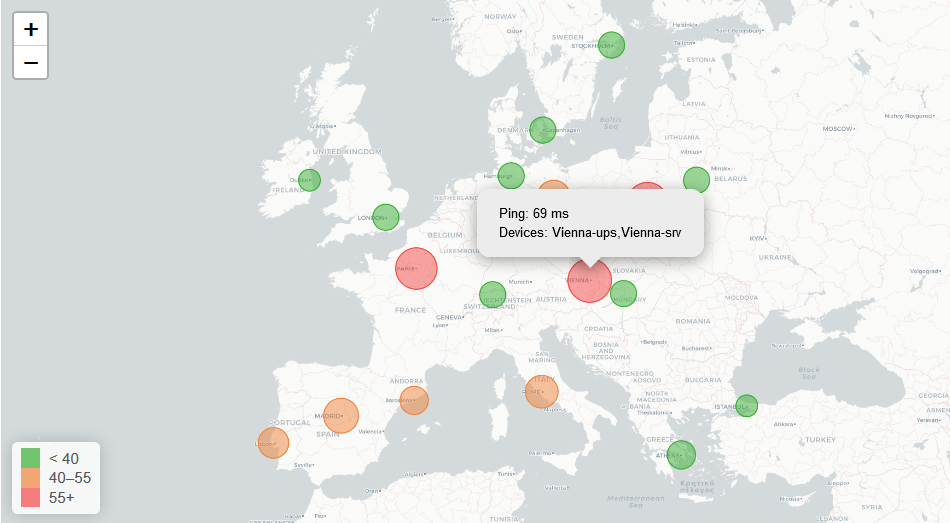
Display data related to geographical locations on a worldmap background.
- On an individual device level from the General > Device Details report by clicking the appropriate field in the report
- As a bulk update via auto-grouping, see Using Auto-Grouping to Apply Bulk Configuration Changes
- Via the API
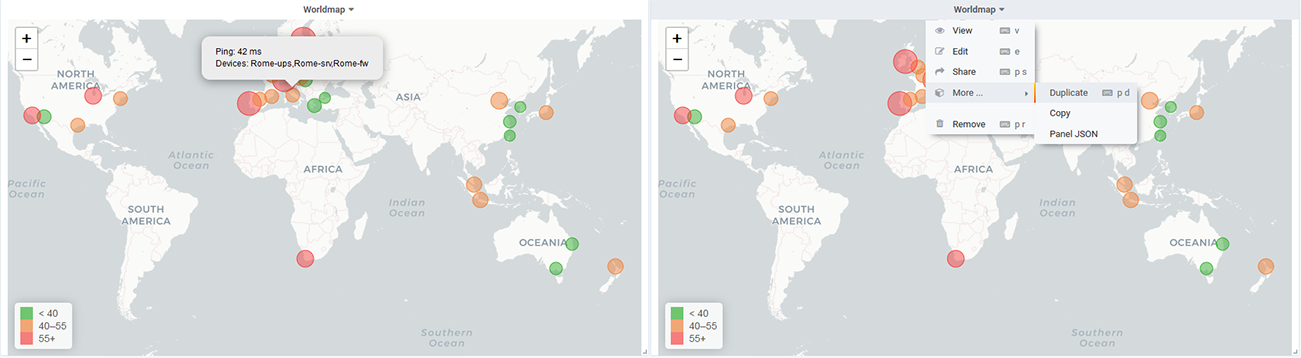
Clicking the panel header opens the panel menu, offering the following options:
- View – view the panel in fullscreen mode
- Edit – edit the panel configuration
- Share – options for sharing the panel contents with others, both internal and external to your organization
- More
- Duplicate – place a duplicate of the panel on the current dashboard
- Copy – copy the dashboard configuration in order to add the panel to another dashboard
- Panel JSON – view/edit the JSON underlying the panel configuration
- Remove – delete the panel from the dashboard
Whitelisting Map Source
The maps themselves are an external resource provided via a webservice so if your browser is unable to access this resource, then while Statseeker can provide you with the data, the map is unavailable, and the panel will be blank. In the event that your map consumers have limited access to internet-based resources you will need to allow access to:
- https://cartodb-basemaps-b.global.ssl.fastly.net
Panel Configuration
You can edit the map configuration by:
- Clicking the panel title to open the panel menu and selecting Edit
General
The General tab is used to configure the panel title, description, and panel-level links.
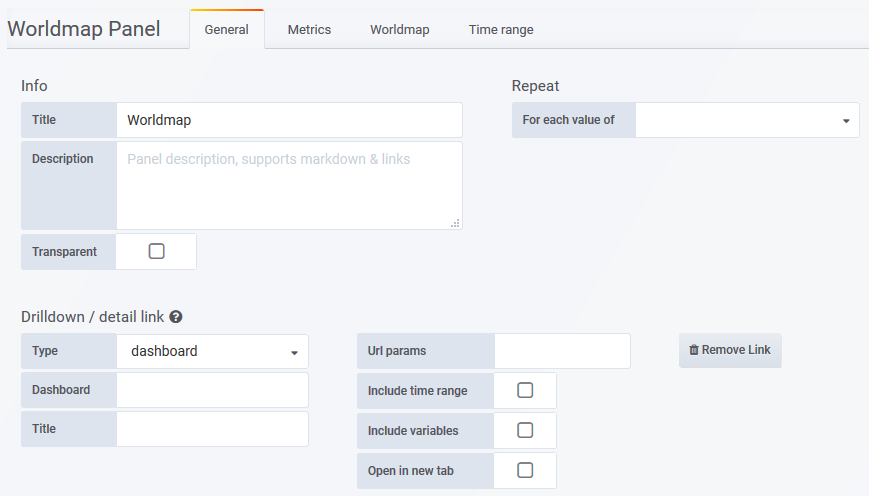
- Title – the panel title, displayed at the top
- Description – the panel description, displayed on hover of info icon in the upper left corner of the panel
- Transparent – if checked, removes the solid background of the panel (default not checked)
- Repeat – repeat a panel for each value of a variable, see Variables for details
- Drilldown – configure panel-level links displayed on hover of info icon in the upper left corner of the panel
- Type – link to a Statseeker dashboard or any URL
- Dashboard/URL – the dashboard or URL to link to
- Title – the display name for the link
- URL params – key=value pairs to be appended to the end of the URL as parameters
- Include time range – include the current panel time range as a URL parameter
- Include variables – include all dashboard variables as key=value pairs to be appended to the end of the URL as parameters
- Open in a new tab – open the linked destination in a new tab
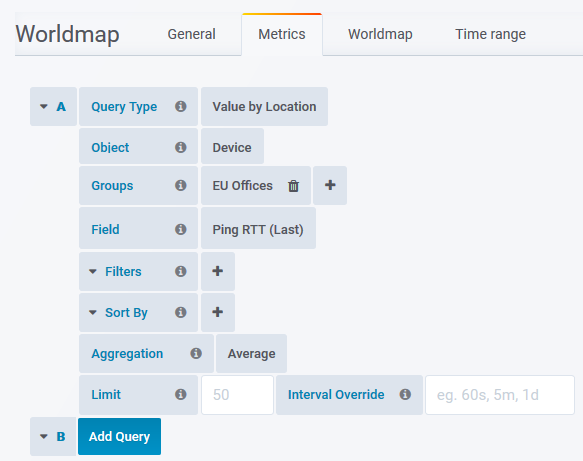
Metrics
The Metrics tab is used to configure the data to display. What options are available in the Metrics tab depends upon which Query Type is being used, see Query Types for details. The available query types for the Worldmap panel are:
- Value by Location
- Count by Location
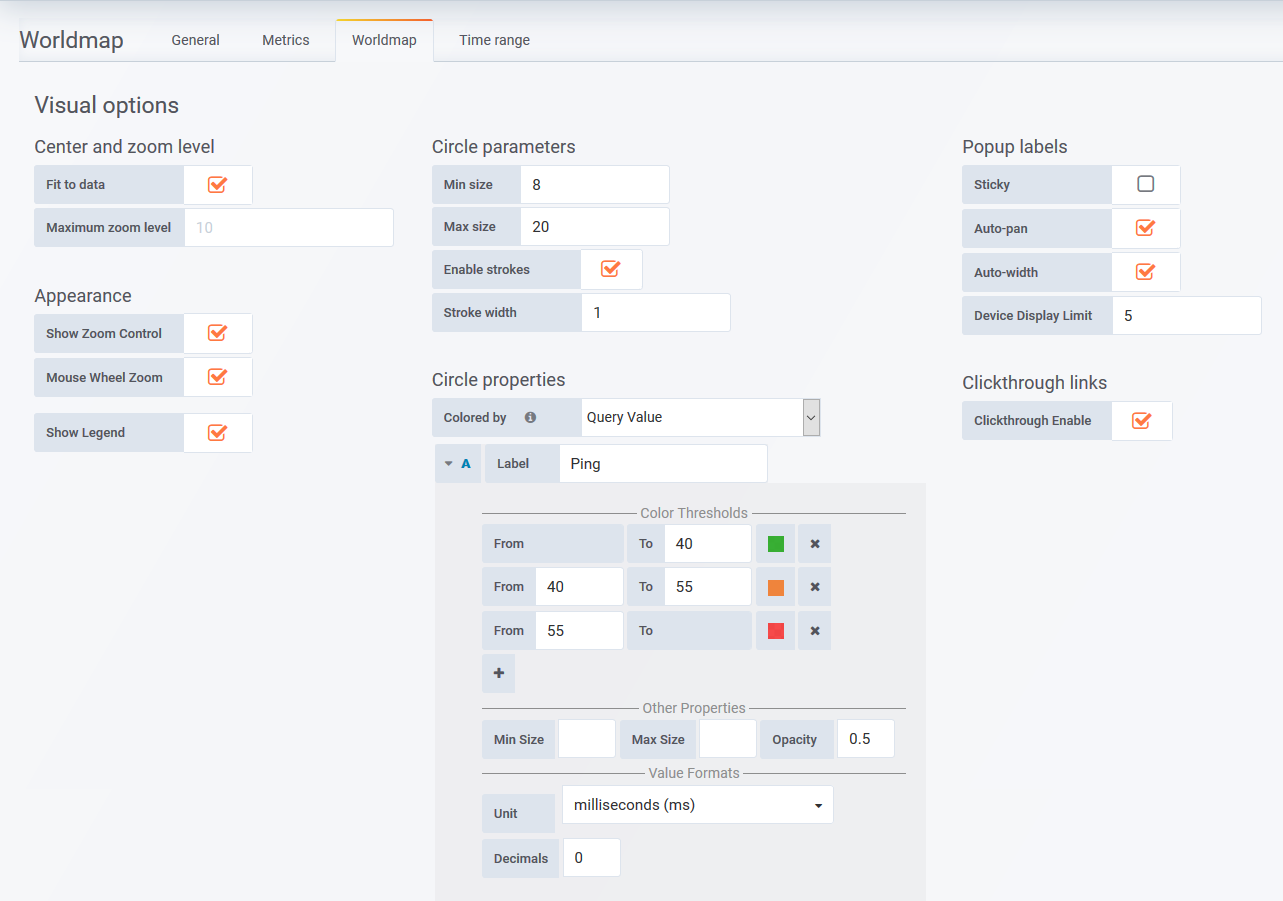
Worldmap
The Worldmap tab is used to configure the display of the data specified in the Metrics tab.
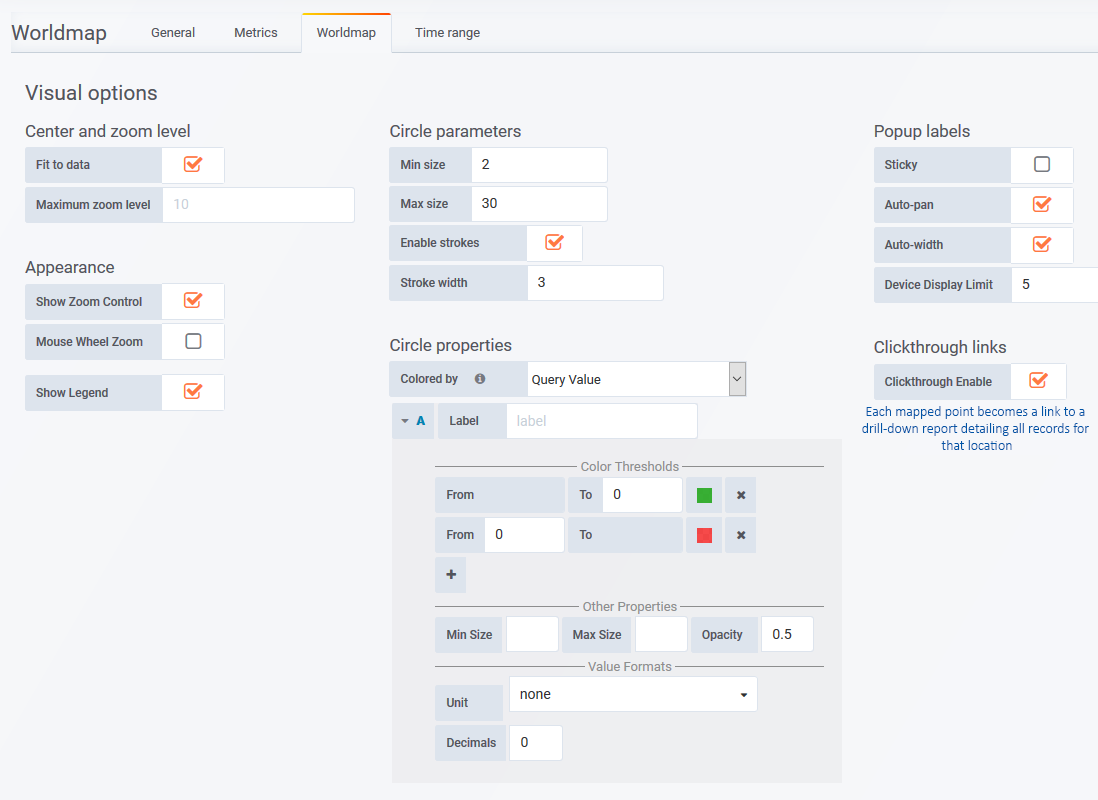
- Center and zoom level
- Fit to data – scale map to fit current data
- Maximum zoom level – maximum zoom used when scaling map to fit data
- Center – the location to be centered in the panel (requires Fit to data = disabled)
- Zoom level – default zoom level (requires Fit to data = disabled)
- Zoom radius (km) – default zoom level. When supplied, will overwrite Zoom level (requires Fit to data = disabled).
- Appearance
- Show Zoom Control – toggle display of zoom controls
- Mouse Wheel Zoom – toggle mouse-wheel zoom
- Show Legend – toggle legend
- Circle parameters
- Minimum size – minimum size for a circle in pixels
- Maximum size – maximum size for a circle in pixels
- Enable strokes– toggle to stroke circle boundary
- Stroke width – width of stroke in pixels
- Circle Properties – query specific settings and overrides for the appearance of the plotted points, see Circle Properties for details
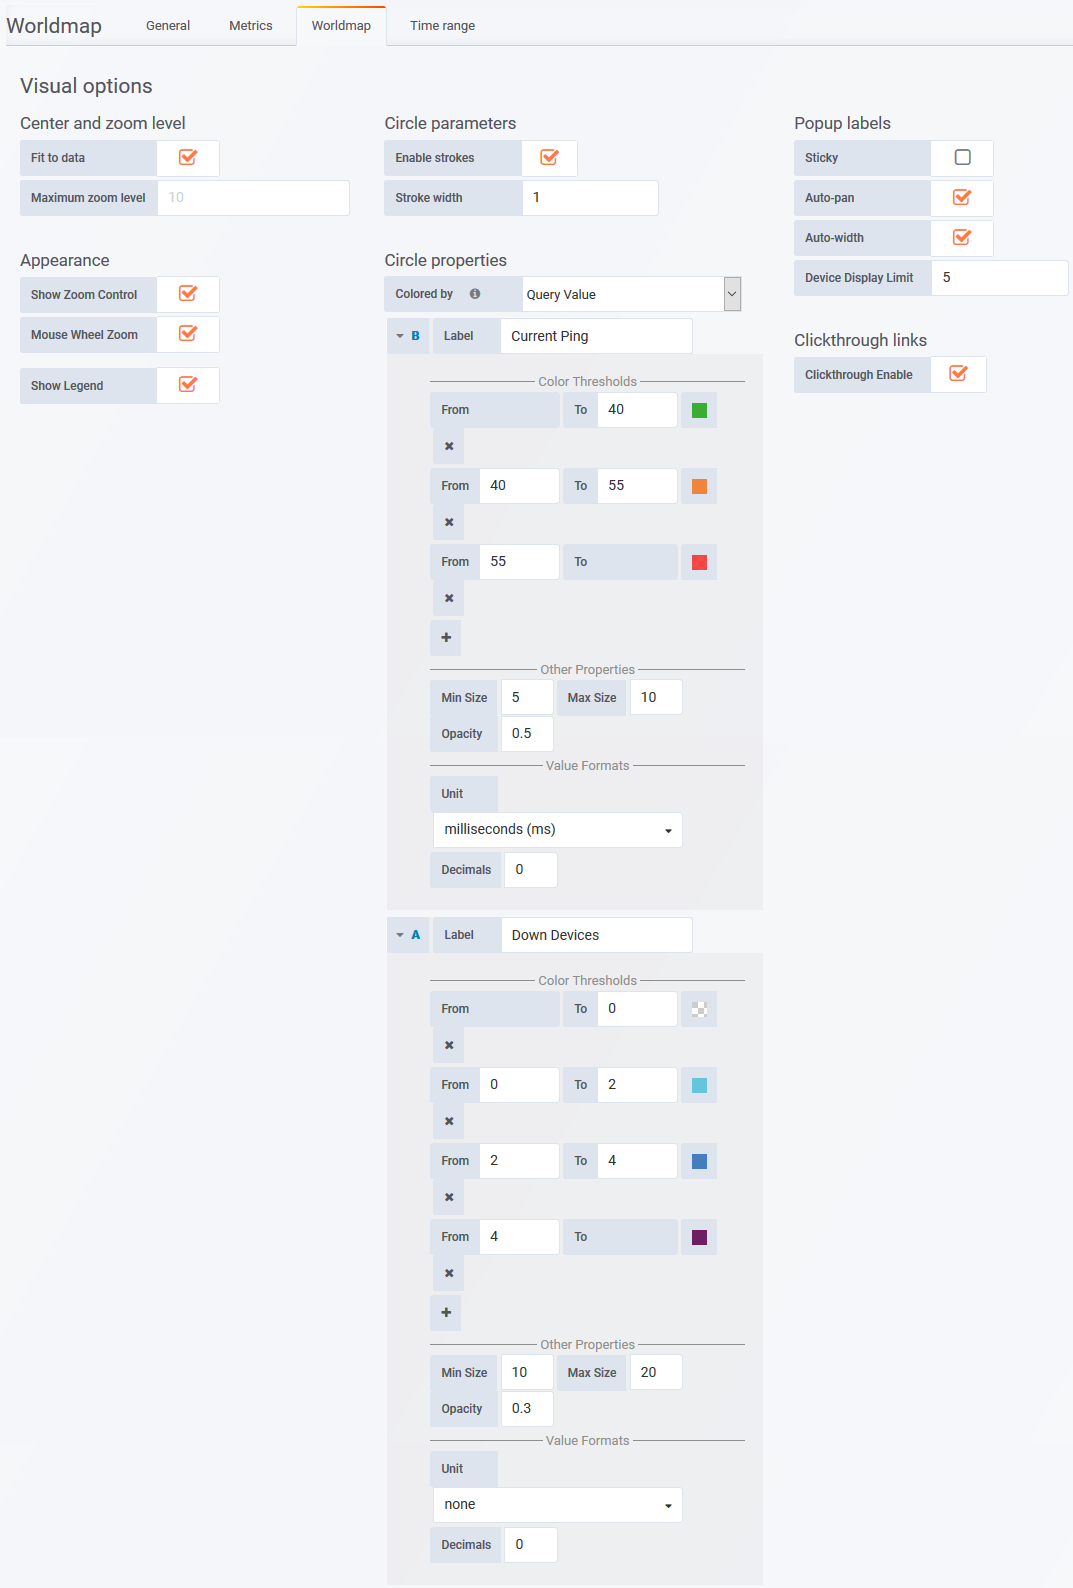
- Colored by –
- Query – a single color is applied to every circle (hot-spot) for that query
- Query Value – the circle color can be configured to vary according to the value for that circle
- Query Selector
 – expand/collapse additional circle property settings for that query, the letter displayed indicates which query (defined in the Metrics tab) the settings apply to
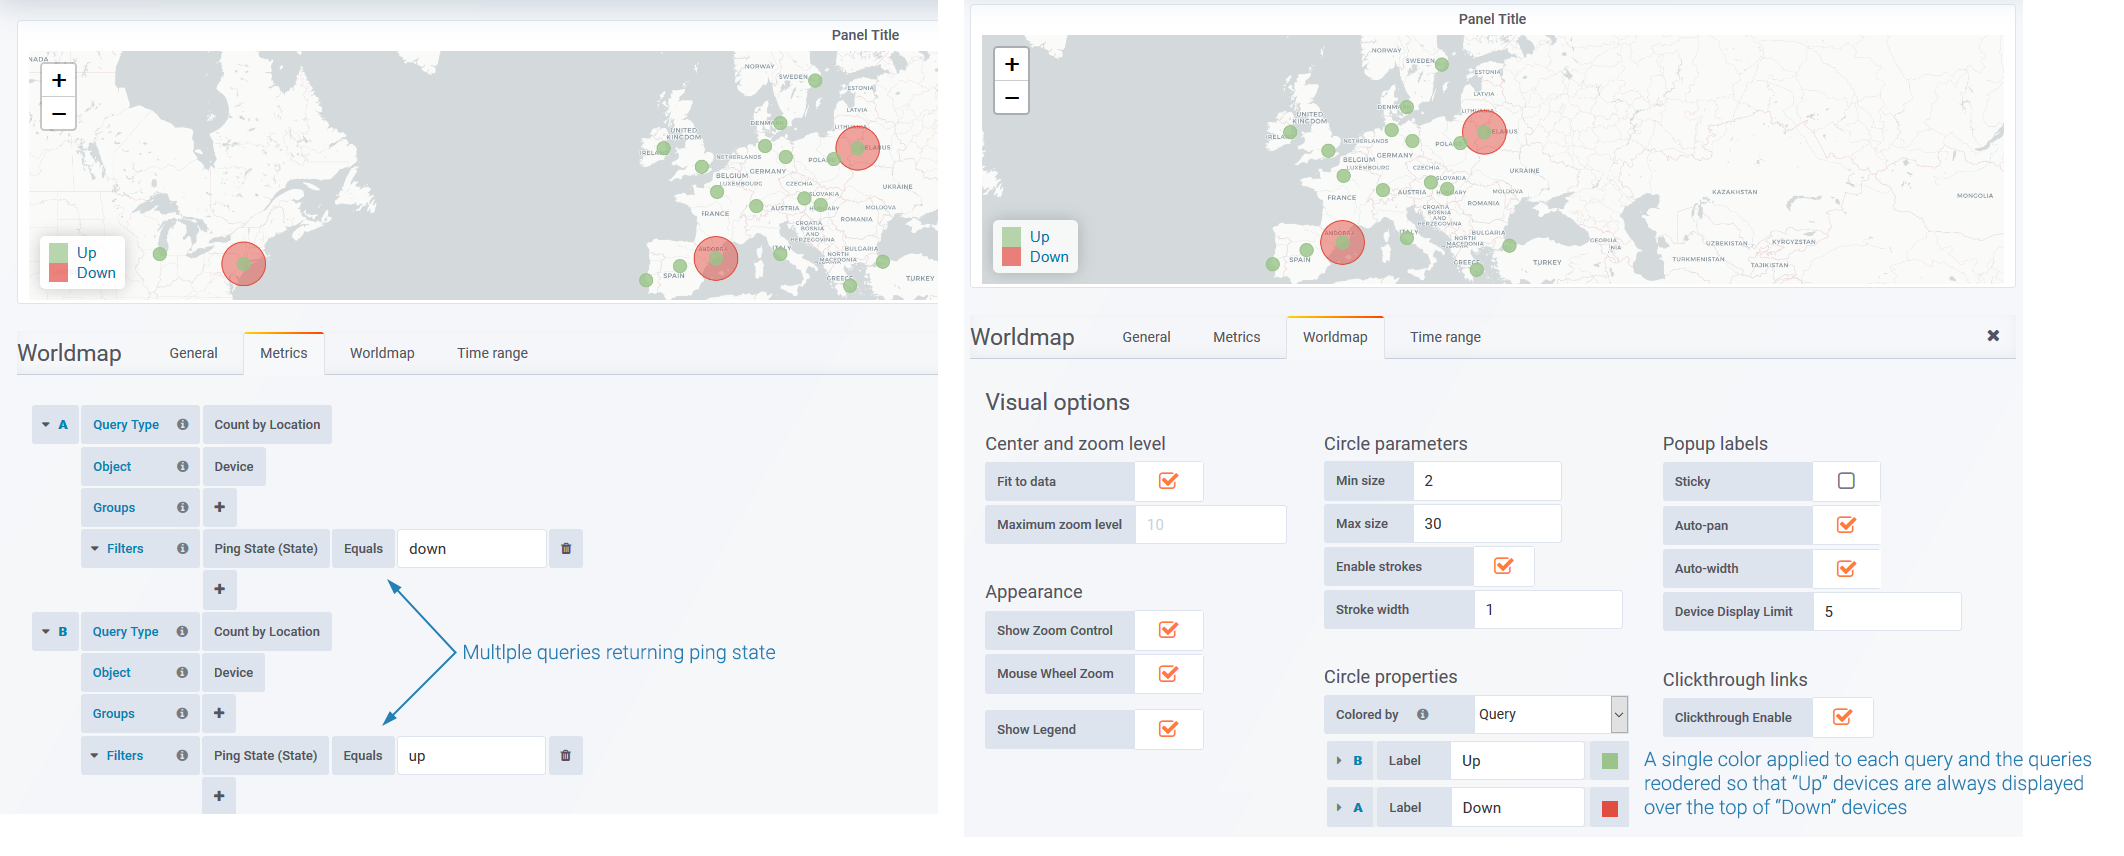
Note: when the panel features multiple queries, the Query Selector can be used (click and drag) to reorder the queries in the Circle Properties section. The order of the queries determines their z-index in the panel. In the example below, the queries were reordered so that ‘Up’ devices are drawn over the top of ‘Down’ devices, the presence of a red circle, without a corresponding green circle indicates that the entire site is offline.
- Label – alternate label (instead of the full metric name) used in circle popups, and in then legend for multiple query panels
- Color – requires Colored by = Query, the color assigned to all circles for that query
- Color Thresholds – requires Colored by = Query Value, assign a set of value ranges and assign a color to each
- Colored by –
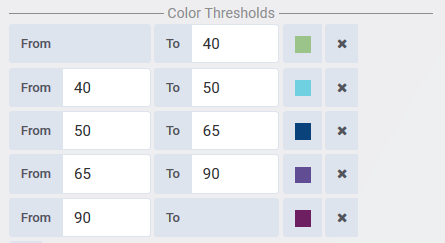
- The range limits should overlap as shown in the example above
- Overlapping ranges are lower limit inclusive and upper limit exclusive
- When the panel features a single query, the ranges are also displayed in the panel legend
- Circle Properties
- Min Size – minimum size for circle
- Max Size – maximum size for a circle
- Opacity – range 0 – 1 circle opacity
- Unit – unit displayed in pop-up for the query values
- Decimals – decimals displayed in pop-up for the query values
- Popup labels – appear on mouse-over
- Sticky – sticky labels require a click to hide
- Auto-pan – auto-pan panel to display full popup content
- Auto-width – resize popups to better fit content
- Device Display Limit – maximum number of records to display for a given circle
- Clickthrough links
- Clickthrough Enable – each mapped point is a link to a drill-down report detailing all records for that location
Time Range
Apply an override to the dashboard-wide timefilter.
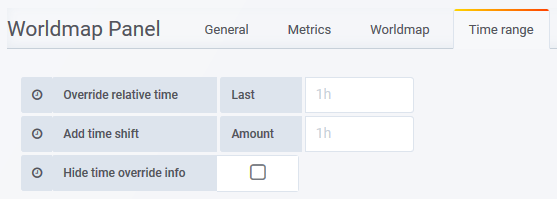
- Override relative time – Last – specify a new time range for the panel, relative to ‘now’
- Add time shift – Amount – override the ‘now’ point with respect to the timefilter being applied to the panel
- Hide time override info – when unchecked, the current time override setting is displayed in the top-right of the panel header
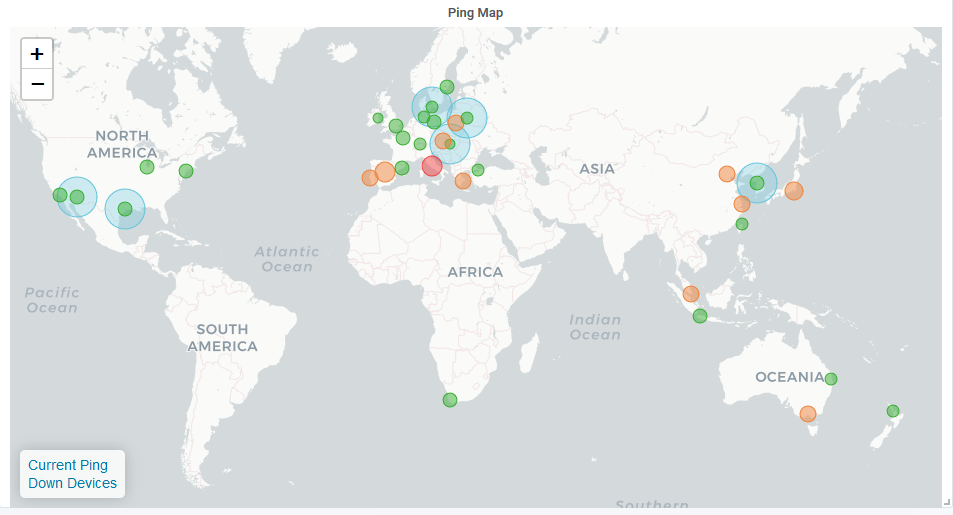
Example: Current Ping
- On an individual device level from the General > Device Details report by clicking the appropriate field in the report
- As a bulk update via auto-grouping, see Using Auto-Grouping to Apply Bulk Configuration Changes
- Via the API
Presenting the current ping time, averaged across all devices, for select locations.
Metrics Tab
Worldmap Tab
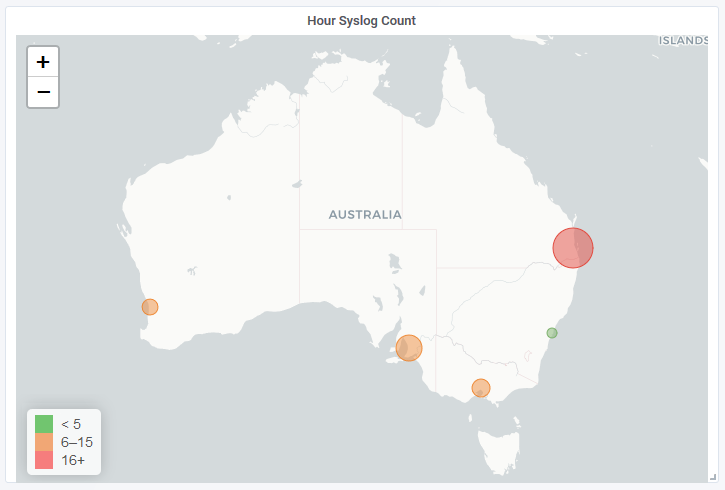
Example: Syslog Count
- On an individual device level from the General > Device Details report by clicking the appropriate field in the report
- As a bulk update via auto-grouping, see Using Auto-Grouping to Apply Bulk Configuration Changes
- Via the API
Indication of the number of syslog messages, for a select group of devices over the last hour.
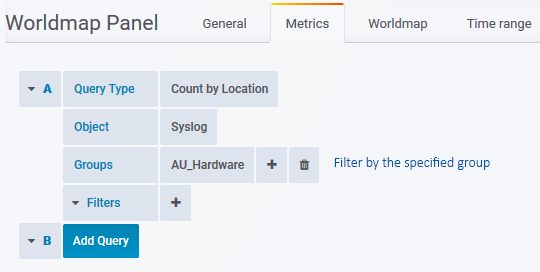
Metrics Tab
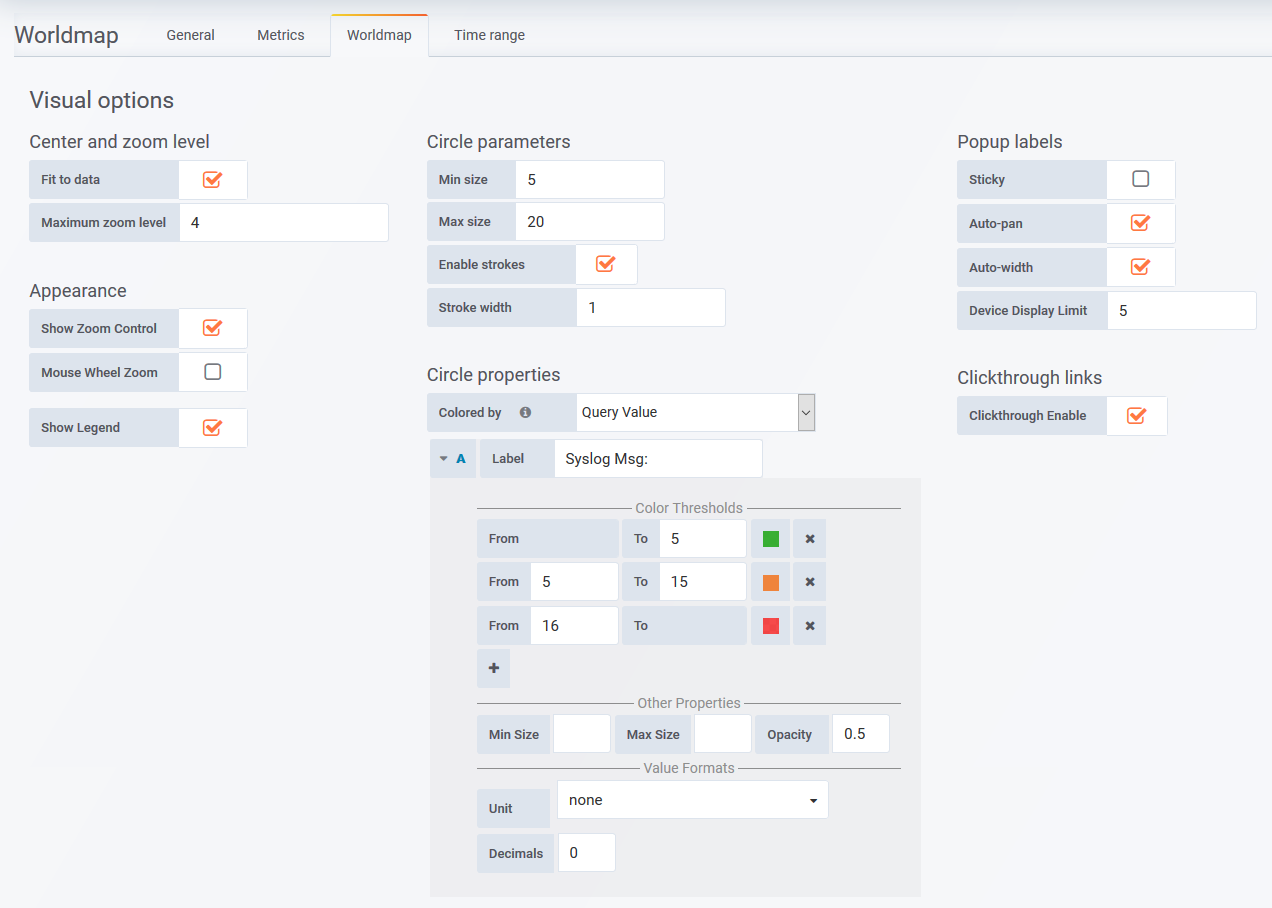
Worldmap Tab
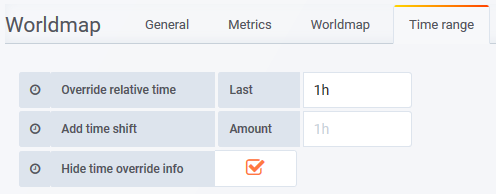
Time range Tab
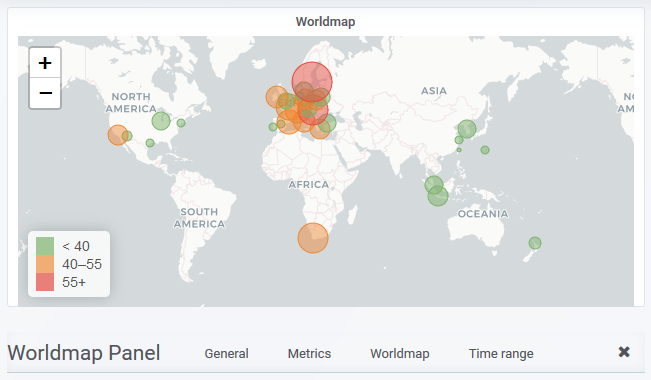
Example: Multi-Query Map
- On an individual device level from the General > Device Details report by clicking the appropriate field in the report
- As a bulk update via auto-grouping, see Using Auto-Grouping to Apply Bulk Configuration Changes
- Via the API
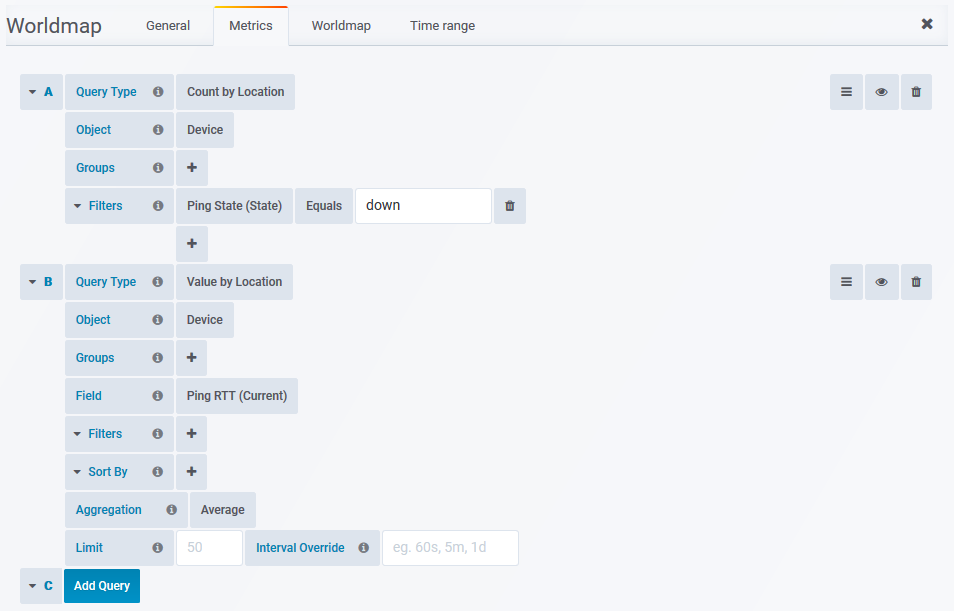
This map panel has been configured to display indicators from two different queries and features query-specific node sizing and coloring. The two series being graphed in the panel are:
- Number of ‘down’ devices
- Average ping for all devices in the location, at the current time
Metrics Tab