
Legacy Documentation for Statseeker version 5.5.3
Index
- Overview
- Singlestat Configuration
- Example Configurations
Overview
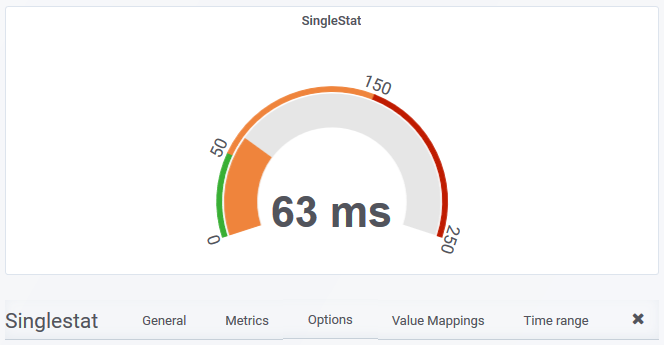
The singlestat panel displays a single statistic (optionally as a gauge) from a data series or an aggregate value from multiple data series.
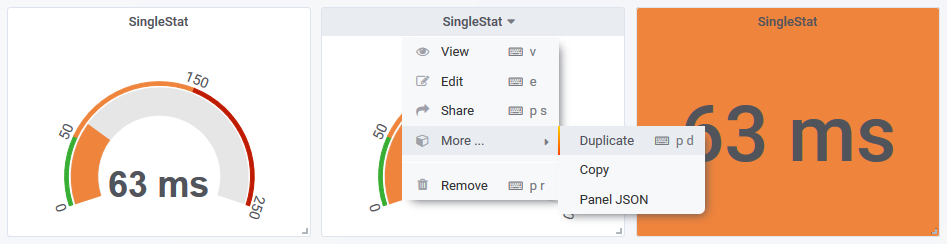
Clicking the panel header opens the panel menu, offering the following options:
- View – view the panel in fullscreen mode
- Edit – edit the panel configuration
- Share – options for sharing the panel contents with others, both internal and external to your organization
- More
- Duplicate – place a duplicate of the panel on the current dashboard
- Copy – copy the dashboard configuration in order to add the panel to another dashboard
- Panel JSON – view/edit the JSON underlying the panel configuration
- Remove – delete the panel from the dashboard
Singlestat Configuration
You can edit the panel configuration by:
- Clicking the panel title to open the panel menu and selecting Edit
General
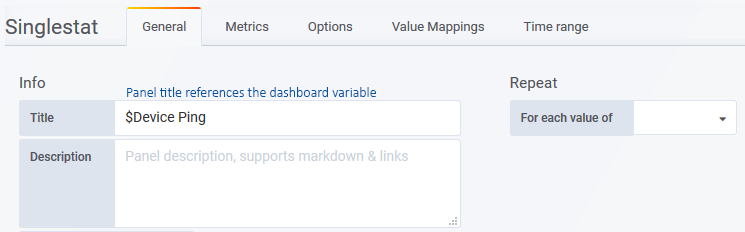
The General tab is used to configure the panel title, description and panel-level links.
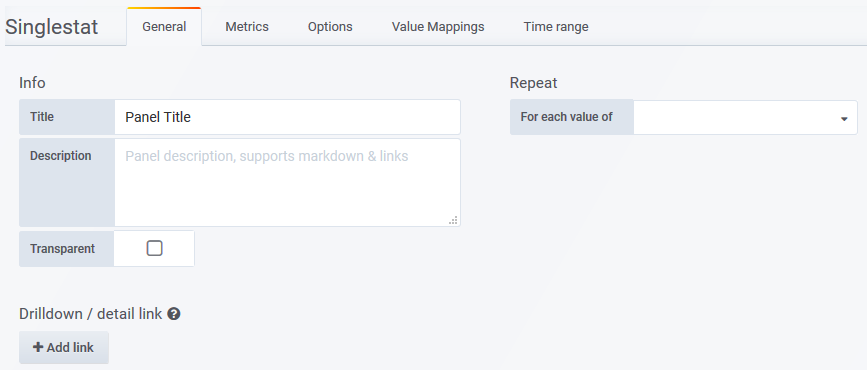
- Title – the panel title, displayed at the top
- Description – the panel description, displayed on hover of info icon in the upper left corner of the panel
- Transparent – if checked, removes the solid background of the panel (default not checked)
- Repeat – repeat a panel for each value of a variable, see Variables for details
- Drilldown – configure panel-level links displayed on hover of info icon in the upper left corner of the panel
- Type – link to a Statseeker dashboard or any URL
- Dashboard/URL – the dashboard or URL to link to
- Title – the display name for the link
- URL params – key=value pairs to be appended to the end of the URL as parameters
- Include time range – include the current panel time range as a URL parameter
- Include variables – include all dashboard variables as key=value pairs to be appended to the end of the URL as parameters
- Open in a new tab – open the linked destination in a new tab
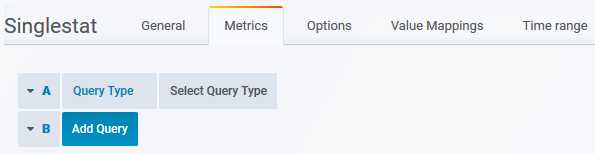
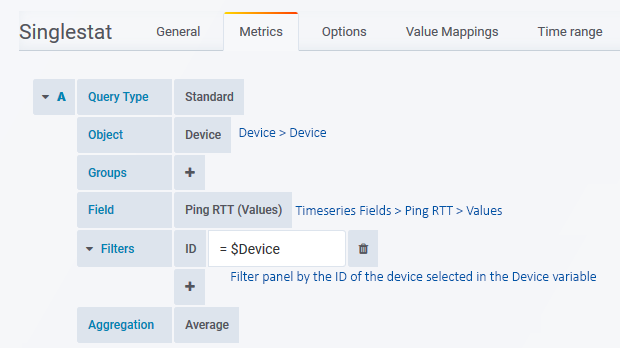
Metrics
The Metrics tab is used to configure the data series to be presented. What options are available in the Metrics tab depends upon which Query Type is being used, see Query Types for details.
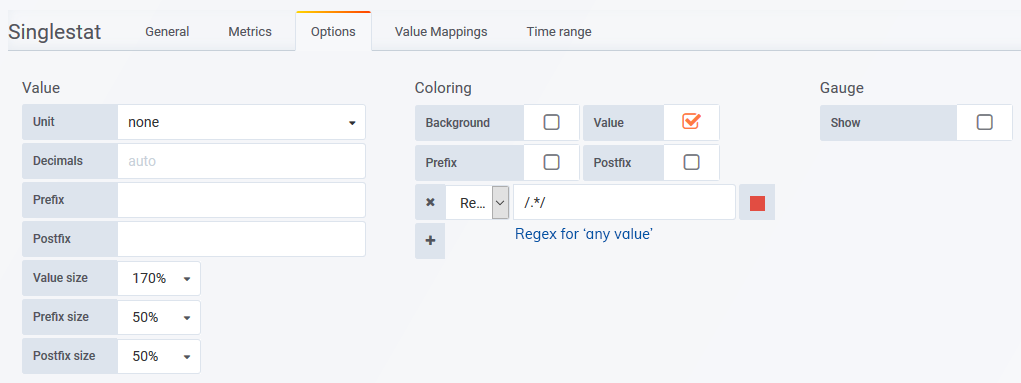
Options
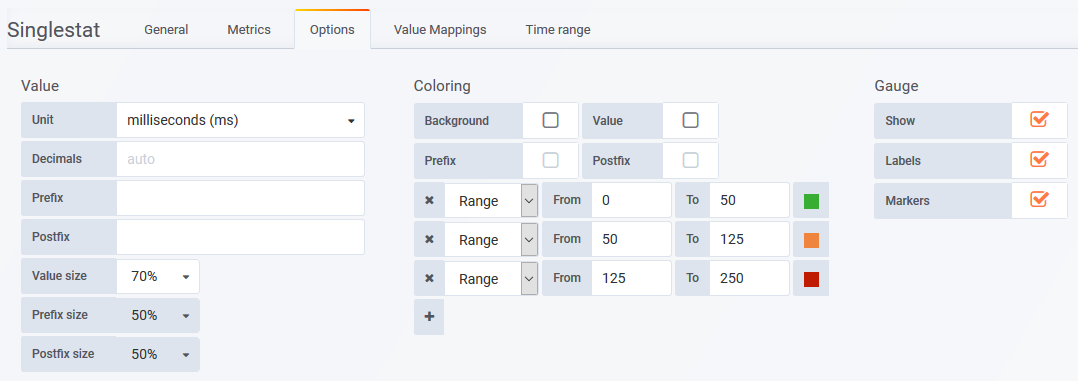
The Options tab a range of presentation options for your singlestat panel.
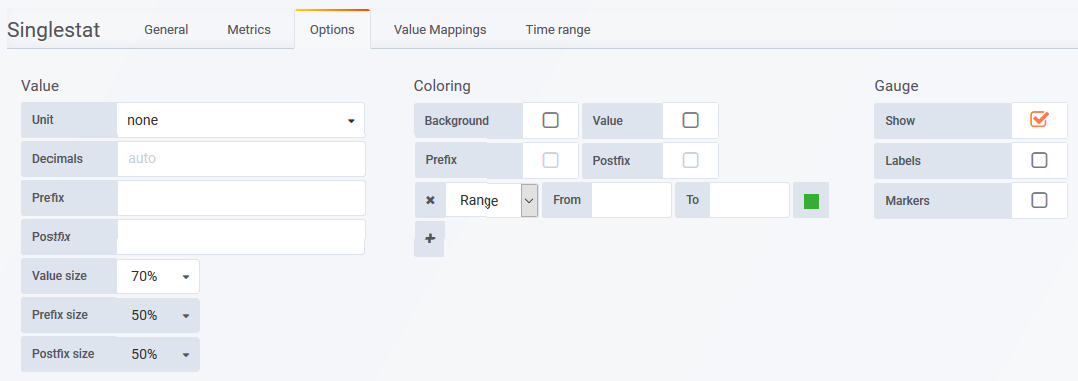
- Value
- Unit – unit to display with value
- Decimals – number of decimals to present in the value
- Prefix – custom label to prepend to value
- Postfix – custom label to append to value
- Value/Prefix/Postfix size – alter the size of the displayed value/label
- Coloring
- Background – apply threshold colors to the panel background
- Value – apply threshold colors to the value
- Prefix– apply threshold colors to the prefix label (disabled if gauge is shown)
- Postfix – apply threshold colors to the postfix label (disabled if gauge is shown)
- Range – set range start and end points, and the color to apply to values in this range
- Regex – specify a regex filter, and the color to apply to values satisfying that filter
- Gauge
- Show – display gauge
- Labels – display threshold values on gauge. Requires range (via Coloring: Range or Coloring: Regex) be set.
- Markers – display threshold mapping on gauge. Requires range (via Coloring: Range or Coloring: Regex) be set.
Value Mappings
Set value to text overrides.
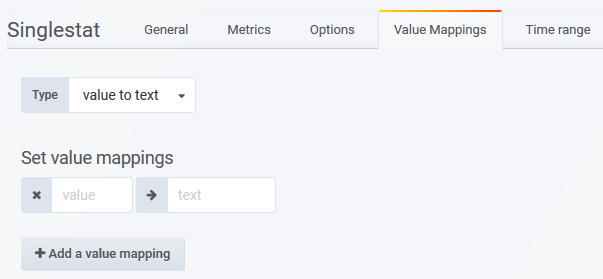
- Type
- value to text – map a specific value to text
- range to text – map a range of values to a single text value
- Set value mappings
- value to text – specify the value and text to replace it
- range to text – specify start and end points of the range, and the text value that will be presented for all values within that range
- Add a value mapping
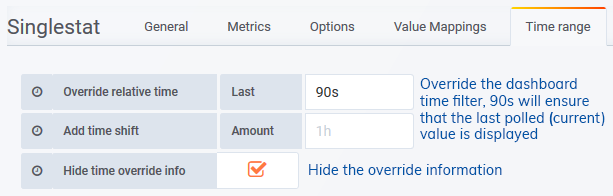
Time Range
Apply an override to the dashboard-wide timefilter.
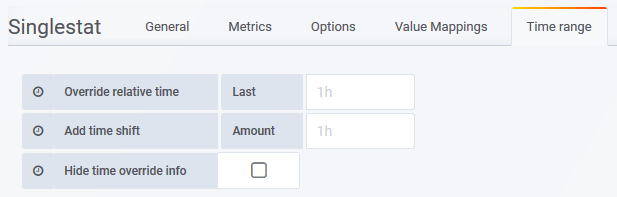
- Override relative time – Last – specify a new time range for the panel, relative to ‘now’
- Add time shift – Amount – override the ‘now’ point with respect to the timefilter being applied to the panel
- Hide time override info – when unchecked, the current time override setting is displayed in the top-right of the panel header
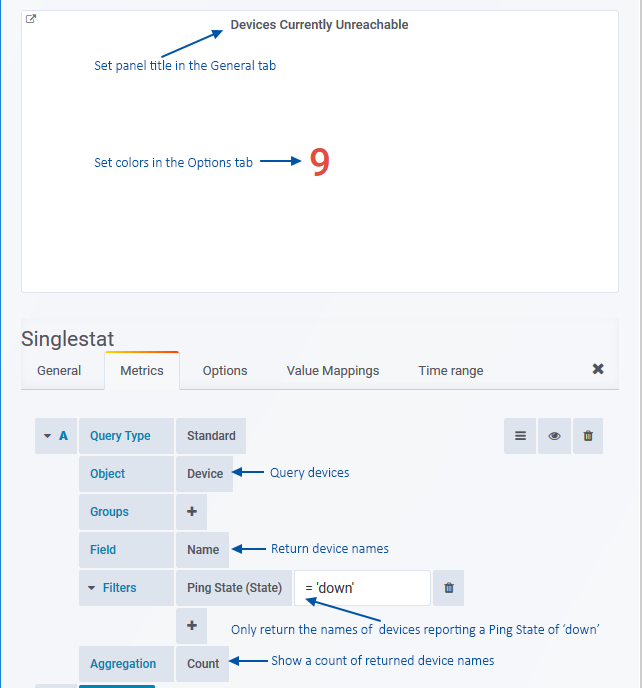
Count of ‘Down’ Devices
A simple query returning devices reporting a ping state of down.
- Ping state is a device field, so we set Object to Device > Device
- Select any field, it doesn’t matter which as we will be displaying a count rather than the field values
- Filter the devices to those reporting a ping state of down
- Set aggregation to Count
Options Tab
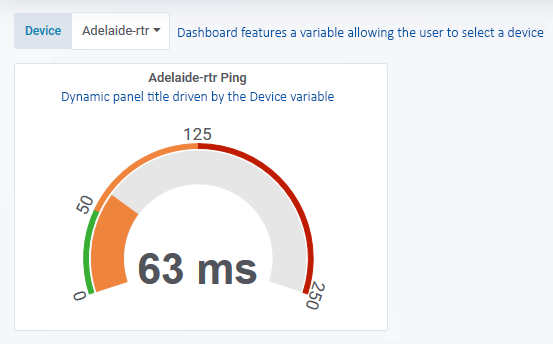
Gauge showing current Device Ping Time
This Singlestat panel features a gauge and colored thresholds to provide Ping RTT. The panel also takes advantage of a dashboard variable to target the panel content to a specified device.
General Tab
Metrics Tab
Options Tab
Time range Tab
A similar override can be applied to the entire dashboard from Dashboard Settings > General > Now delay: now –. This setting can be particularly useful when displaying current values for multiple objects/metrics in tables or graph legends.