
** Legacy Documentation for Statseeker version 5.5.3 **
Index
- Overview
- Reports Panel
- Viewing an Existing Custom Report
- Creating a New Report
- Managing Custom Reports & Folders
Overview
Statseeker Reporting allows you to create reports targeting any data available to Statseeker, for all devices/interfaces on your network, and present that information in a tabular or graphical report. Once created, reports:
- Are available from the Console report list
- Can have access to them restricted via user permissions
- May be included in a summary report
- Can be scheduled to run and have the subsequent report emailed to a recipient list
Custom reporting differs from legacy/canned reports by allowing you to edit the contents, layout, and appearance of the report to best suit your requirements. Custom reports are also used to present data from installed Custom Data Type packages.
Custom reports can be exported in csv or pdf formats, and emailed, see Emailing and Scheduling Reports for details.
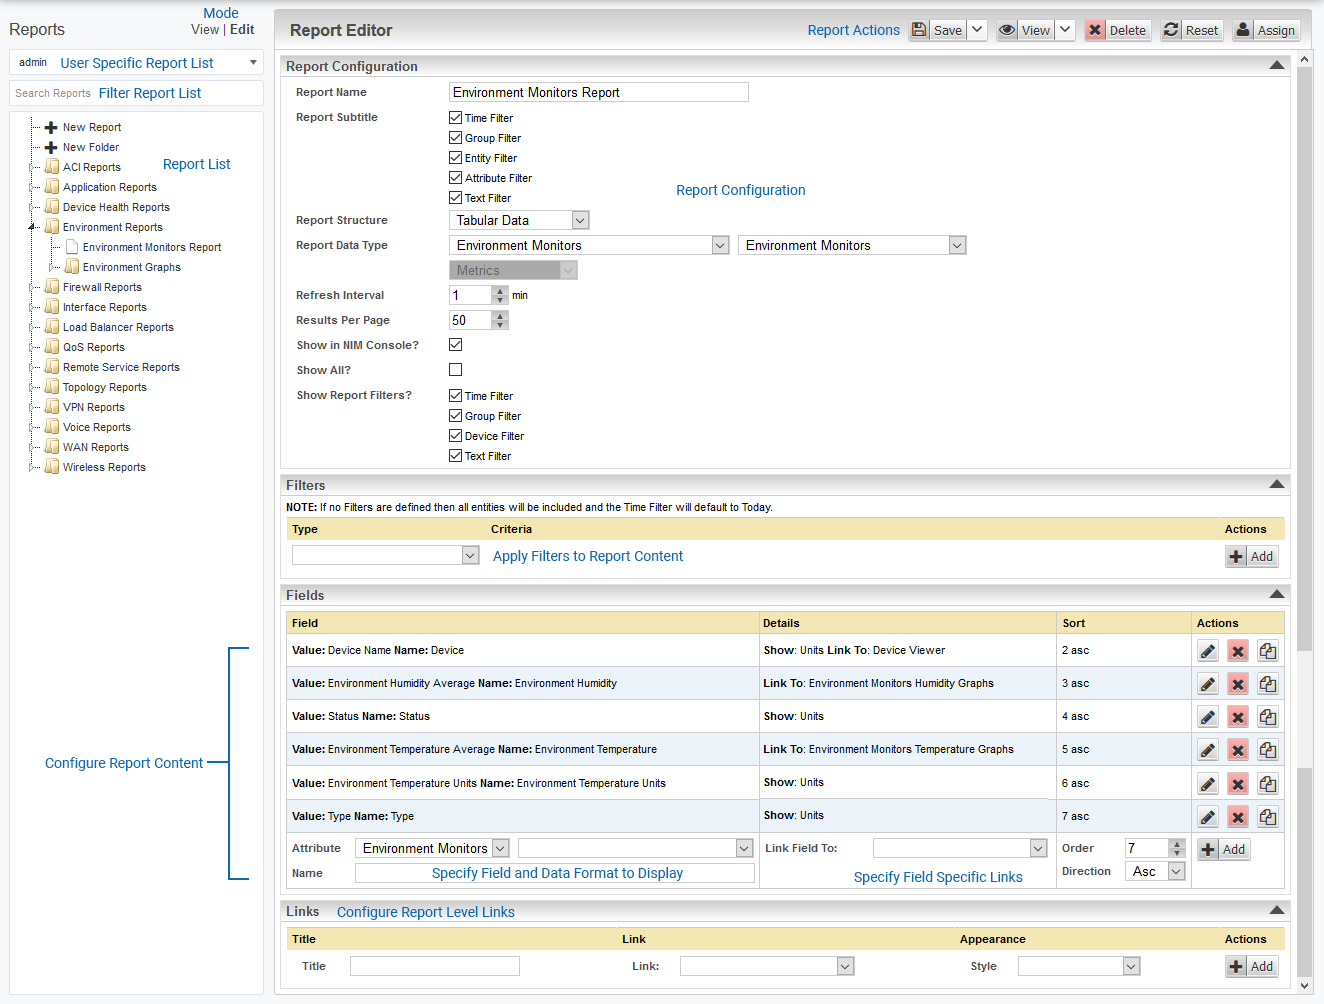
Reporting Console
The Reports console can be accessed from the main navigator, providing access to the existing custom reports and the ability to create and edit reports. The console is broken into two sections:
- Reports – a listing of the existing custom reports
- Report Editor – editing and viewing of custom reports
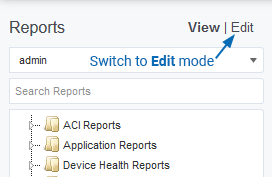
The Reports Panel can be used in either View or Edit mode. In View mode, you can run existing reports, in Edit mode, you are able to create, edit, and view custom reports. The controls for switching between the two modes are offered at the top of the Reports panel.
Viewing an Existing Custom Report
Existing custom reports can be run from either the Console or the Reports Panel.
Viewing Custom Reports from the Console
All existing custom reports are located at the bottom of the report list in the Console for the admin user only. To allow other users to access custom reports from the Console, you need to assign them to a group that the user has permission to access. To do this:
- Select Administration Tool > User Profile/Grouping > Entities to a Group
- Select a group that the user has access to from the Groups drop-down
- Select Reports from the drop-down on the right
This will populate the far-right column with all reports on the Statseeker server.
- Select the reports you want the user to access and click the >> button to move them to the Include column
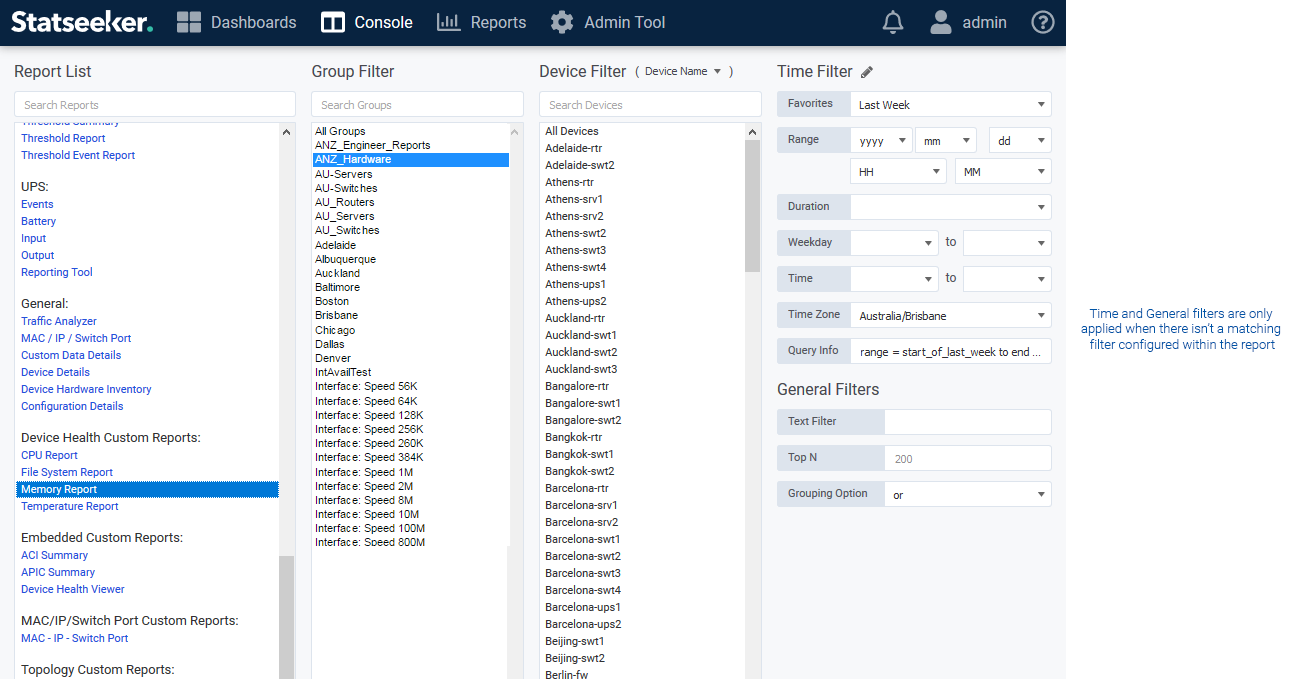
To run a custom report from the Console:
- Select groups/devices
- Apply filters if required
- Select the report
- Opening the report in Edit mode
- Unchecking Show in NIM Console?
- Save the report
Viewing Custom Reports from the Reports Panel
Custom reports can be run from within the Reports panel.
In View mode, simply select the report from the Reports panel.
In Edit mode:
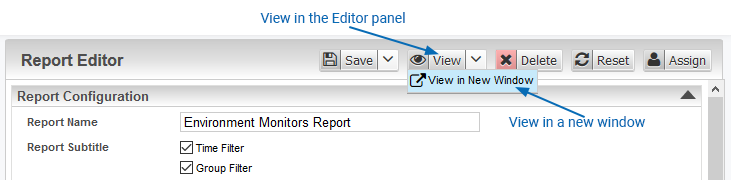
- Click View to view the report in the Reports panel
- Mouse over the View button and select View In New Window to launch the report in a new window, leaving the report configuration open in the Report Editor panel.
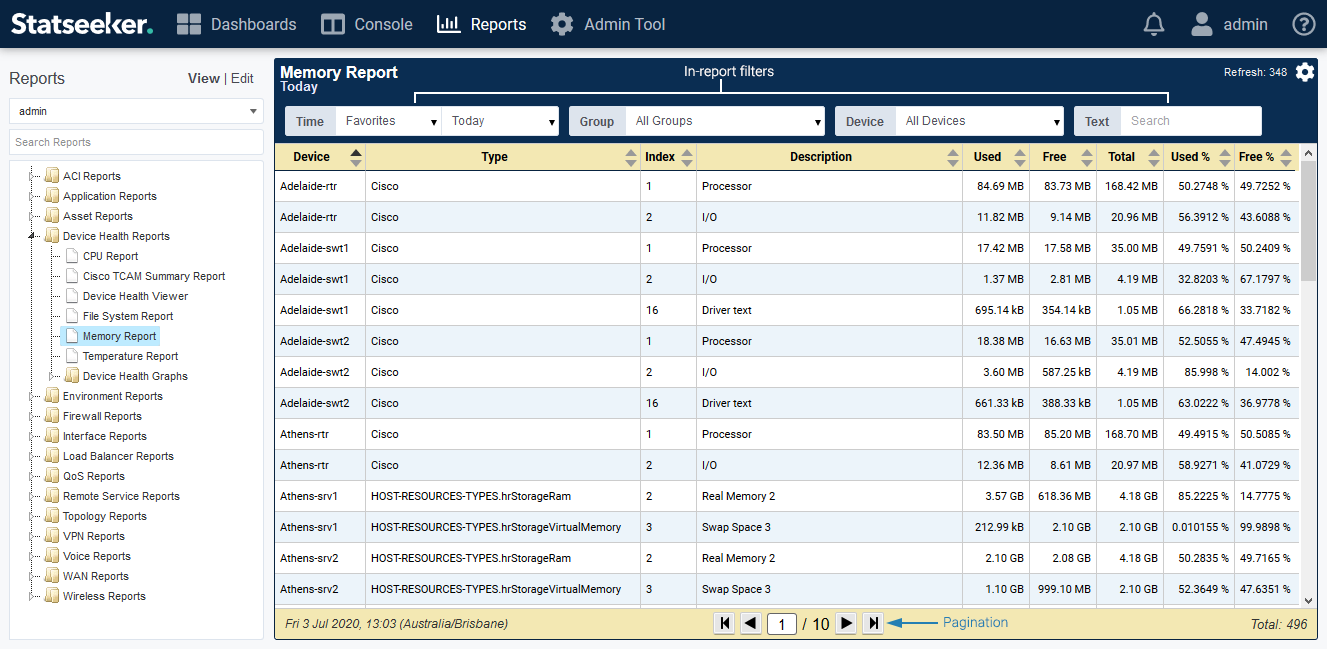
Interacting with Custom Reports
- Custom reports can optionally offer display filters in the report header, allowing you modify the scope and focus of any custom report being viewed
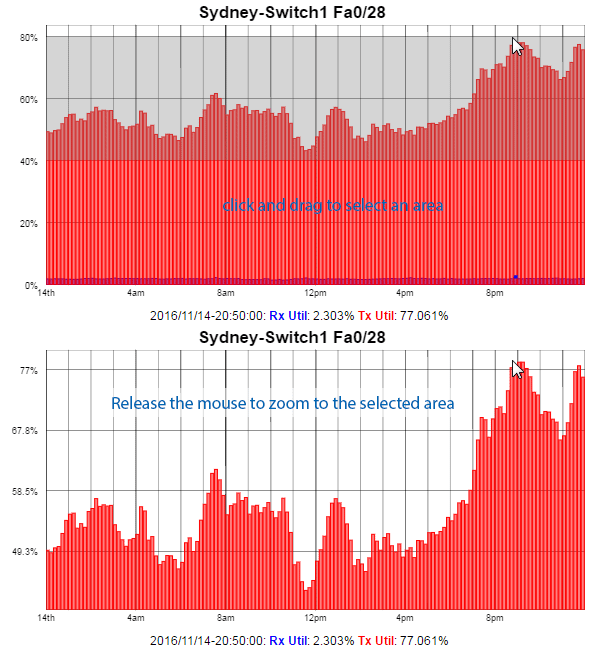
- Graphs can be moused over to view specific data point values, and can be zoomed (via click-and-drag) to specific time and/or value ranges
- All custom reports can be configured to offer links through to other resources (reports, dashboards, web content and 3rd party tools)
Filtering Within Reports
Custom reports contain filter options within the report header, allowing you to assign/modify filters after the report has been launched.
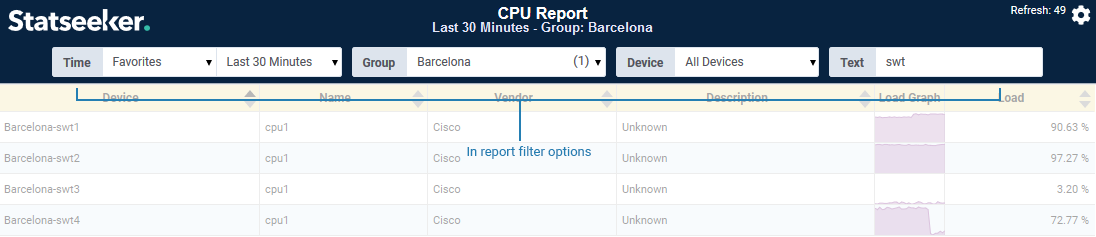
Any filters specified in the report configuration are assigned as the default filters used when the report is launched and can be altered from within the report while viewing it.
Time Selector
The Time Selector functions as a timefilter and can be used to dynamically alter the reporting period of the report while viewing it. When opening a report containing a time filter, the time selector defaults to this value. When opening a report that does not have a time filter configured, the time selector will default to Today.
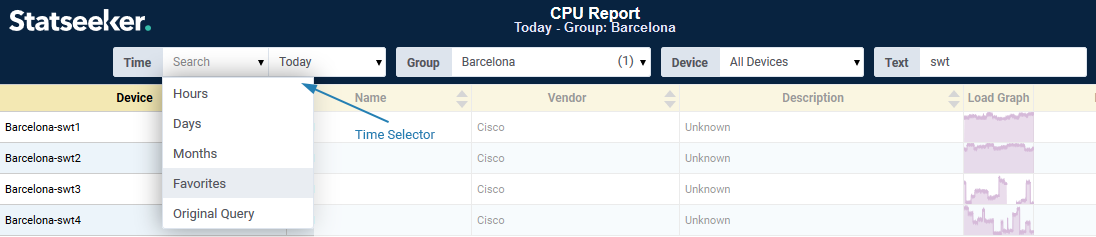
- Favorites – offers the current content of the time filter favorites list
- Hours – a 24hr slider with 1 hour increments
- Days – the selector contains ‘today so far’, plus the previous 7 days, with 1 day increments
- Months – the selector contains ‘this month so far’, plus the previous 12 months, with 1 month increments
- Original Query – reset the report to the original/default time filter
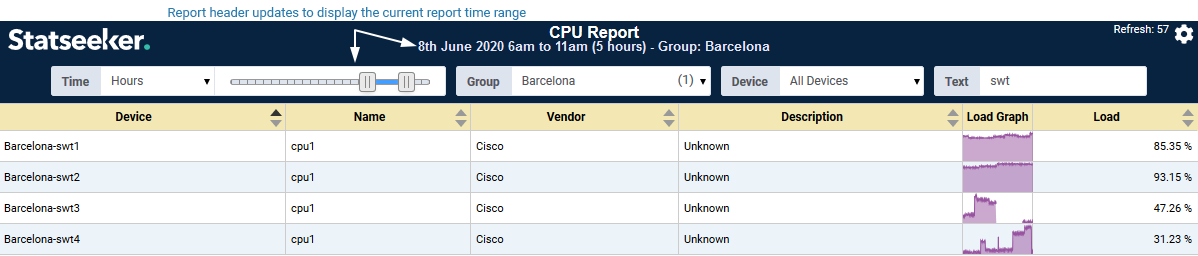
By default, reports display the report timefilter in the header (this can be disabled in the report configuration, see Creating a New Report). When using the time selector to modify the reporting period, the report header is updated to reflect your selection.
Dynamic Graphing Interval
When modifying the reporting period via the Time Selector, the Resolution (interval between plotted data points, and the size of aggregated data ‘buckets’) used in the report is automatically updated to best suit the scope of the report.
For example, you have a graph with a reporting period of the previous 3 months, and a resolution of 15 minutes. If you updated the reporting period to the last 8 hours via the Time Selector, then the resolution would be updated to 1 minute, giving a granular view, far more suited to the current view of your data. Conversely, using the Time Selector to take a report looking at a single day’s data out to the previous 6 months, might take the resolution from 1 minute out to 12 hours. Any slice of that 6 months history can still be viewed at 1-minute resolution when the reporting period is set accordingly.
Group and Device Filters
The Group and Device filters will reflect any group/device selections that were specified in the report configuration. This filter selection can be modified to refocus the report while viewing the report.
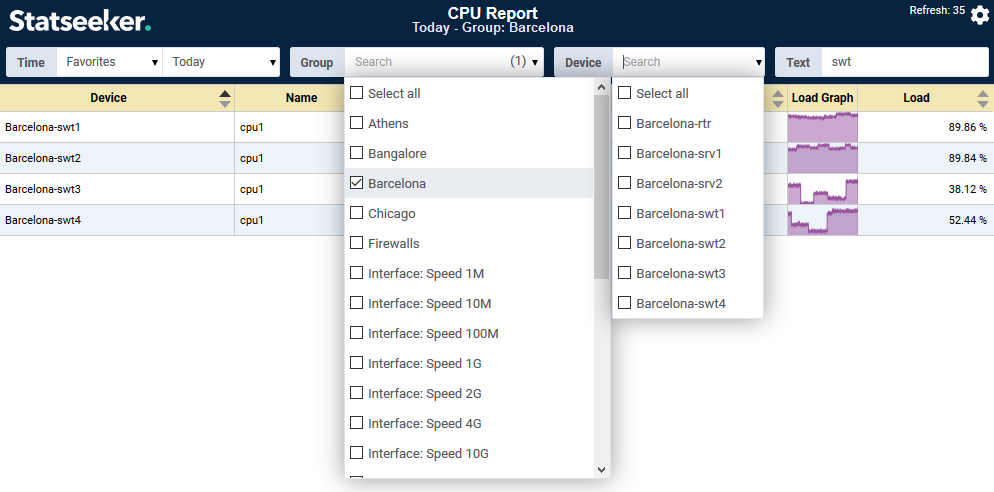
- The Group filter contains all groups on the server
- Group selections determine the content of the Device filter
- Multiple selections can be made in both the Group and Device filters
Text Filter
The Text filter will reflect the content of the General > Text filter if any was specified in the Console prior to launching the report. This filter can be modified to refocus the report while viewing the report.
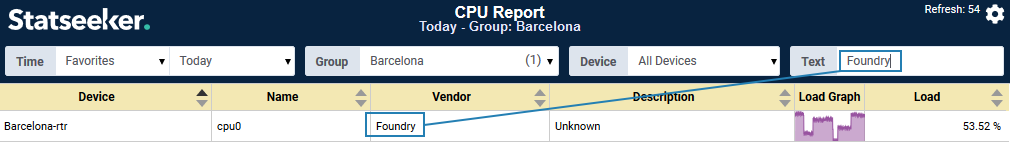
The filter:
- Accepts either a simple string or RegEx
- Matches that string/expression across strings within the report (entity names in graphs, string columns in tables). Does not match against date/time or timeseries metric fields.
Interacting with Graphs
The graphs presented in custom reports are fully interactive allowing you to:
- mouse over the graph to see values at that point
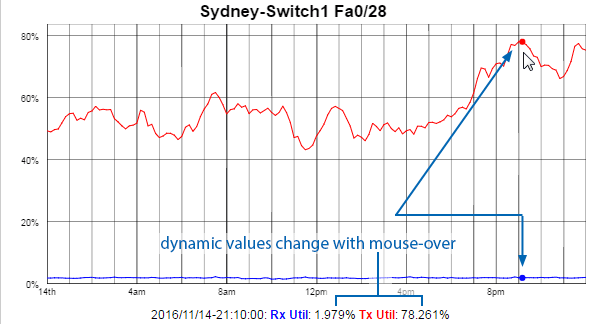
- Click and drag horizontally/vertically on the graph to zoom, double click to return to default view
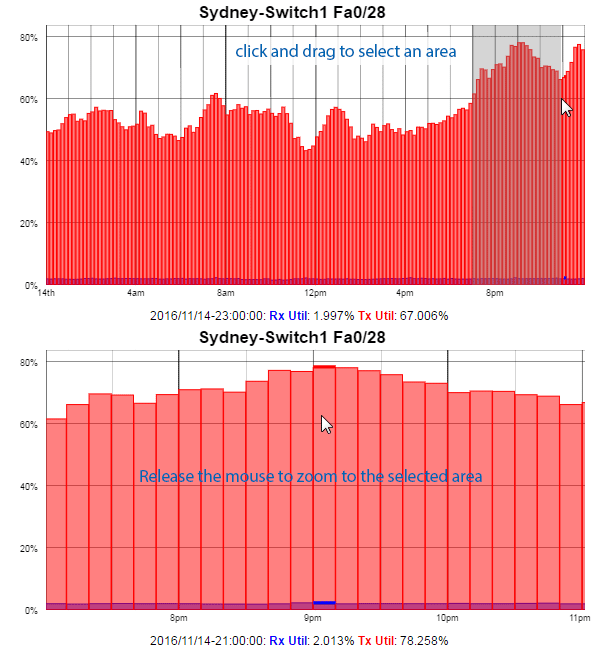
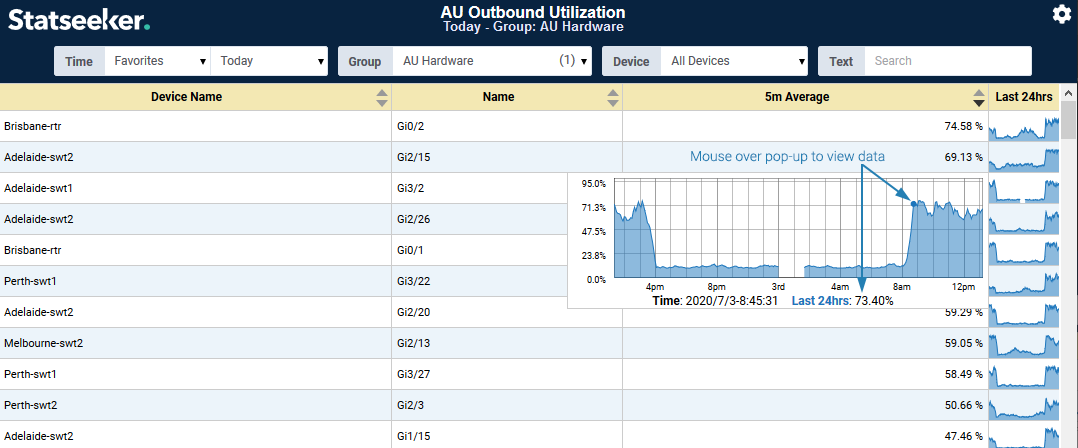
Graphs displayed within Tabular Reports
Statseeker custom reports allow you to include thumbnail graphs within tabular reports as you would with any other data. When mousing over these graphs a pop-up is displayed presenting a more detailed view of the data.
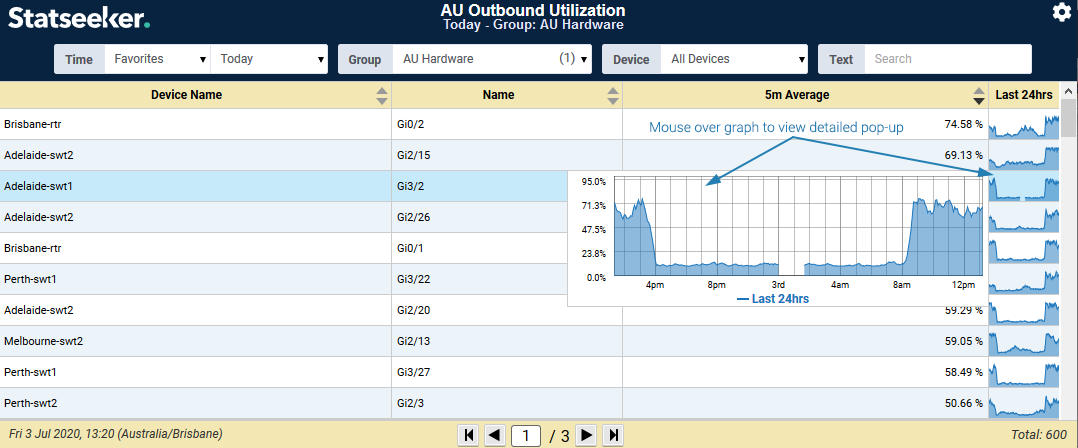
In turn, these detailed views can be interacted with just like other custom reporting graphs i.e. you can mouse over the graph to display data pertaining to that point in the graph as well as zoom via click-and-drag.
Creating a New Report
To create a new custom report:
- Switch to Edit mode
- Select New Report
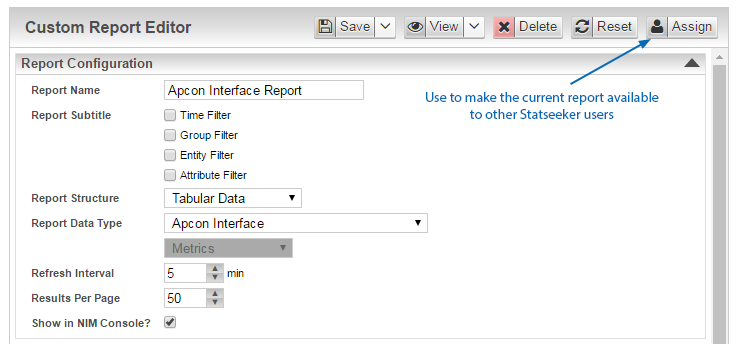
This will open a blank report template in the Custom Report Editor panel.
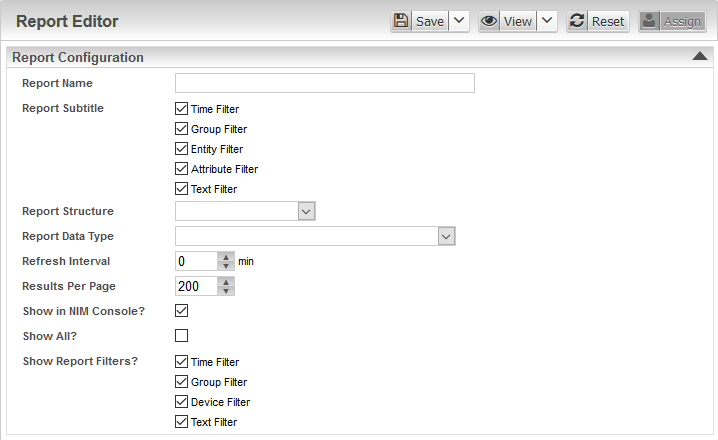
| Field | Required | Description |
| Report Name | Must be unique and consist of only alpha-numeric, or the following characters -_.!~*() | |
| Report Subtitle | Any filters of the selected type/s used in the report will be detailed in the report header An additional per-graph title can be configured for graph reports (see Graphs Section) to display any number of field values, such as displaying the ‘interface title’ as an identifier for the graph |
|
| Report Structure |
|
|
| Report Data Type | The data type to report on, additional options are included with installed Custom Data Type packages. The value set here also determines which folder a newly created report will be saved to in both the Reports panel and the Console. | |
| Refresh Interval | How frequently to refresh the report data | |
| Results Per Page | Maximum results to display per page, overrides the Console Top N setting. | |
| Show in NIM Console? | Select to display the report in the Console. Enabled by default.
Note: the report will be grouped according to the Report Data Type and located at the bottom of the Report List in the Console.
|
|
| Show All? | Select to include historical data for entities no longer being polled | |
| Show Report Filters? | Select the reporting filters to be displayed in the report header, these filters allow you to alter the scope and focus of the report while viewing it |
- Populate the Report Configuration fields as required
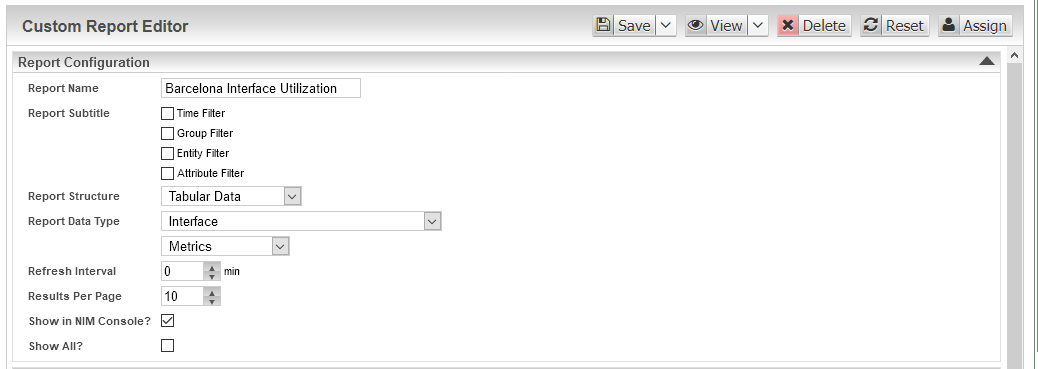
Once both Report Data Type and Report Structure have been selected the elements of the form relevant to those selections are displayed.
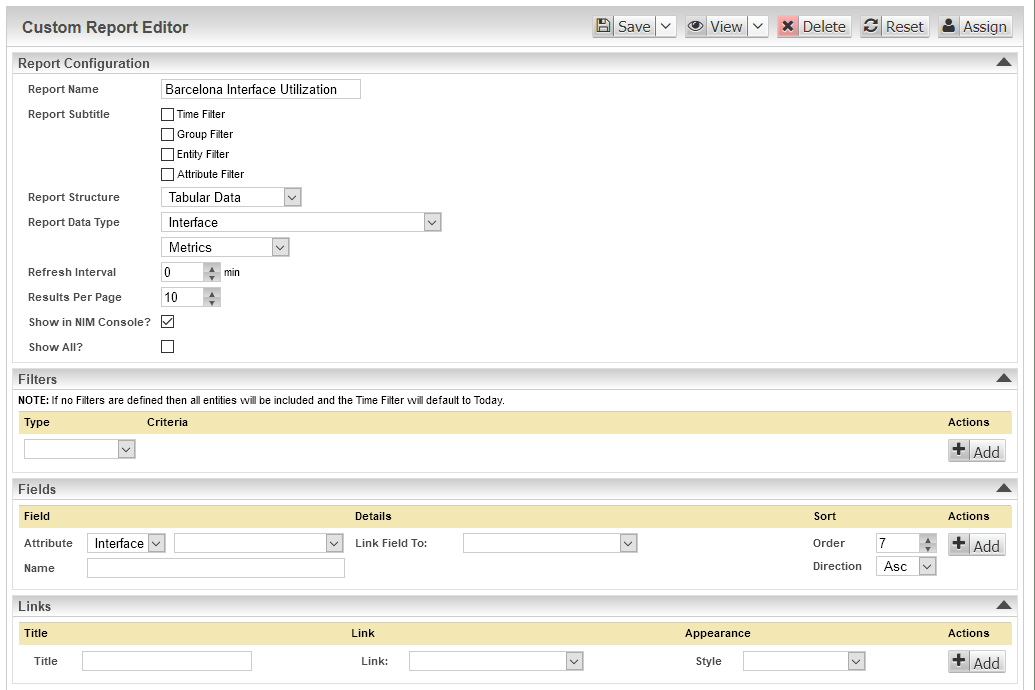
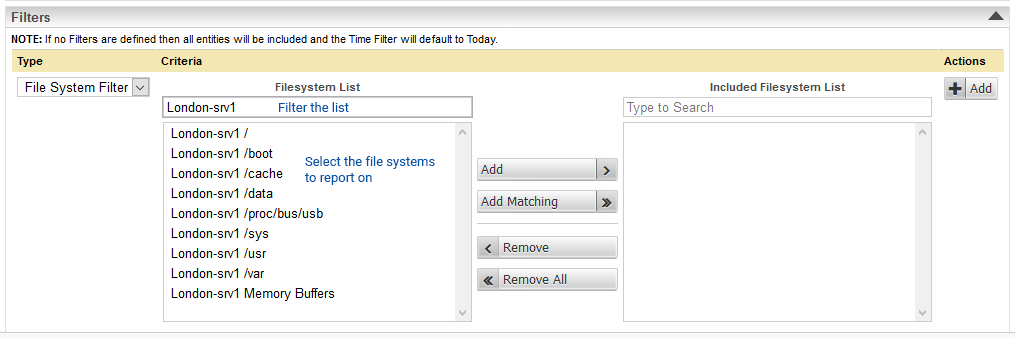
Filters Section
The filters section offers a range of filters to be applied to the available data prior to display. In addition to the time and group filters that are offered through the Console there are also filters specific to the Report Data Type.
- Select a filter Type
- Specify the required filter Criteria
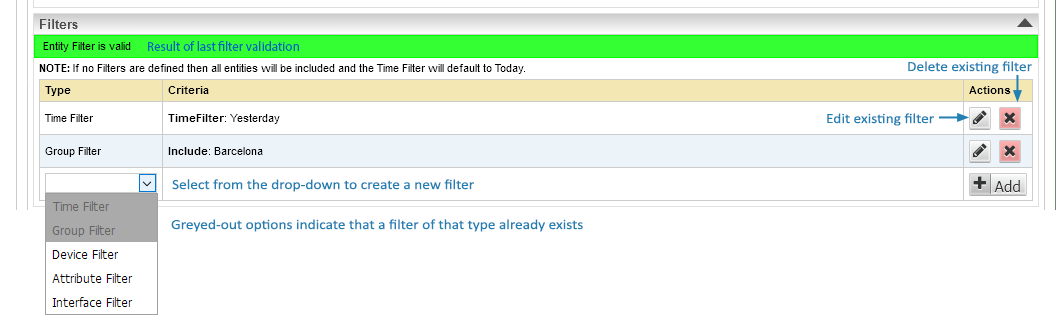
- Click Add, to confirm the filter
Confirming the filter will enable the option to specify additional filters.
Time Filters
Optionally specify a filter that will be supplied as the default time filter applied when running the report. This default time filter can be overridden from within the report using the in-report filter options.
- Select an existing time filter favorite from the list provided or create a custom timefilter to suit your requirements
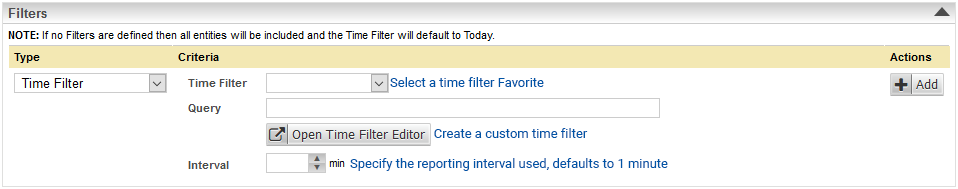
For details on creating custom time filters and managing the timefilter favorite list, see Time Filters
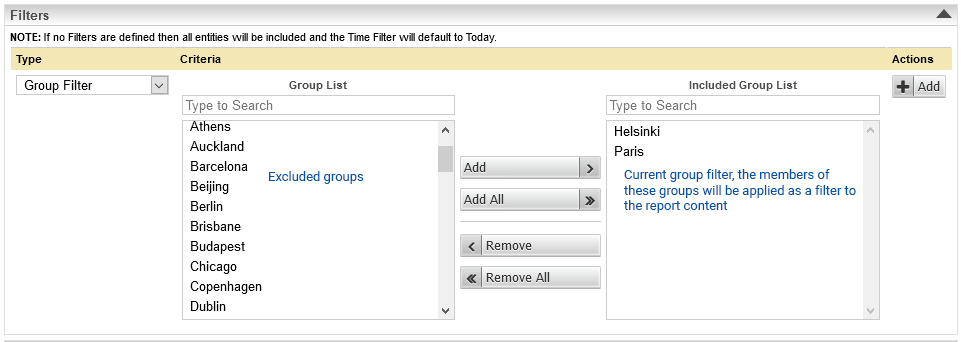
Group Filters
Optionally specify a group filter that will be supplied as the default when running the report. This default group filter can be overridden from within the report using the in-report filter options. When multiple groups are selected, members of any of the specified groups are included in the report content.
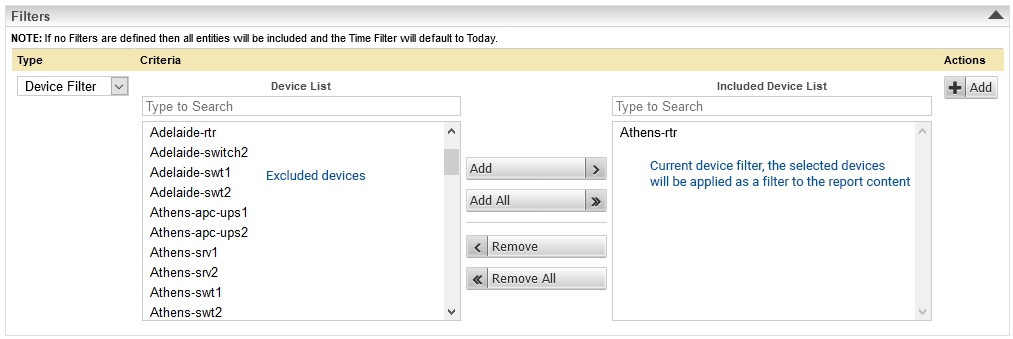
Device Filters
Optionally specify a device filter that will be supplied as the default when running the report. This default filter can be overridden from within the report using the in-report filter options.
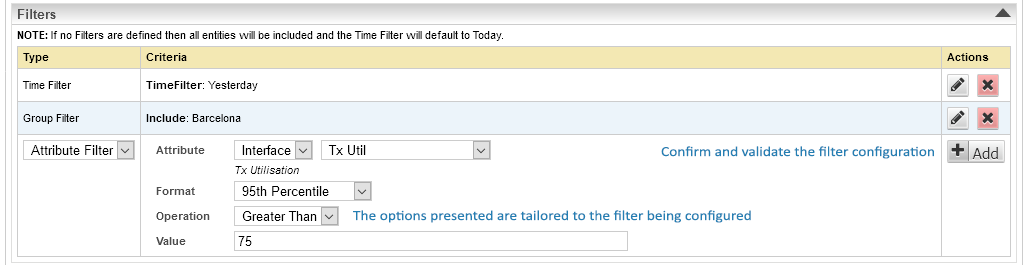
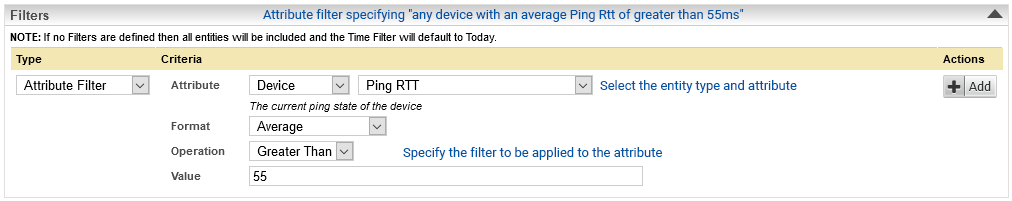
Attribute Filters
Optionally specify an attribute filter that will be applied the report. Any entity satisfying the filter will be included in the report when run. The in-report filters can be used to modify this content once the report has be launched.
Attribute filters include any configuration, event or timeseries metric available from the entity specified in the Report Data Type, or the generic ‘device’ entity.
Entity Filters
The final filter option varies according to the Report Data Type specified in the report configuration. In the image below the Report Data Type is File System, so the last filter option allows you to filter the report to specific file systems.
Fields Section
The Fields section will be displayed when Report Structure is set to Tabular Data. This section is used to specify the columns of the report.
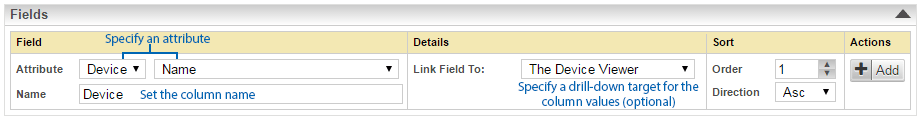
- Select a field to display in the report by specifying an Attribute
- Assign a Name to be used as the column header
- Configure drill-down for the column values if desired
- Click Add to confirm the field
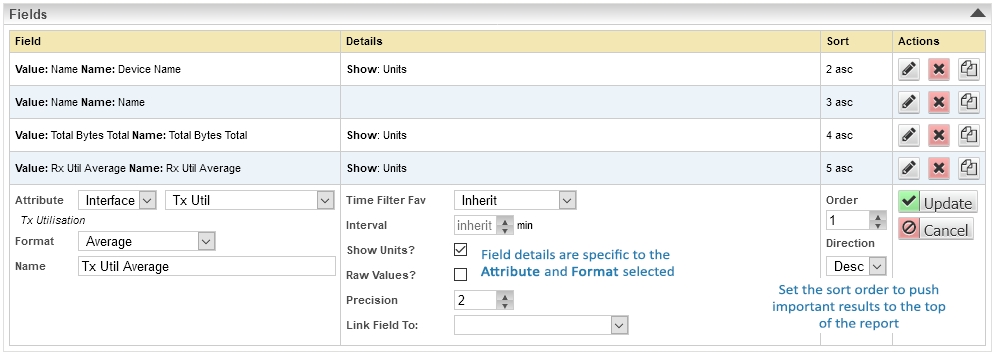
There are several available fields used to configure entries in the Field section. The fields displayed vary depending on the selections made during configuration, see the table below for details.
| Field | Required | Description | ||||||||||||||||||||||||||||||
| Attribute | The attribute to use for the field | |||||||||||||||||||||||||||||||
| Format | Data manipulation options. Displayed when the Attribute is a time-series data metric.
|
|||||||||||||||||||||||||||||||
| Name | Column name | |||||||||||||||||||||||||||||||
| Graph Type | Type of graph to be displayed in the report column. Available when Format = Graph | |||||||||||||||||||||||||||||||
| Graph Color | Color of in-column graph. Available when Format = Graph | |||||||||||||||||||||||||||||||
| Time Filter Fav | Time filter to be applied to in-field graph | |||||||||||||||||||||||||||||||
| Time Filter Query | Time filter query to be used when Time Filter Fav has been set to Custom | |||||||||||||||||||||||||||||||
| Interval | Interval to be used when collecting data for the field. Not available when Format = Graph. | |||||||||||||||||||||||||||||||
| Show Units? | Toggle to show/hide units used for the field | |||||||||||||||||||||||||||||||
| Raw Values? | Toggle to use raw or scaled granularity (e.g. present an interface Rx value in Bytes (raw) or GB/TB (scaled) | |||||||||||||||||||||||||||||||
| Precision | Number of decimal places to display | |||||||||||||||||||||||||||||||
| Link Field To | Target for a drill-down link | |||||||||||||||||||||||||||||||
| Report | A report to link to with the drill-down | |||||||||||||||||||||||||||||||
| Filters | Filters to pass with the linked drill-down target | |||||||||||||||||||||||||||||||
| URL | URL to target with a drill-down | |||||||||||||||||||||||||||||||
| Order | Report sort order | |||||||||||||||||||||||||||||||
| Direction | Sort direction for that column |
Graphs Section
The Graphs section will be displayed when Report Structure is set to Graphed Data. This section is used to specify the graph to be displayed within the report. Multiple data series can be plotted on a single graph and the graph legend will automatically update to detail the various data sources.
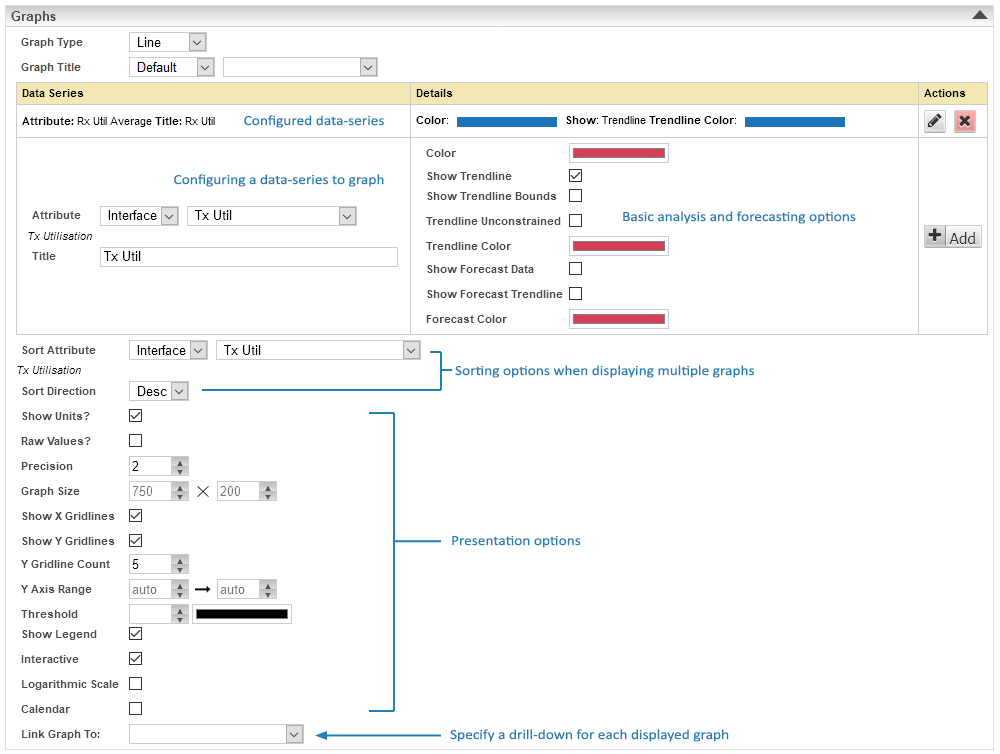
- Specify the Graph Type and Resolution and Color for representing the data
- Select a data series to graph by specifying an Attribute
- Specify the Sort Attribute and Sort Direction to be used when more than a single graph will be presented in the report
- Use the Link Graph To field to configure a drill-down, if that would be useful for the report
- Use the various options provided (see table below for details) to specify the appearance of the graph to be displayed and click Add to confirm the configuration
| Field | Required | Description |
| Graph Type | Type of graph to be displayed (line, bar, gauge, etc.) | |
| Graph Title | An optional title to be displayed for each graph in the report
|
|
| Resolution | Granularity of data to be displayed in the graph
Note: this property was moved to the timefilter configuration in v5.5.1. If a timefilter is not set, the custom report auto-assigns an interval suitable to the scope of the reporting period being displayed. Updating the reporting period via the Time Selector within the report will update this auto-assigned interval to best suit the new reporting period.
|
|
| Data Attribute | The data to be graphed | |
| Series Title | Label to be applied to the data series and displayed in the legend | |
| Color | Color used to represent the graphed data | |
| Show Trendline | Display a trendline for this series. A trendline is a ‘line of best fit’ for all data points in the specified reporting period. | |
| Show Trendline Bounds | Display upper and lower bounds for the trendline, for this series | |
| Trendline Unconstrained | Allows trendlines to range outside of the minimum and maximum observed for the data series in the specified reporting period | |
| Trendline Color | Color used to represent the trendline | |
| Show Forecast Data | Display forecast data for this series
Note: requires a timefilter that ranges into the future. E.g. a timefilter of range= start_of_last_month to now +30d will display forecast data 30 days into the future.
|
|
| Show Forecast Trendline | Display a trendline for forecasted data for this series. A forecast trendline is a ‘line of best fit’ based on the previous 6 months data history. | |
| Forecast Color | Color used to represent the forecast data | |
| Sort Attribute | Attribute used to sort the display of graphed data (this attribute does not need to be displayed on the graph to be used as the sorting attribute) | |
| Sort Direction | Direction used to sort the graphs based on the Sort Attribute | |
| Show Units? | Toggle to display/hide units in the graph legend | |
| Raw Values? | Toggle to show raw/scaled values (e.g. present an interface Rx value in Bytes (raw) or GB/TB (scaled) | |
| Precision | Number of decimal places to be displayed when presenting values | |
| Graph Size | Specify the size of the graph (width x height) in pixels | |
| Show X Gridlines | Toggle to show/hide reference lines for values along the X axis | |
| Show Y Gridlines | Toggle to show/hide reference lines for values along the Y axis | |
| Y Gridline Count | Number of reference markers to display for values along the Y axis | |
| Y Axis Range | Set to restrict the Y axis to specific range | |
| Show Legend | Toggle to show/hide the legend | |
| Interactive | Toggle to enable/disable graph interactivity, see Interacting with Custom Reports for details | |
| Logarithmic Scale | Toggle to apply a logarithmic/linear scale to the y-axis | |
| Calendar | Toggle to display the reporting period on a single x axis or broken into calendar weeks | |
| Link Graph To | Target for a drill-down link:
Note: the drill-drown is attached to the graph header/title.
Note: both the Any Custom Report, and Any URL link options allow you to configure additional filters to be passed with the link. These filters are advanced features, primarily intended for use by Statseeker support staff, to create specific, tailored workflows as needed. Please contact Customer Support for assistance with these filters.
|
|
| Report | A report to link to with the drill-down | |
| Filters | Filters to pass with the linked drill-down target | |
| URL | URL to target with a drill-down |
Embedded Reports Section
The Embedded Reports section will be displayed when Report Structure is set to Embedded Reports. This section is used to create a summary report featuring existing custom reports.
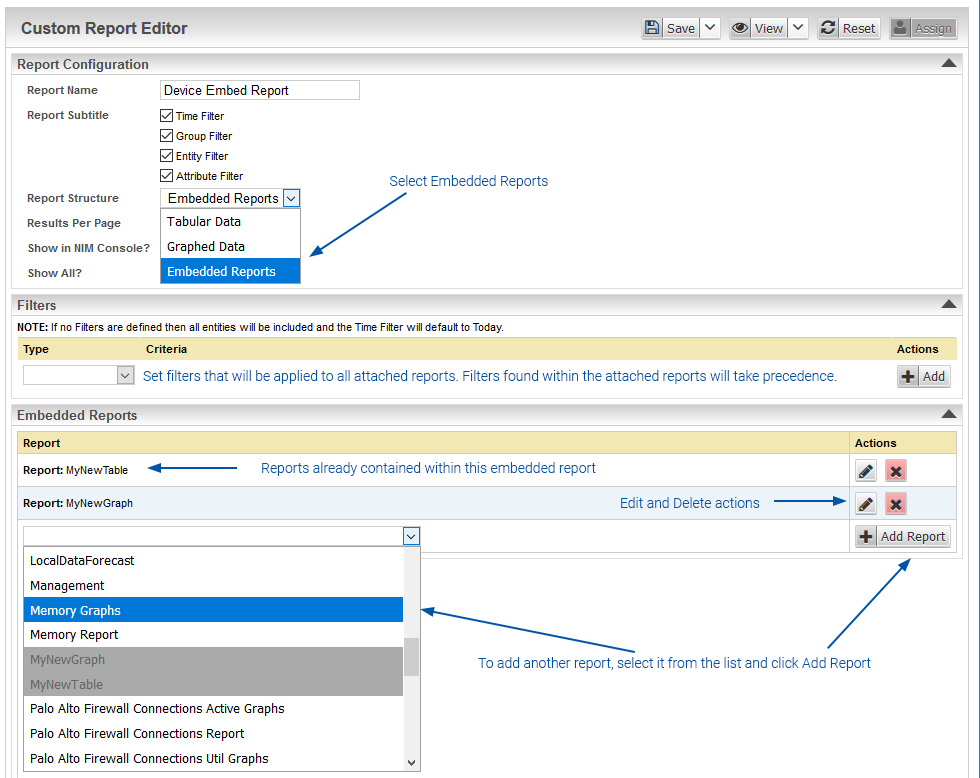
- Select a report from the drop-down and click Add
- Repeat the process as required to build the custom summary report
Once added, a report can be replaced or removed via the Edit, and Delete buttons respectively.
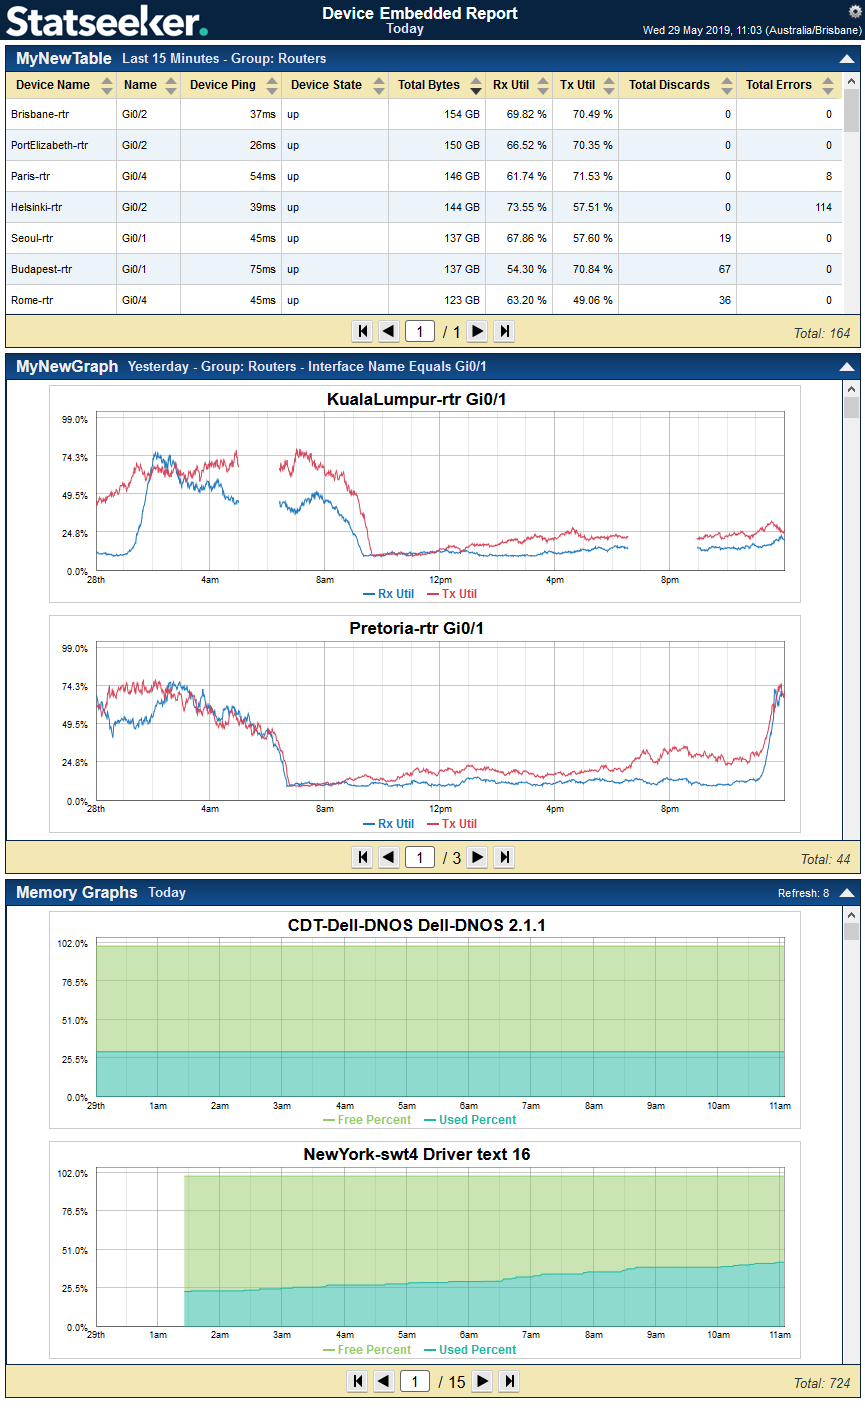
Running an embedded report will present all the attached reports sequentially, each report featuring its own scrollbar to manage pagination.
Links Section
The Links section is an optional section allowing you to append customized links to the end of each row in a tabular report or to the bottom of each graph in a graphical report. By supplying these links, you can easily create a customized workflow for reviewing elements of your network or troubleshooting.
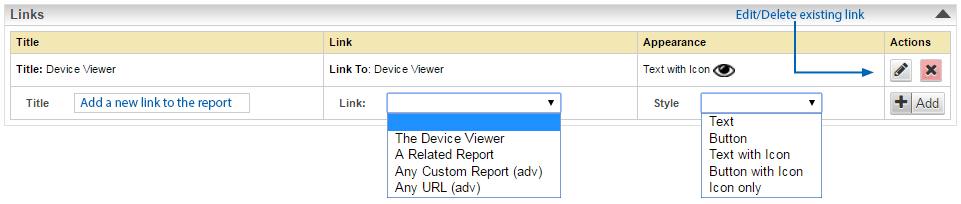
- Provide a Title
- Specify the Link target
- Select an Appearance for the link
| Field | Required | Description |
| Title | Title to be used to reference the link (is also used when the link Style includes Text | |
| Link To | Target for the link
Note: both the Any Custom Report, and Any URL link options allow you to configure additional filters to be passed with the link. These filters are advanced features, primarily intended for use by Statseeker support staff, to create specific, tailored workflows as needed. Please contact Customer Support for assistance with these filters.
|
|
| Report | A report to link to | |
| Filters | Filters to pass with the linked report | |
| URL | URL to target with the link | |
| Appearance | How the link should be represented in the report. Text, Button, and Text with Icon all use the value in the Title field as the string to display in association with the link. |
Previewing and Saving the Report
At any point during creating or editing a report you can preview or save the current state of the report or branch a report by saving a copy. The actions to do this are located at the top of the Custom Report Editor panel and only apply to the currently open custom report.
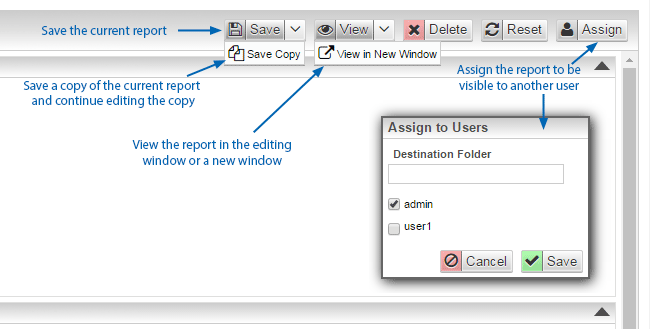
These actions and their uses are described in the table below.
| Action | Description |
| Save | Saves the current report under the specified Report Name |
| Save a Copy | Saves the current report and renames it by appending Copy n (where n is an incremented number) to existing value of the Report Name field. This copy is then opened in the editor. |
| View | Allows you to preview the report in Custom Report Editor panel but does not save any of the changes made in the current session. To return to editing the report and continue editing or to save the changes made, click Edit in the Reports panel. |
| View in New Window | Allows you to preview the report in a new window, keeping the report open in edit mode. No changes have been saved. |
| Delete | Delete the current report. You will be prompted to confirm the action prior to the report being deleted. |
| Reset | Returns the report to the last saved state, or, for a previously unsaved report, to a blank state. This action is applied immediately, no confirmation is sought. |
| Assign | Opens a modal allowing you to copy the report, in its last saved state, to another user’s Reports panel. This does not affect report visibility from within the Console, see Viewing Custom Reports from the Console for more on this. |
Managing Custom Reports & Folders
Depending on your needs, you may have many custom reports and Statseeker gives you the tools you will need to manage that collection. From the Reports panel, you can rename, organize, and distribute custom reports as needed.
Renaming Custom Reports
To rename a custom report:
- Select the report in the Reports panel
- Click Edit
- Edit the Report Name field
- Click Save
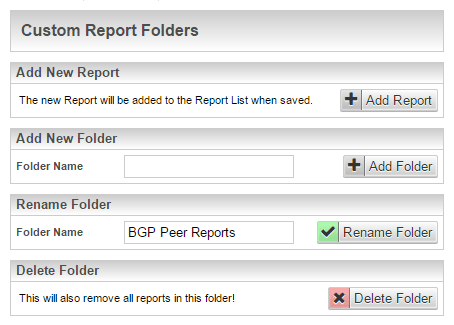
Report Folders
The Reports panel allows you to create folders to organize your custom report collection. These folders work just like a regular file system and are unique to a user. To create a new folder:
- Click Edit in the Reports panel
- Click the New Folder action at the top of the Reports panel
- Specify a Folder Name and click Add Folder
- Click and drag the folder to the new location
- Selecting the folder and clicking Edit
- Use the Rename Folder prompt in the Custom Report Folders panel to enter a new name and click Rename Folder
The Custom Report Folders panel will be displayed, containing a form for creating a new folder.
The new folder will be added to the directory tree in the Reports panel. To relocate the folder within the directory tree:
Folders can also be renamed by:
When creating a report, the Report Data Type not only determines the content options for the report, but also which folder a newly created report will be saved to in both the Reports panel and the Console. Once a report has been saved, it can be manually relocated to another folder, but changing the Report Data Type after the initial save/creation will not automatically relocate the report – this auto-categorization only occurs on the initial save of a newly created report.
Making a Report Visible to Another User
One of the actions available when editing a report is Assign. This can be used to manage the visibility of the report for other Statseeker users.
Likewise, unassigning a custom report from a user will only hide the report, for that user, within the Reports panel. If the user’s group configurations allow the report to be displayed within the Console, then these will need to be updated to prevent the report from being displayed within the Console.
To assign a report:
- Select the report and click Edit
- From the actions provided at the top of the Report Editor select Assign
- Use the associated checkboxes to set the visibility of the report for the various users
- Specify a folder to contain the report in the other user’s Reports panel
- Click Save
This will display the Assign to Users modal.
- If a folder with that folder name exists, then the report will be placed inside the existing folder
- If no folder exists with that name, then a new folder will be created
- If no folder name is specified, then a new folder named Assigned Reports will be created to house the report
- The creation of folders to house the copied report only occurs for other users, not the user assigning the report
Deleting a Custom Report
To delete a custom report:
- Select the report and click Edit
- Click Delete and confirm the action when prompted
- If the creator/owner of the report deletes the report, then it is deleted for all users. If the report has been assigned to other users and one of those users deletes the report then it is only removed from their account and remains visible for all other users.