
Index
Overview
Statseeker v5.2 brought fundamental changes to how thresholds, and consequently alerts, are configured. As part of the upgrade process, existing thresholds and their dependent alerts are automatically updated to fit within the new structure.
Major Changes
Time Filters
In previous versions, the Time Filter specified in the threshold dictated the monitoring period in which an event would be logged by Statseeker. The alert configuration also featured a time filter and this worked as a filter on those events and an alert was triggered if an event was recorded within the alerting period.
In Statseeker v5.2 this implementation of time filters has been moved entirely to the alert configuration. A time filter still exists in the threshold configuration but it has been re-purposed and now defines the data range to take into account when determining if a threshold is in breach. This time filter works with the interval field in the threshold configuration to provide a very flexible mechanism for controlling what data is considered when testing a threshold.
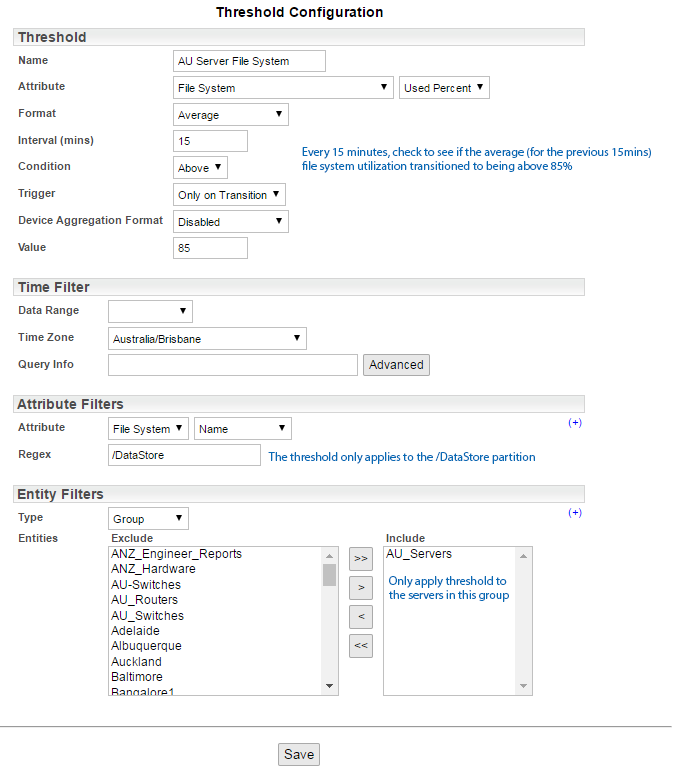
Example: Interval, no Time Filter
Every 15 minutes, check the average used percentage, for the previous 15 minutes, of the /DataStore partition, on servers in the AU_Servers group.
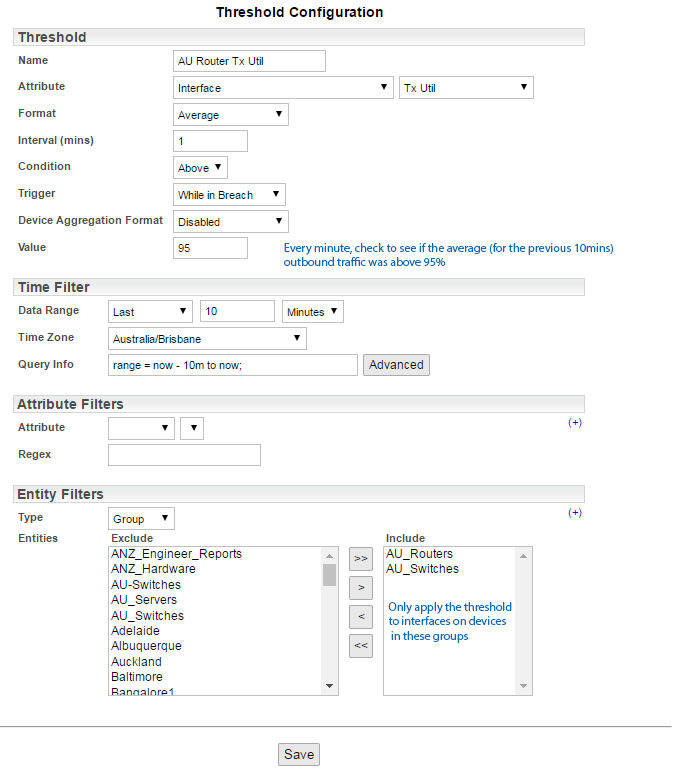
Example: Rolling Average
Every Minute, calculate the average Tx Utilization for all interfaces in the AU_Routers and AU_Switches groups, and trigger an alert if this average is greater than 95%.
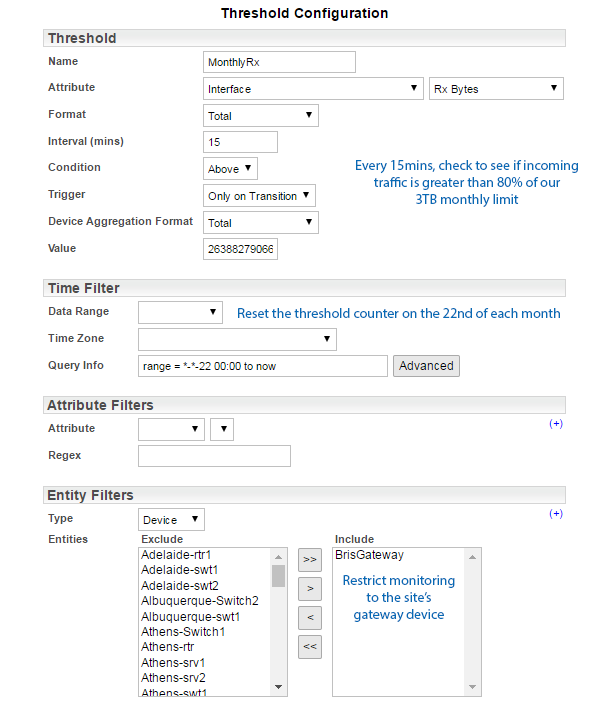
Example: Monthly Reset
Every 15 minutes, check the primary gateway router to see if incoming traffic is greater than 80% of the 3TB monthly limit for the site. The traffic count is reset on the 22nd of each month.
Threshold Triggers
Prior to Statseeker v5.2, all thresholds would trigger an event when in breach and keep triggering events for every interval that the threshold remained breached. The new thresholds offer an alternative triggering policy, Only on Transition.
This policy utilizes the concept of a threshold state:
- High: the monitored value is above that set threshold level
- Low: the monitored value is below that set threshold level
- Unknown: the monitored value cannot currently be determined because the device\interface is unreachable; typically, because it is offline or something upstream of the device\interface is offline
The event is only recorded when the threshold state changes. With this configuration, you would trigger an alert when the threshold is breached and not receive additional alerts (spamming) while you were addressing the issue.
This functionality, in conjunction with bundling and waiting policies, Upstream Device Configuration, and event management, provide you with the tool-set needed to configure your thresholds and alerting to suit any requirement.
Additions
The following features have been added to Statseeker thresholds.
Device Aggregation
Device aggregation allows you to combine data from all instances of the thresholded entity across a single device. Trigger alerts based on:
- CPU load metrics averaged across all cores on multi-CPU systems
- Interface utilization averaged across all interfaces on each thresholded device
- Total traffic or the 95th percentile across all interfaces on a device
Expanded Threshold Attributes
Statseeker v5.2 expanded upon the data metrics that you can set thresholds against to cover all metrics that you can report on within Statseeker, including predictive metrics such as data forecast values and trend-line analysis extending into the future.
Event Database Migration
Statseeker stores all event records (ping up/down/ changes to ifOperStatus & threshold events) in a dedicated events database. These event records are also updated as part of the upgrade to Statseeker v5.2. This process may take an hour or two for large databases, and consequently the processes is run post-upgrade so that you are not without Statseeker’s monitoring capabilities during that time. Statseeker will provide alerts in the upper-right corner of the NIM Console indicating the progress of the event database upgrade.
If Statseeker encounters an event format that it cannot migrate successfully, then this is recorded in the Statseeker log and details about the failure are recorded as follows:
- Configuration data for the existing event, and the reason for the migration failure are recorded in /home/statseeker/nim/data/nim-thresholds-events-not-upgraded.csv
- Event records for each instance of that event are recorded in /home/statseeker/nim/data/nim-thresholds-records-not-upgraded.csv
Potential reasons for a failed event migration are:
- The event references a device that has been retired or deleted; this is by far the most likely reason for a failed event migration
- The event references a threshold that has been deleted
- Filesystem threshold events where the storage type is hrStorageVirtualMemory
If an event migration failure does occur, it does not impact your threshold or alerting configurations or functionality. The failure is restricted to select instances in your event history detailing previous threshold breaches etc.