Index
- Overview
- Adding Forecast Data to a Tabular Report
- Adding Forecast Data to a Graph
- Adding Forecast Data to Dashboards
- Referencing Forecast Data in Threshold Configurations
Overview
Statseeker forecasting refers to using your data history to provide some insight into your future data; particularly useful for capacity planning. Statseeker analyzes your historical data for the metric being forecast and returns a data range for each reporting period across the forecast duration.
Forecast data can be added to both tabular and graphical reports that have been created in the Reporting panel.

Adding Forecast Data to a Tabular Report
To add forecast data to a report:
- Select Reports from the main navigator
- Click Edit
- Select the report you want to add forecast data to
In the example used here we have selected an interface received traffic report so that is the metric we will be retrieving forecast data on.
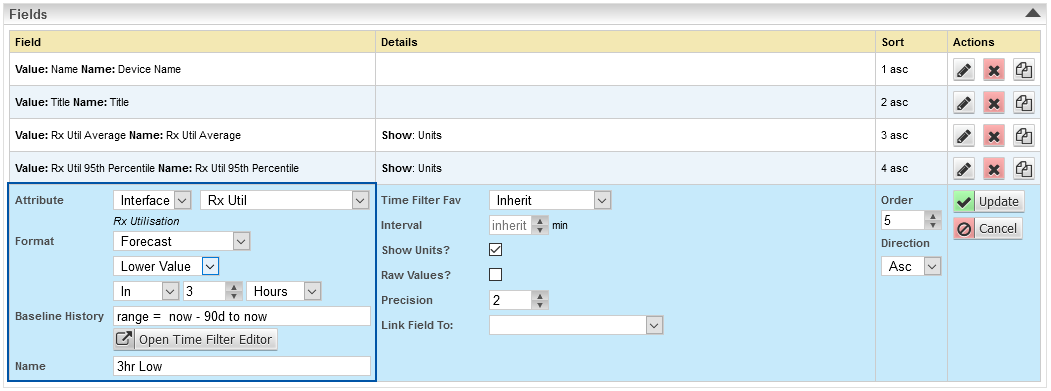
- Add a new field by selecting the desired metric, in this instance, Interface – Rx Util
- Set the Format field to Forecast
This will display additional fields under Forecast offering a drop-down list of forecast analytic options and a time frame for the forecast.
- Select a forecast analytic option
- Value – the median value in the forecast data range for that point in time
- Upper Value – the highest value in the forecast data range for that point in time
- Lower Value – the lowest value in the forecast data range for that point in time
- Daily Change – the forecast daily delta value i.e. the predicted daily change in the average value for the metric
- Optionally specify the Baseline History; a timefilter specifying the scope of historical data used when calculating forecast values.Defaults to previous 6months (range = now – 180d to now), for details see Baselining Time Range
- Supply a name for the column header
- Click Add
- This process can be repeated to add additional forecast analytics as desired
In the example below we have added fields for Lower Value, Value, and Upper Value 3 hrs into the future.
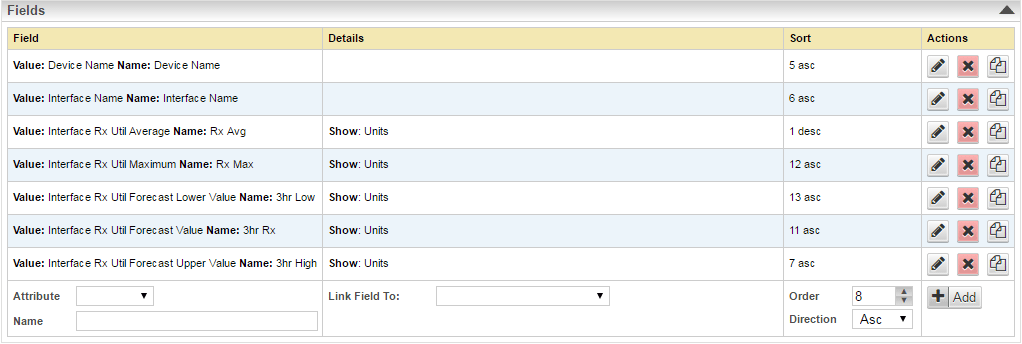
- Save the report
- Select Reports from the main navigator
- Click Edit
- Select the report you want to add forecast data to
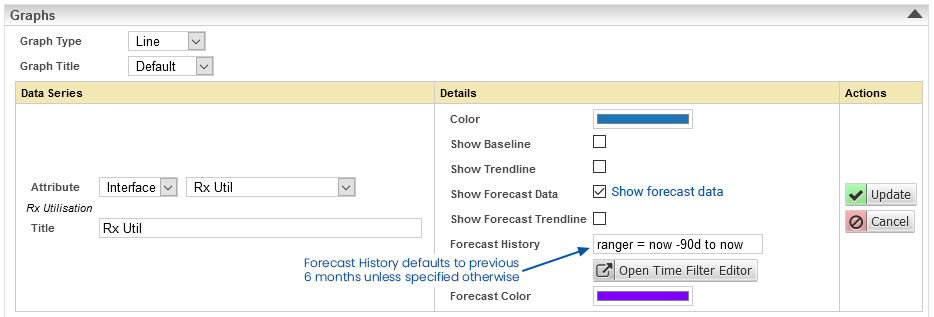
- From the Graphs section, select a metric that you want to forecast data for and click the edit button
- Check the Show Forecast Data box
- Optionally specify the Baseline History; a timefilter specifying the scope of historical data used when calculating forecast values.Defaults to previous 6months (range = now – 180d to now)
- Click Update
- Repeat this process for any other metrics displayed on the graph that you also want to display forecast data for
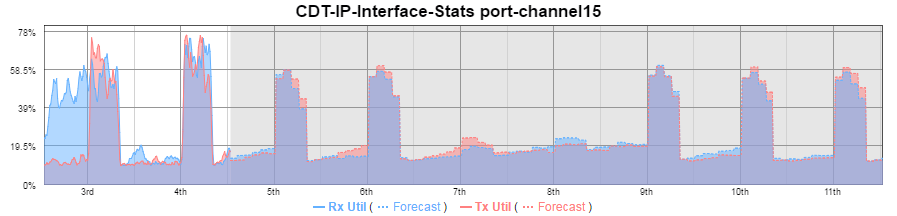
- Update your report timefilter to ensure that the timefilter extends into the future e.g. range= now – 30d to now + 30d
- Click Save
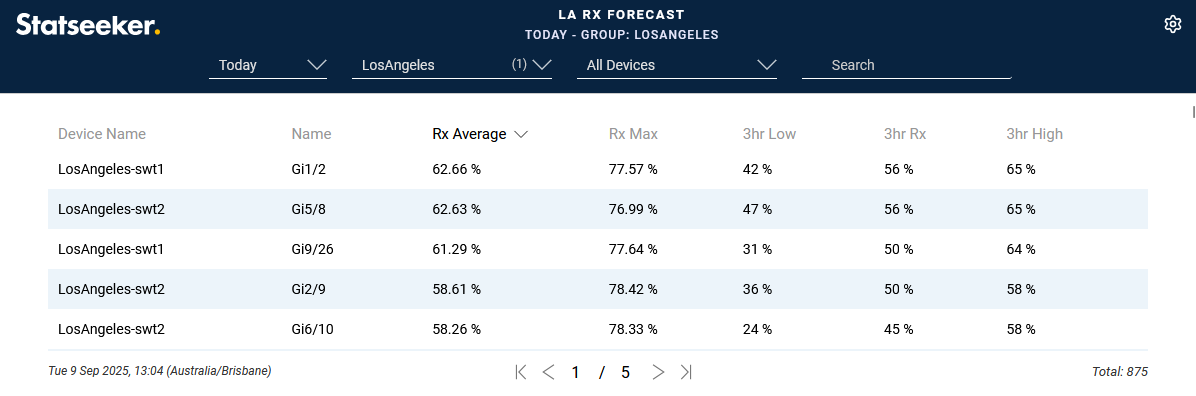
- View the report
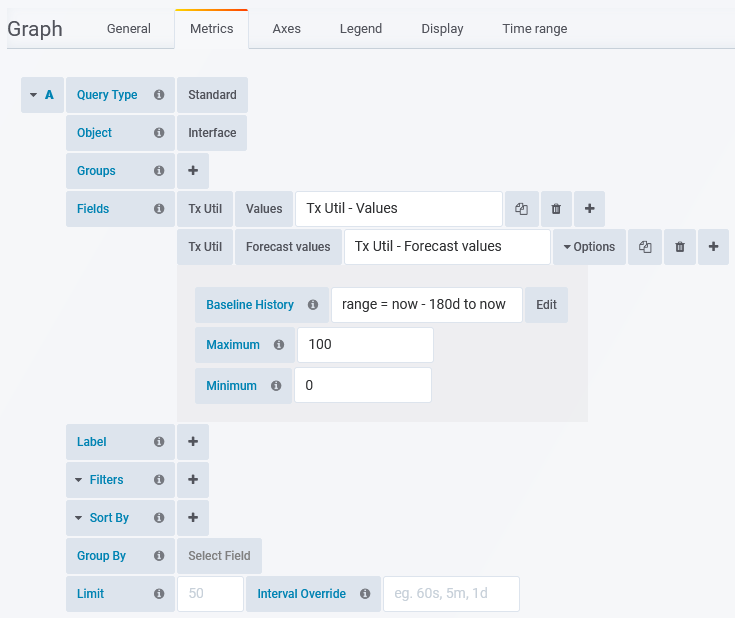
- Set the field
- Set the format to one of the forecast formats, see Dashboard Timeseries Data Formats for details
- Use the Options button to specify Baseline History, for details see Baselining Time Range
- Set the Attribute
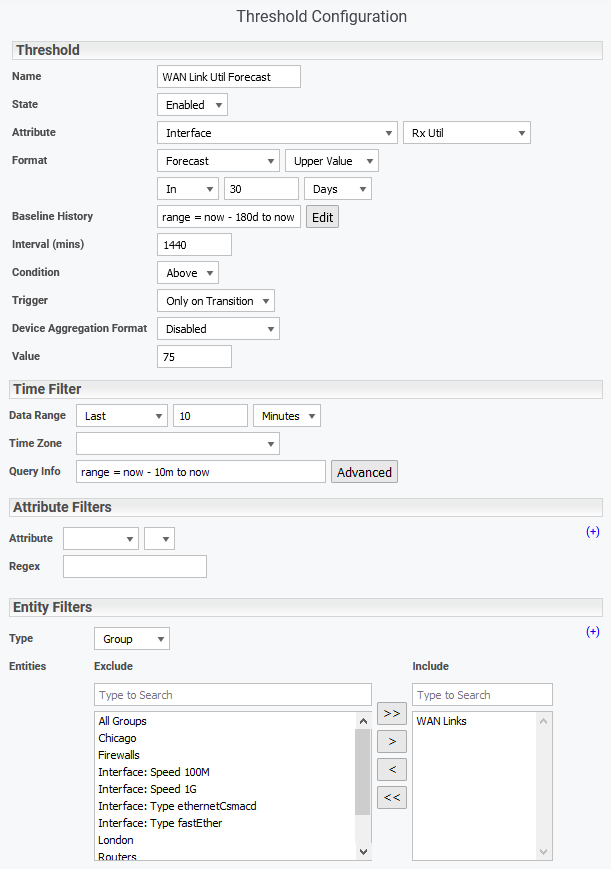
- Set the Format to Forecast and specify the forecast format:
- Value – the forecast average value at a specified point in time
- Upper Value – the upper boundary of the forecast value range
- Lower Value – the lower boundary of the forecast value range
- Daily Change – the average daily change of forecast values
- Specify the forecast point in time
- Specify Baseline History as needed, for details see Baselining Time Range
- Assign the threshold values, triggers and filters as needed, see Threshold Configuration for details
Adding Forecast Data to a Graph
To add forecast data to a report:
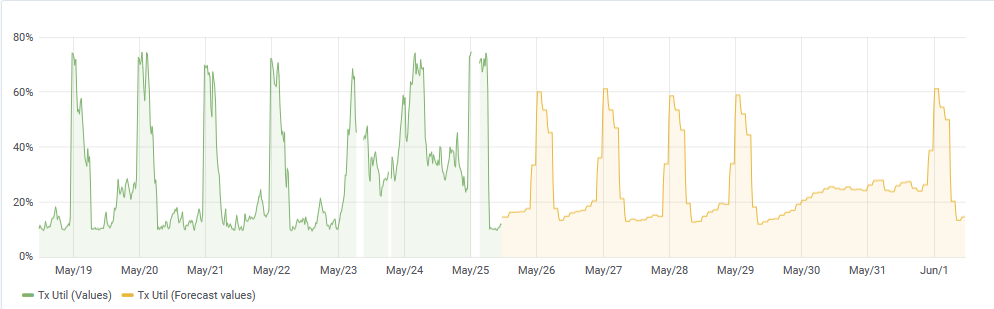
In the example used here we have selected an interface traffic report.
Adding Forecast Data to Dashboards
Forecasting can be applied to timeseries fields used in the Fields, Filters and Sort By sections of your dashboard configurations. Applying forecasting formats only differs from applying other formats in that they require additional options set to specify the Baseline History and optionally apply limits to maximum/minimum forecast values.
To add forecast data to your dashboards as either field or filter content:
Referencing Forecast Data in Threshold Configurations
Forecast data can also be utilized in Threshold configuration.