Index
- Overview
- Adding Anomaly Detection to a Report
- Graphing Anomalous Behavior
- Adding Anomaly Detection to Dashboards
- Referencing Anomaly in Threshold Configurations
Overview
Statseeker Anomaly Detection allows you to confirm whether or not the data being reported is out of the ordinary. This is achieved by comparing the current data against the previous 6 months of historical data, and returning a single value indicating how unusual the current data is. This functionality allows you to see, at a glance, if what is currently being reported is potentially a problem.
Anomaly reporting is available in custom reports and can be used with existing threshold and alerting capabilities.
Adding Anomaly Detection to a Report
Anomaly detection is only available for tabular reports created with the Reporting panel. To add anomaly detection to a report:
- Select Reports from the main navigator
- Click Edit
- Select the report (or create a new report)
- Go to the Fields section within the report configuration to add the new field
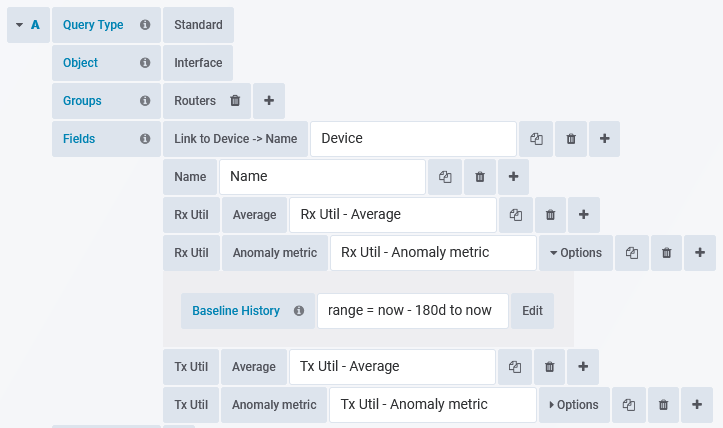
Anomaly detection is a Format option for many reportable metrics, in the example below we will be adding anomaly detection for Interface Transmit Utilization
- Set the attribute for the metric that you want anomaly detection performed on, in this instance we are selecting Interface Tx Util
- Set the format to one of:
- Anomaly Metric – for reporting how unusual the current data is and whether this is a higher/lower value than expected (positive/negative metric). Anything outside of the -90% – 90% range is potentially an issue.
- Anomaly Strength – for reporting how unusual the current data is (anything > 90% is potentially an issue)
- Optionally specify the Baseline History; a timefilter specifying the scope of historical data used when calculating anomaly values. The Baseline History defaults to previous 180 days (range = now – 180d to now) but can be updated to compare report data to that found in the specified baseline history, for details see Baselining Time Range.
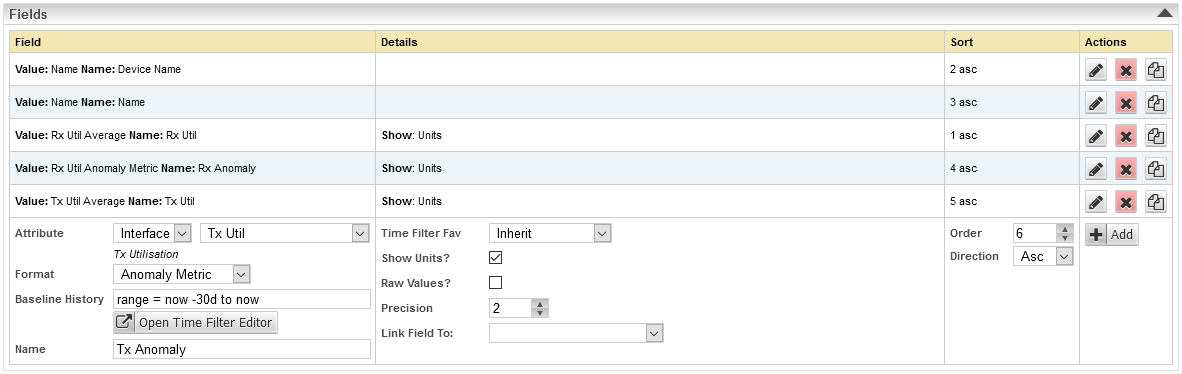
- Name the field appropriately and click Add
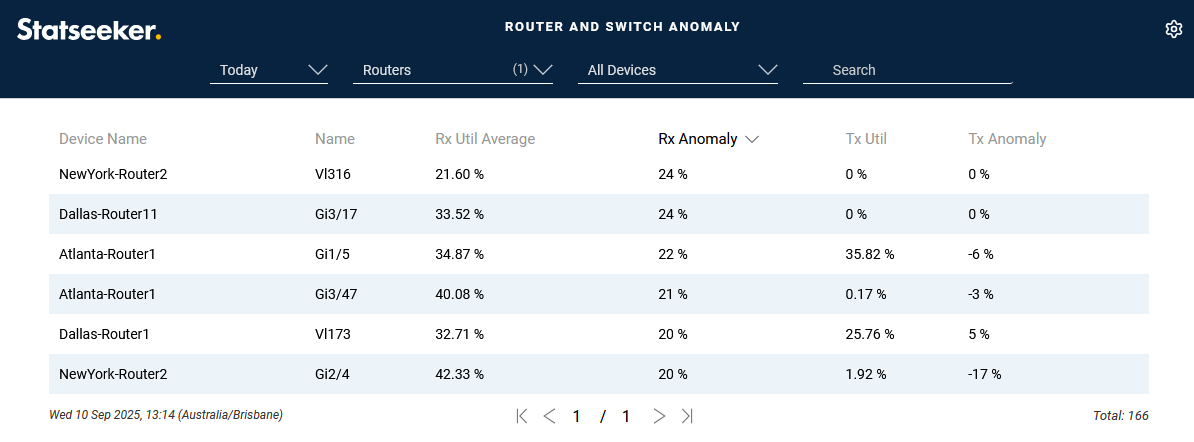
- Save and View the report
Graphing Anomalous Behavior
Anomaly metrics are aggregated values, i.e. a single value to represent a range of data, and so are not suitable for graphing. Instead, overlay historical baseline data to produce a comparison with report data, providing a visual indication of anomalous behavior.
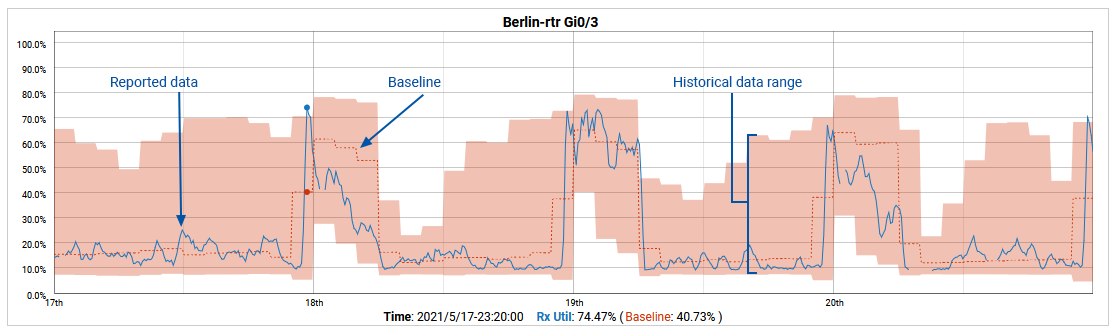
See Baselining for details on adding historical baseline data to graphs in reporting and dashboards.
Adding Anomaly Detection to Dashboards
Anomaly detection can be applied to timeseries data used in dashboards. The Fields, Filters and Sort By sections of your dashboard configurations all allow anomaly formats. Applying anomaly formats only differs from applying other formats in that they require additional options set to specify Baseline History.
To add anomaly data to your dashboards as either Field, Filter or Sort By content:
- Set the field
- Set the format to one of the anomaly formats
- Optionally, use the Options button to update Baseline History from the default ‘last 180 days’, for details see Baselining Time Range
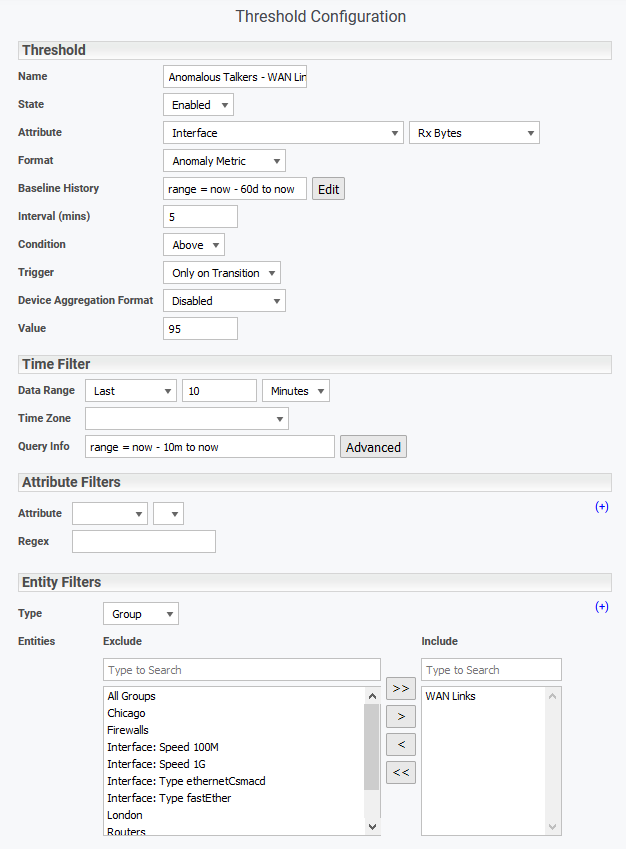
Referencing Anomaly in Threshold Configurations
Anomaly metrics can also be utilized in Threshold configuration.
- Set the Attribute
- Set the Format to Anomaly Metric/Strength
- Specify Baseline History as needed – this is the historical data used when comparing current behavior, for details see Baselining Time Range
- Set Value to:
- Anomaly Metric: 95
- Anomaly Strength: 95 – unusually high values
- Anomaly Strength: -95 – unusually low values
- Assign the threshold triggers and filters as needed, see Threshold Configuration for details