
Index
- Overview
- Main Navigator
- Global Search
- Alerts Indicator
- Current User
- Help / Support
- Report List
- Group Filter
- Device List
- Time Filter
- General Filters
- Clear Filters
Overview
Statseeker’s Console is where users will spend much of their time when interacting with Statseeker. The Console provides quick access to both stock and custom reports, as well as the various filters and reporting options used to tailor the output of those reports to suit your requirements at the time.
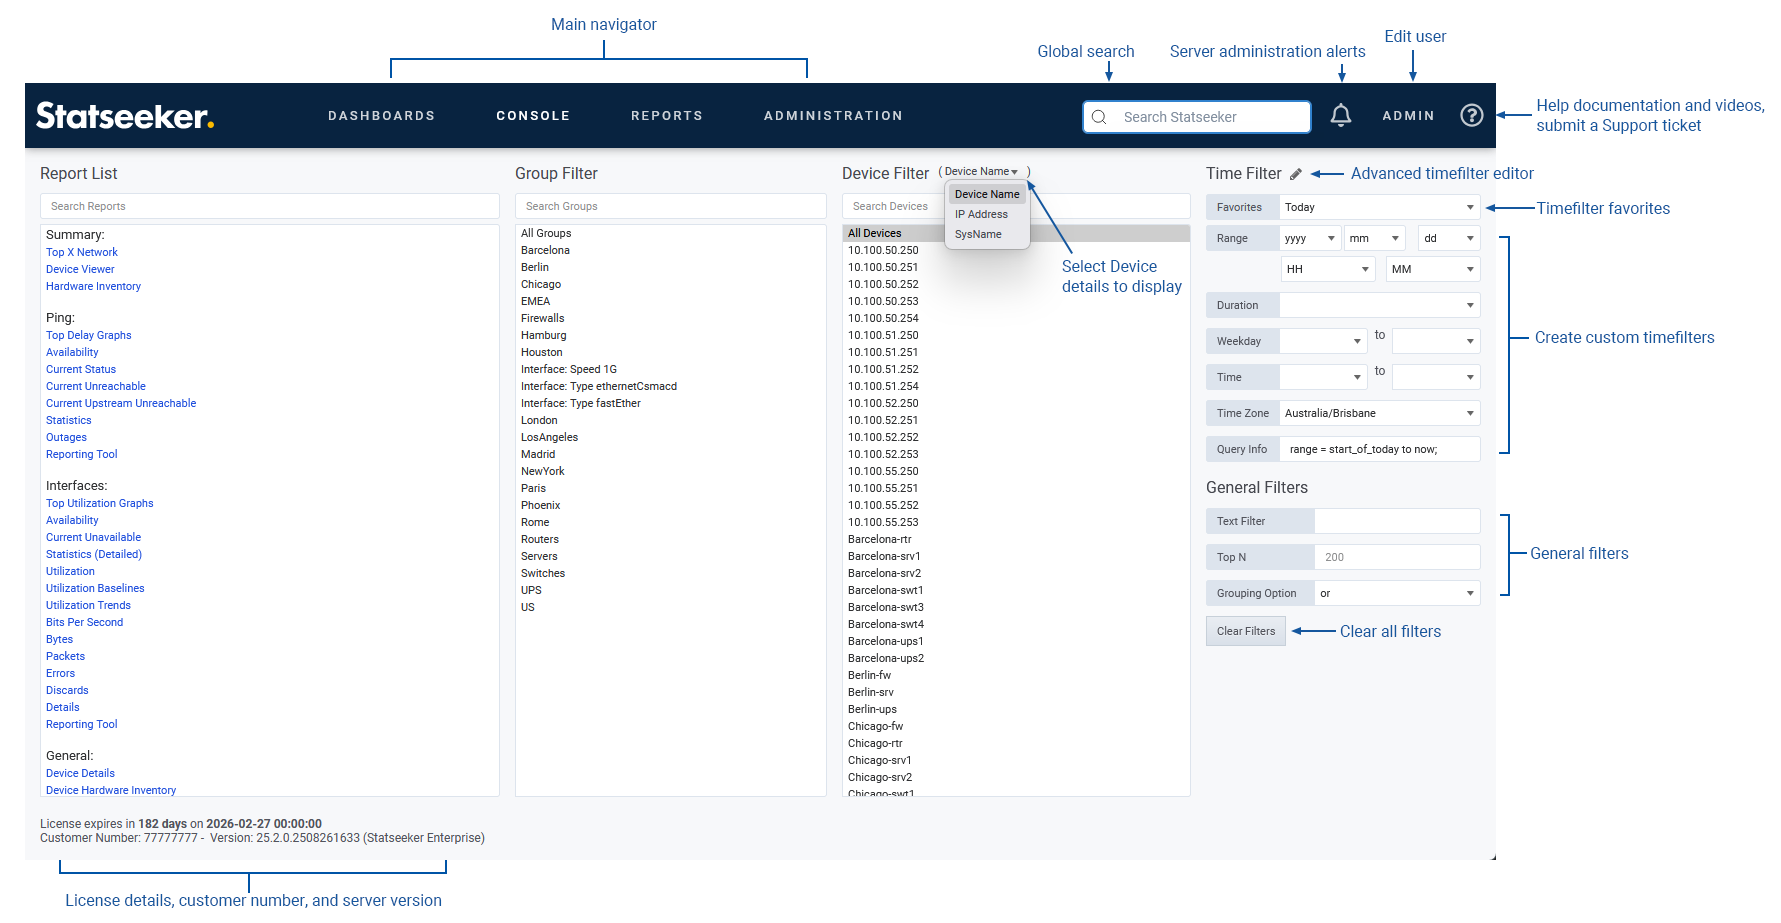
Main Navigator
The Main Navigator offers access to the 4 major components of the Statseeker user interface and is persistent in all views.
- Dashboards – view, create, edit, and manage Statseeker Dashboards
- Console – the main Statseeker Console
- Reports – view, create, edit, and manage reports. All saved reports are, be default, available from both the Reports and Console panels.
- Administration – opens Administration. This action is only visible to user accounts with the Admin role.
Global Search
The search option enables users to search the entire Statseeker deployment. The search can return matching results from:
- Device lists
- Interface lists
- Statseeker Group configurations
- Reports (stock and custom)
- Dashboards (stock and custom)
- Administration – all functionality and services in the Administration section
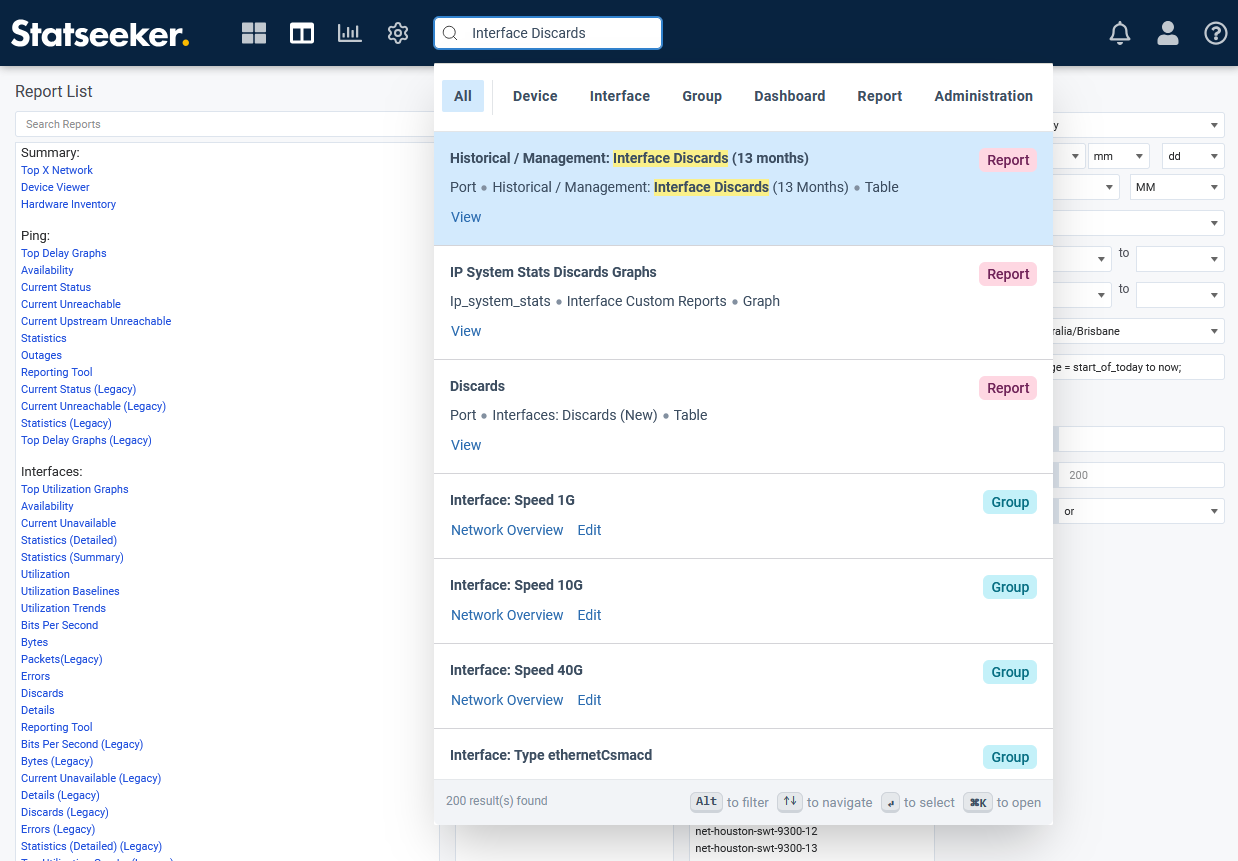
Search results are filtered based on the user’s permissions, meaning only items (reports, devices, etc.) that the user has access to will be shown in the results (see Managing User Permissions for details), and are indexed every 20 minutes.
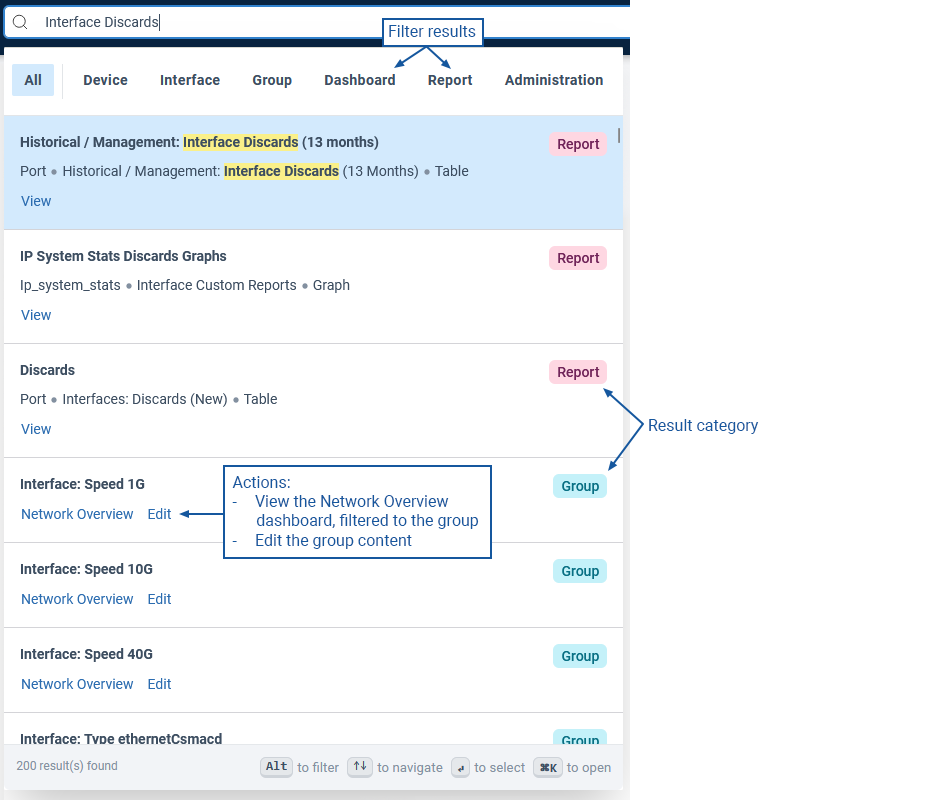
Global Search Filters
The search can be refined using filters displayed at the top of the results, allowing users to focus on specific areas such as Devices, Interfaces, Groups, Dashboards, Reports, and Administration. Each search result includes the type of entity (Device, Group, Report, etc.) and offers actions relevant to the result, such as View a report, Edit an interface configuration, or a link to a dashboard or report focused on that entity.
Keyboard Shortcuts
The Global Search features keyboard shortcuts for all actions:
| Key | Action |
| Ctrl+K | Open the search panel |
| Alt + (← or →) | Move between category filters |
| ↑ ↓ | Move between search results |
| Ctrl + (← or →) | Move between actions within the currently selected search result |
| Enter | Execute the currently selected action |
Global Search Settings
The search function can be modified to enable ‘typo’ tolerance. If enabled, the global search feature will consider words that are a few characters off from the query terms as matches. To enable typo tolerance:
- Select Administration > Network Discovery – Advanced Options > Advanced Options
- Click File Edit Mode
- Search for search_typo_tolerance, if not found, add it
- Set ‘search_typo_tolerance’ ‘on’ and Save the change
Alerts Indicator
The alerts indicator highlights the presence of alert messages concerning the operational state of the Statseeker server – lack of connectivity, resources, etc.
There are two modes that can be toggled by clicking the icon:
 – a filled icon indicates that the alerts are overlaid on the console, that the alert has been acknowledged, or that the issue has been resolved
 – if the icon is empty, the number of current alert messages will be displayed on the icon, but the message itself is only briefly displayed. The count remains until the alert is acknowledged or the issue resolved.
Current User
Mousing over the user icon offers two options:
- User Configuration – edit the current user details, for details on editing user accounts, see Editing Users
- Log Out – log the current user out of Statseeker
Help / Support
The Help / Support button offers two options:
- Documentation – opens the Statseeker documentation library in a new browser tab. This library contains documentation and video guides for the latest version of Statseeker.
- Support Request – this action will open a support request form, pre-populated with your Statseeker Server ID.
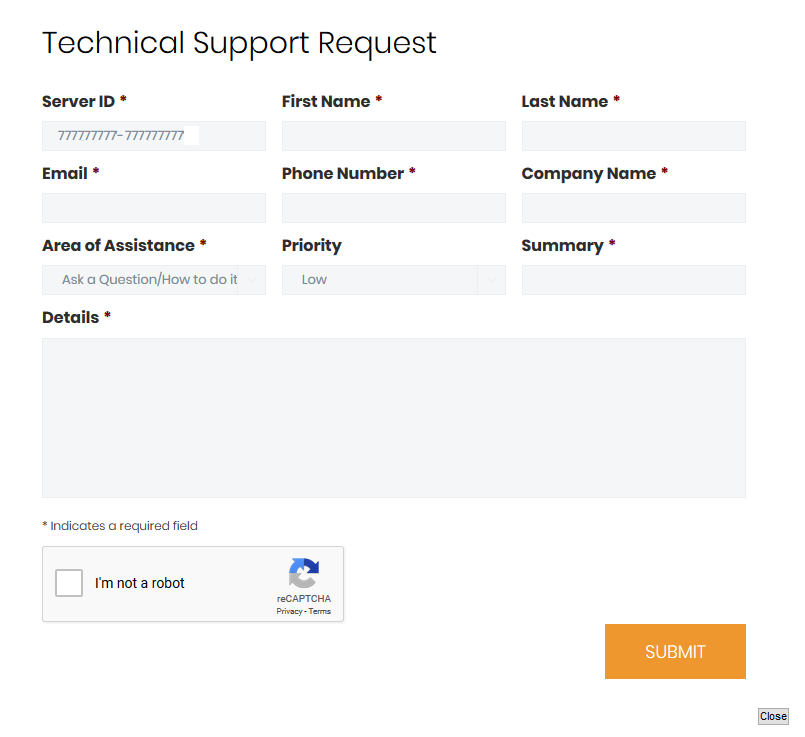
To submit a ticket:
- Complete the form, selecting from drop-down lists where needed
- Process the reCAPTCHA
- Click Submit
The ticket will be passed to Statseeker’s Technical Support team, and a member of that team will contact you shortly via the details provided in the form.
Report List
The Report List contains every stock report that the user has permission to view, and every custom report that the user has permission to view that has been flagged to be displayed in the Console.
- For details on running and filtering reports, see Running and Filtering Reports
- For details on Report configuration, see Custom Reports
Group Filter
The Group Filter contains the default interface groups and every group, created manually or through auto-group creation, that the user has permission to see. These groups can be passed through to reports as a filter to focus the report on the selected group or groups. The list can be filtered via the search field above the list. For details on creating and populating groups, see:
For further information on the relationship between users and groups, and how to use grouping to manage the visibility of your network that a user has through Statseeker, see Users and Groups.
Device Filter
The Device Filter contains every device on your network that Statseeker has access to, including references to retired devices. The list can be filtered via the search field above the list and selections from the device list are passed through to reports as a filter to focus the report upon the selected device/devices.
The Device list can display the device name, IP address or the sysName, as determined by the selection in the dropdown. By default, the Device List displays a maximum of 1000 entries (searching or filtering applies to the entire device list, not the displayed subset of devices) and this limit may be altered, see Editing the Device List Display Limit for details.
Time Filter
The specified time filters are applied to default ‘event based’ reports (ping, ifOperStatus, ifAdminStatus, threshold breaches, etc.) and all custom reports that do not have an embedded timefilter. For details on creating and using time filters, see:
The time filter in the Console is comprised of three elements:
- Favorites – a drop-down list of saved time filters
- Time Filter Creation – fields and lists used to create a custom time filter
- Advanced Time Filter Editor – pencil icon (
 ) opens the Advanced Time Filter Editor, which can be used to create and test complex time filters
For details on time filters, creating favorites, and using the Advanced Time Filter Editor, see: Time Filters.
General Filters
These filters are passed through to any report that is run. For more details on these filters, see Console Reporting – Report Filters.
Clear Filters
Clears the content of all filter fields in the Console.