Index
Overview
Statseeker can monitor, report, threshold and alert on your existing Cisco Network-Based Application Recognition (NBAR) implementation.
NBAR is a classification engine that can recognize a wide variety of applications, including Web-based applications and client/server applications that dynamically assign TCP or User Datagram Protocol (UDP) port numbers. After the application is recognized, the network can invoke specific services for that particular application.
NBAR output provides insight into both the requirements of your network and current usage characteristics, and is complementary to NetFlow data. This visibility can be used to support quality-of-service (QoS) rules to limit bandwidth and drop selective packets for non-critical services, avoiding congestion and performance degradation of those elements deemed critical to your network.
NBAR Configuration
Due to the number of protocols that can be collected with NBAR monitoring, and the impact that unconstrained NBAR collection can have on data storage, NBAR monitoring is disabled by default. Prior to enabling NBAR collection, it is advised that you assess the required scope for NBAR management and configure Statseeker accordingly. Typically, you will only require NBAR monitoring for your main WAN links.
To enable NBAR monitoring:
- Select Admin Tool > Network Discovery > Custom Data Ranges to display the associated configuration page
- Click Edit (top-right) to enable configuration
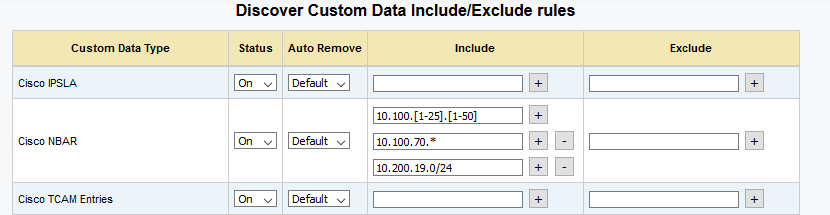
- Locate Cisco NBAR and set the Status to On
By default, Statseeker will query all interfaces on your network for any custom data type that has been enabled, so it is recommended that ranges be assigned for these data types to assist in keeping within licensed entity limits.
To assign a discovery range for a custom data type:
- Go to Administration Tool > Network Discovery > Custom Data Ranges to display the associated configuration page
- Click Edit (top-right) to enable configuration
- Rules to include/exclude multiple data ranges can be assigned in the following formats:
include/exclude NetworkAddress[/Netmask] or NetworkPattern
Additional include/exclude ranges may be added/removed by clicking the +/- buttons
- Click Save
- Initiate a network rewalk, or run a discovery process across the ranges included in the NBAR configuration, see the Discovery Process for details
- The include/exclude IP ranges specified for a CDT type must be a subset of those in the IP Address Scan Ranges or Hosts File entries
Reporting, Thresholds, Alerting & Dashboards
There are a 2 top-level NBAR related reports, the Cisco NBAR and Cisco NBAR Interfaces reports, (with drilldowns to additional device and/or NBAR specific reports) available on all Statseeker servers. In addition to the provided standard reports, there is the ability to create:
- Custom NBAR reports – set Datatype = Cisco NBAR, see Custom Reports
- Thresholds – set Attribute = Cisco NBAR, see Threshold Configuration
- Alerts – set Event Type to one of your previously configured NBAR thresholds, see Alerting
- Dashboards – set Object = Application > Cisco NBAR/Interface – Cisco NBAR, see Dashboards
Cisco NBAR Interfaces Report
The Cisco NBAR Interfaces report details all interfaces currently being monitored for NBAR data. This report can be used to ensure that you are actively reporting NBAR data across the interfaces where it is necessary, and are not monitoring NBAR traffic where it is not needed. The scope of NBAR reporting on your network can be modified from the Admin Tool, see NBAR Configuration for details.
The report presents device/interface combinations currently being monitored for NBAR data, and details both inbound and outbound traffic rates and utilization.
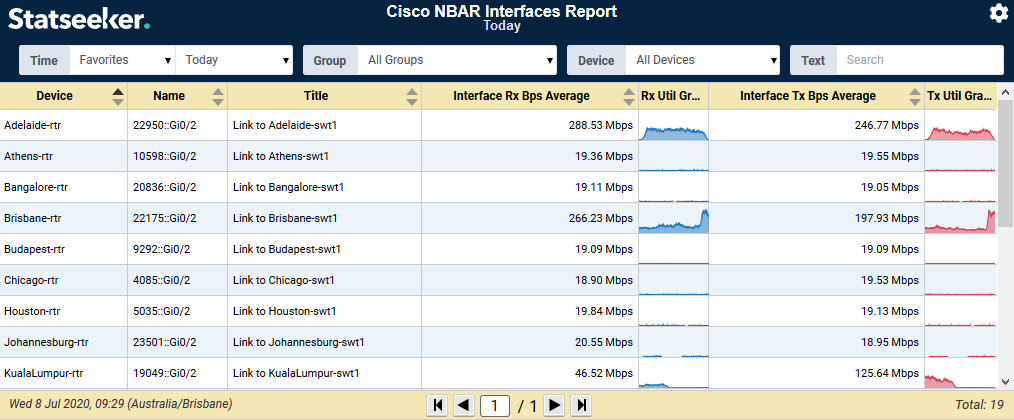
The reporting period can be altered within the report via the time selector in the report header and the report features drill downs to both the Device Viewer and NBAR Report filtered to the device/interface being selected.
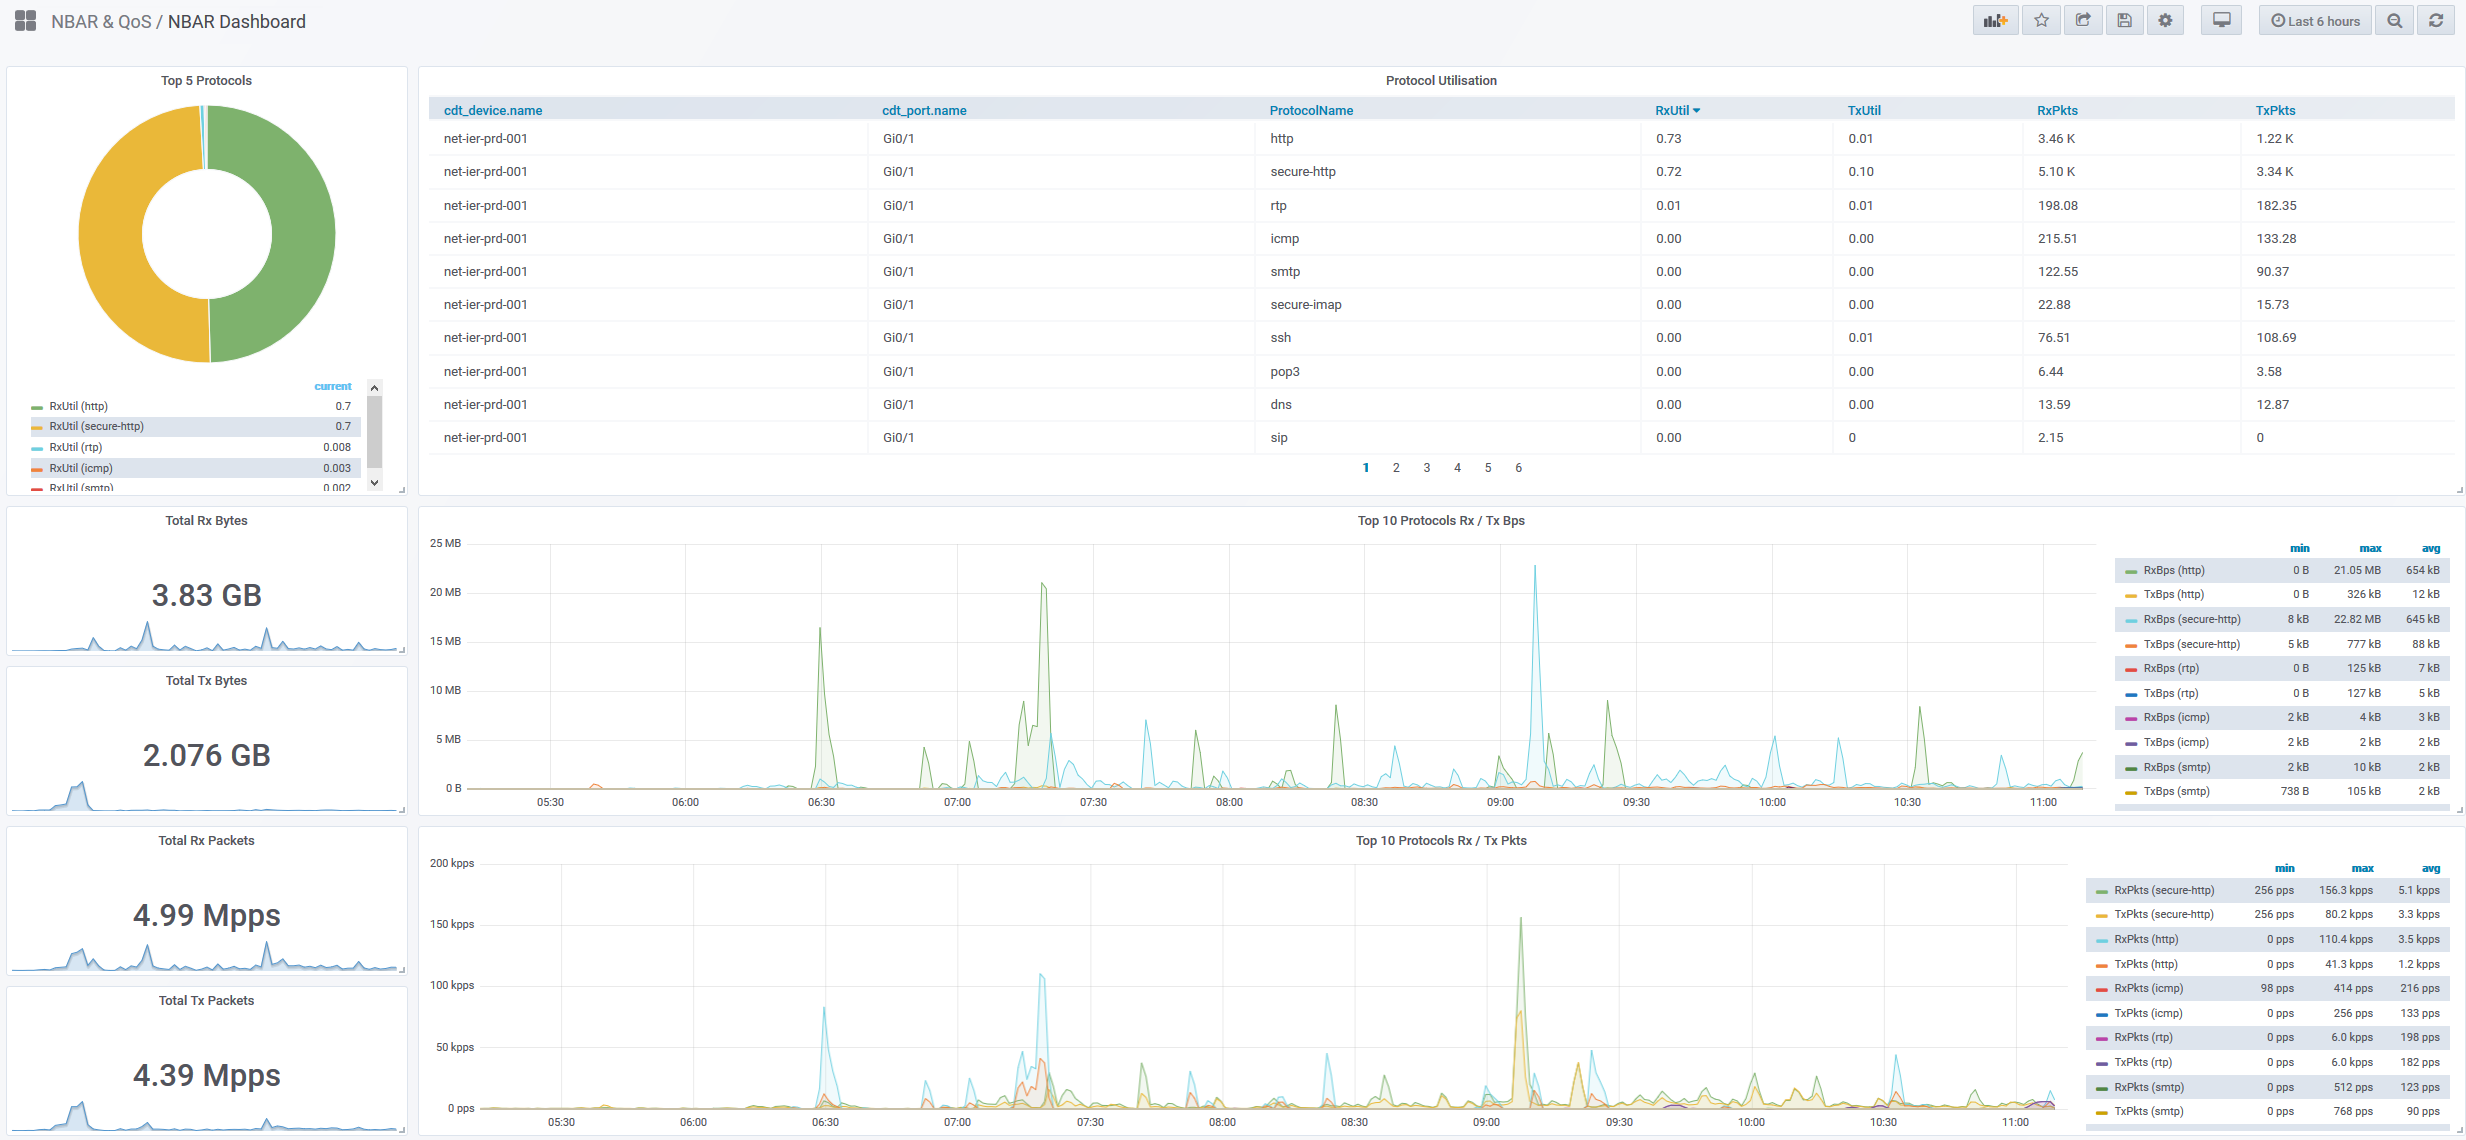
Cisco NBAR Report
The Cisco NBAR report presents your NBAR data. For each interface configured for NBAR monitoring, the report will return a list of all protocols found within the traffic passing through the interface, and for each detail:
- Inbound/outbound traffic rates
- Total Inbound/outbound traffic
- Average inbound/outbound utilization as a percentage of capacity
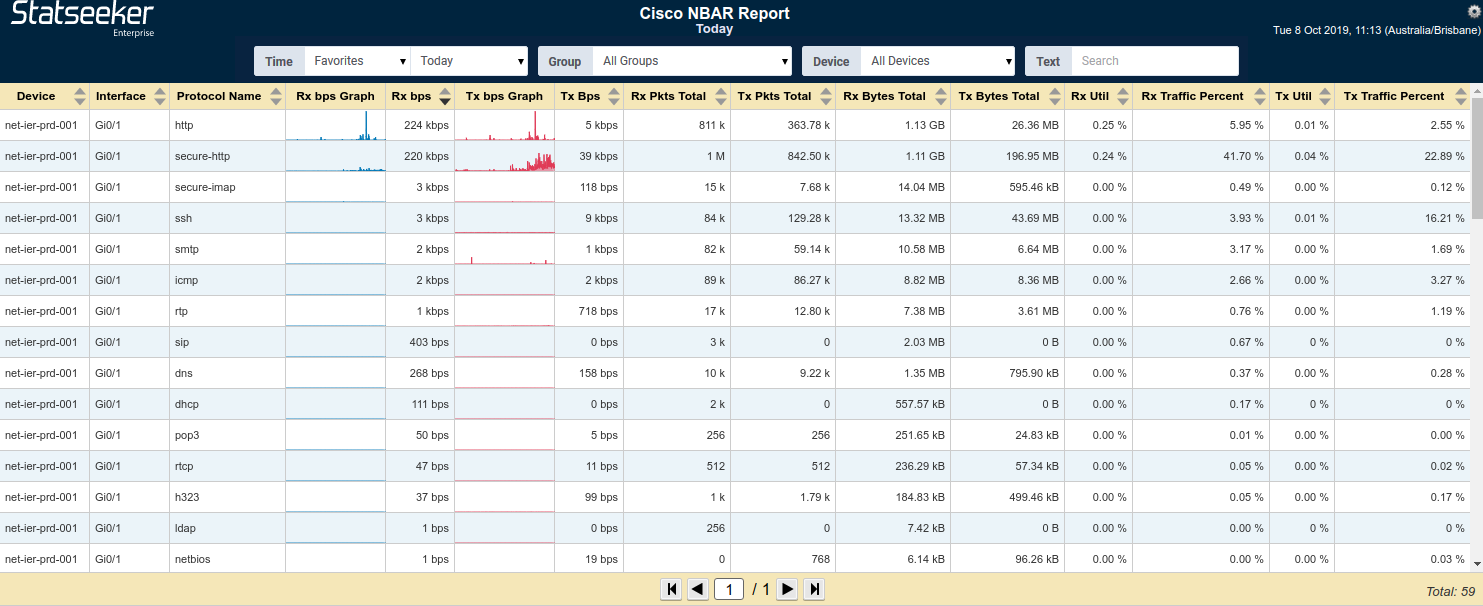
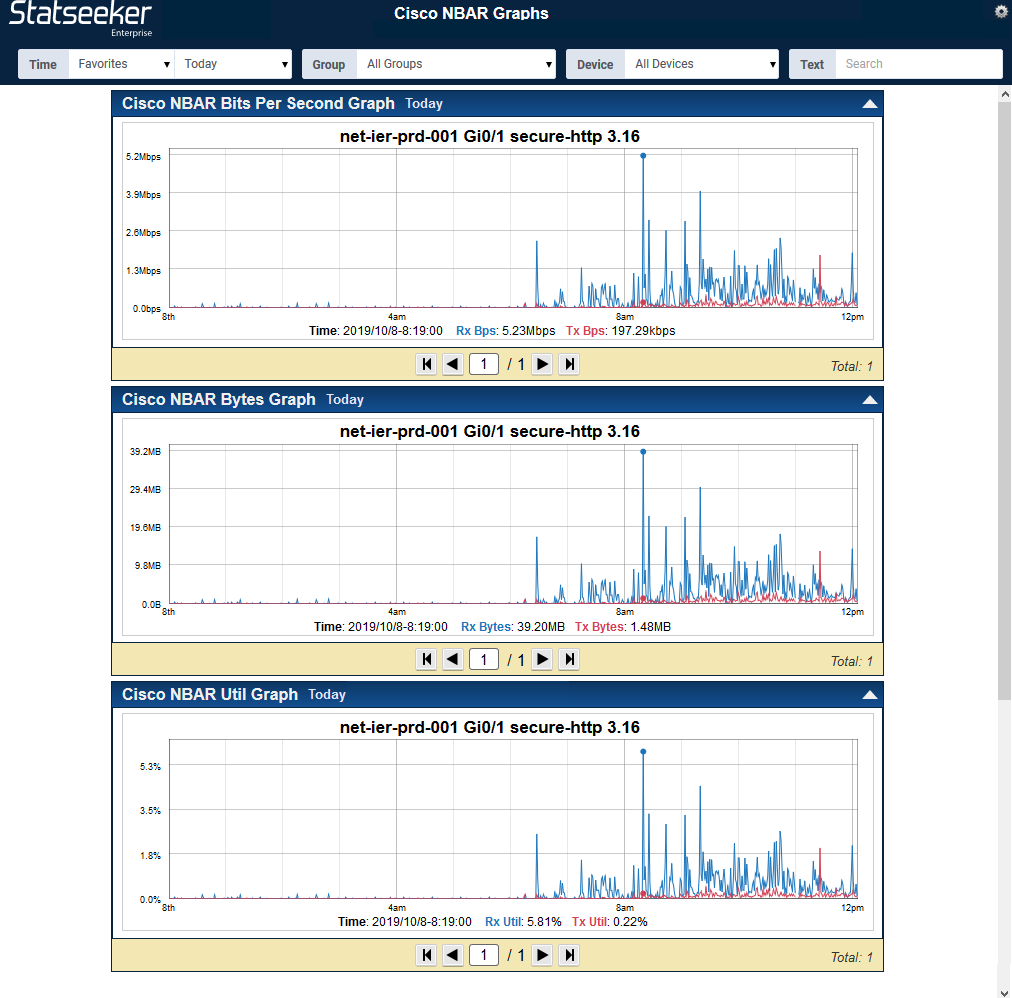
The report features drilldowns to the Device Viewer and Interface Statistics (Detailed) reports, the NBAR Graph report, featuring graphs breaking down utilization, data rate and total traffic, and individual graphs for each metric presented in the report.