Index
- Overview
- Interface Details Report – interface count and configuration details
- Asset Overview Dashboard – interface count and breakdowns
- Statseeker License Details – interface count
Overview
Prior to monitoring your network Statseeker must be made aware of the devices within the network via the Discovery process. Once a device has been discovered, Statseeker will monitor all interfaces on the device, data is collected and stored, and users are able to report, dashboard, and alert on that data. For more information on this process, see Statseeker Discovery.
A default Statseeker installation contains a few ways to view counts of, or details on, the interfaces that Statseeker is currently monitoring. In addition, custom reports, dashboards, and alerts can quickly and easily be configured to suit your requirements.
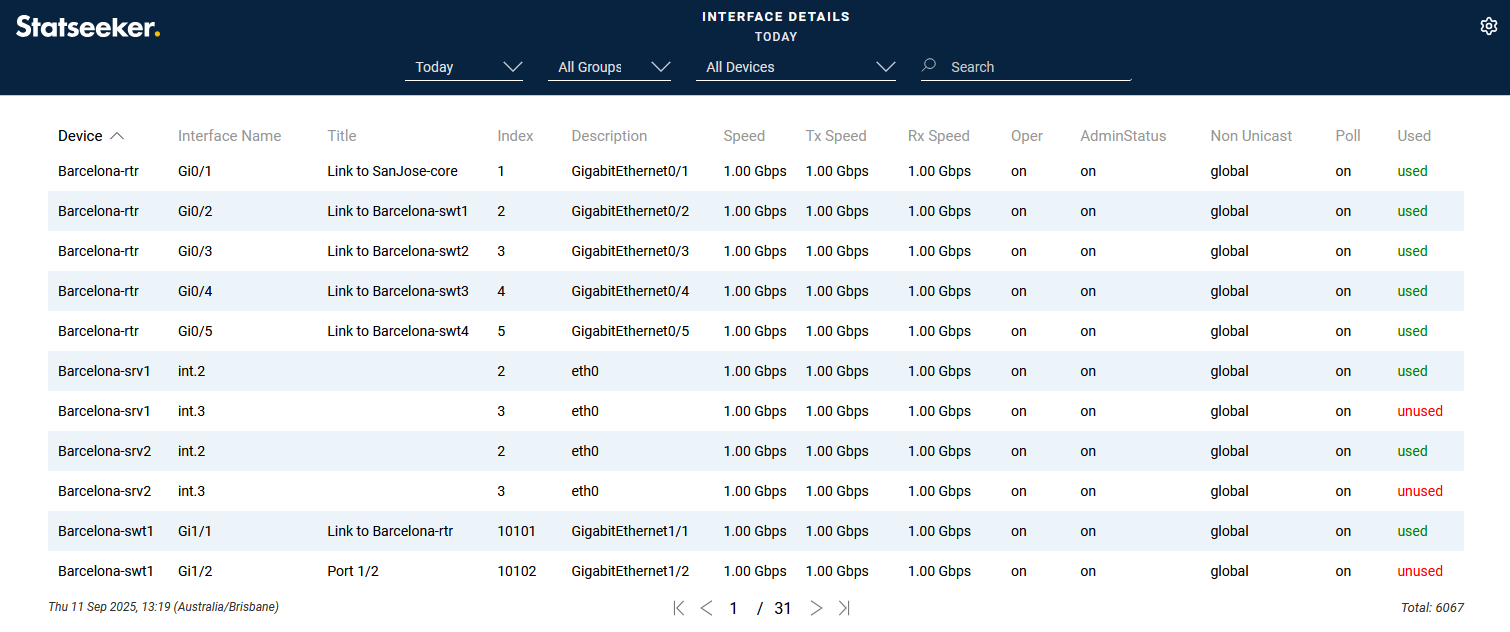
Interface Details Report – interface count and configuration details
The Interface Details report provides configuration details for all interfaces on selected devices, the data includes:
- Device name
- Interface name, title, index, and description
- Interface speed and configured in/out speeds
- Operational and Admin statuses, and poll state
- Whether the interface allows nonunicast traffic, and if traffic has been seen on the interface recently
The report offers a drilldown to the Device Viewer, filtered to the interface’s parent device. To return interface details:
- Specify the groups or devices that you want to see details for by selecting them in the Console (Ctrl+click for multiple selection, Shift+click for range selection)
- Set a General Filters > Top N (mid-right of the Console) value to suit the number of interfaces you wish to see
- From the report list select Interfaces > Details – you can type part of the report name in search field above the report list to filter the list
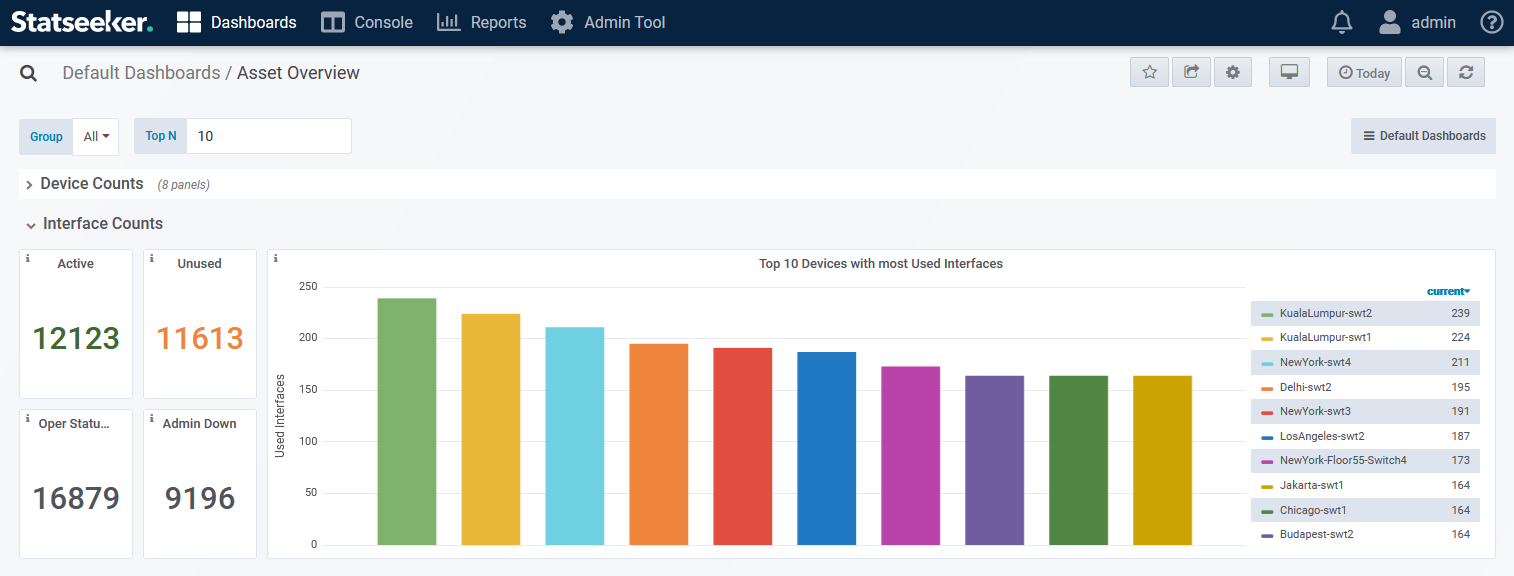
Asset Overview Dashboard – interface count and breakdowns
Every Statseeker installation includes a number of default dashboards, one of these, the Asset Overview, contains interface counts (active and unused), number of interfaces being polled for changes to ifOperStatus, and number configured as ifAdminState ‘down’.
To view the dashboard:
- Select Dashboards > Manage Dashboards in the main navigator
- Select Default Dashboards > Asset Overview
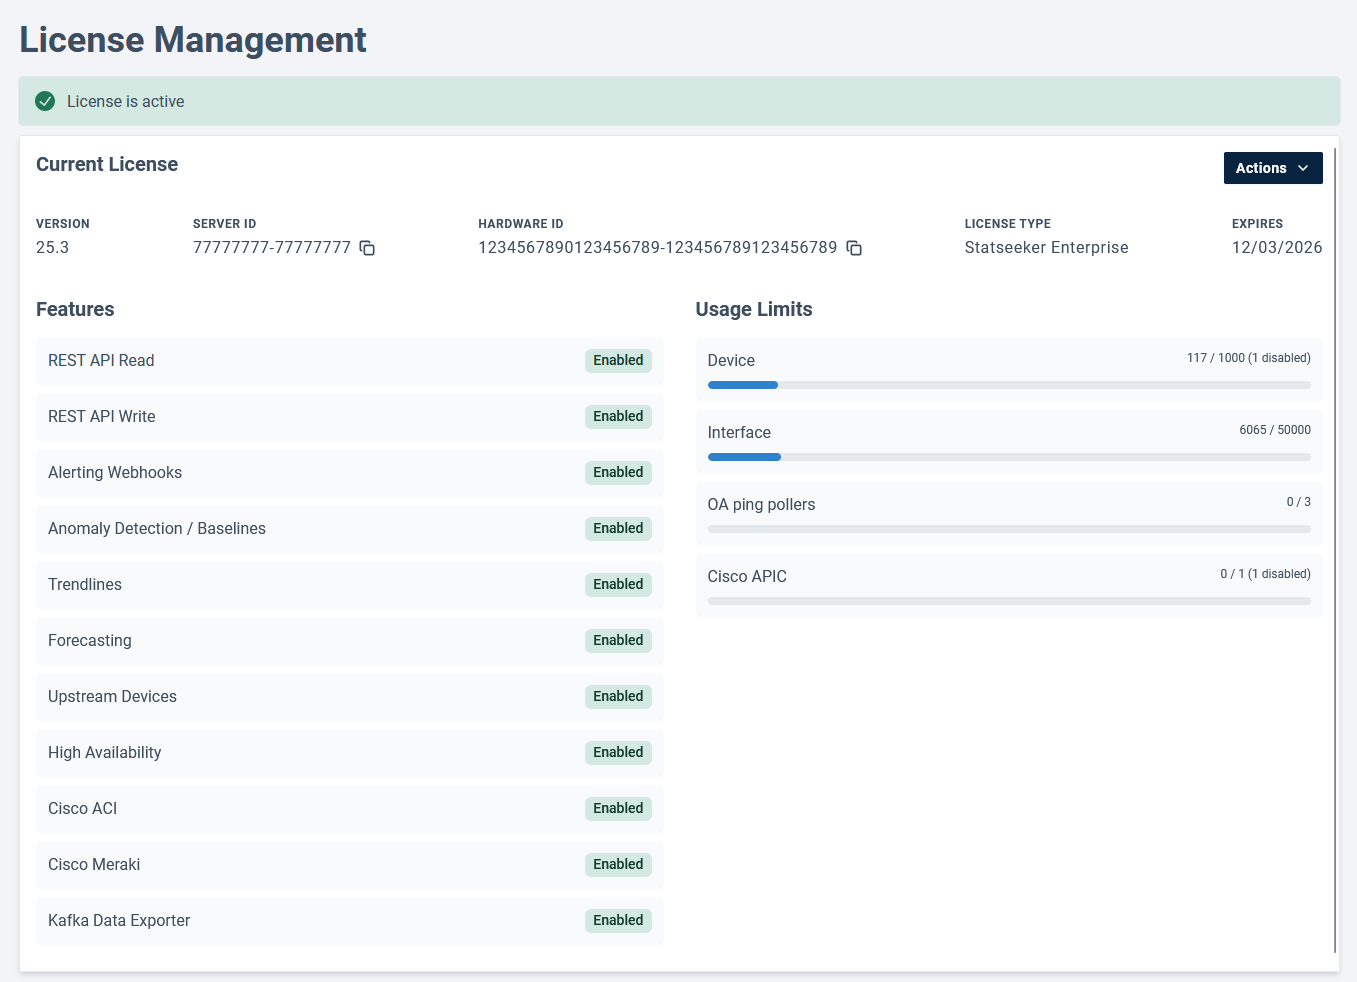
Statseeker License Details – interface count
Your Statseeker License record contains a count of interfaces that Statseeker is currently monitoring. This count is updated whenever Statseeker rebuilds its configuration information, a background process which is run as a component of many processes including device discovery, network rewalks, retiring, and deleting devices.
To view your current interface count:
- Select Administration > General > License Management
- Review the details in the Usage Limits section