Index
- Overview
- Licensing Requirements
- Observability Appliance Creation
- Observability Appliance Hardware Requirements
- Observability Appliance Deployment
- Editing Observability Appliance Configurations
- Observability Appliance Actions
- Disabling/Enabling and Deleting Observability Appliances
- Assigning Pollers
- Ping Data in Reports, Dashboards, Thresholds, and Alerts
- Maintenance Windows
- Ping Data
- LTM Configuration
Overview
Statseeker’s Observability Appliance is a platform that can be deployed anywhere in the network to enable remote polling from the deployed location. This might be to:
- Provide monitoring services to areas of the network that cannot be accessed by the Statseeker server
- Provide additional Ping monitoring services from various locations
- Forward NetFlow/sFlow data to the Statseeker server
- Forward summarized LAN traffic (port or VLAN mirroring) data to the Statseeker server
An Observability Appliance can be configured to run various monitoring services:
- Ping – perform ping-only discovery processes, collect ping data from discovered network devices, and forward this data to the Statseeker server
- Local Traffic Monitor (LTM) – forward flow and summarized LAN traffic data to the Statseeker server
Licensing Requirements
Every Statseeker server is deployed with a local Observability Appliance, which is used as the default poller for all devices discovered by the Statseeker server. Any number of additional Observability Appliances can be deployed within the network without exceeding any limits in the Statseeker license.
Licensing limits apply to:
- The number of polling services run on those additional Observability Appliances
- Polling services run on the local Observability Appliance do not contribute to licensing limits
- LTM services run on Observability Appliances do not contribute to licensing limits
- The number of ‘ping entities’
A ping entity is created for every device that each Observability Appliance (including the local Observability Appliance) ping-polls. If the Local Observability Appliance and two additional Observability Appliances are all ping-polling a single device, 3 ping entities will be created. The number of ping entities cannot be greater than the licensed Device Limit.
To view the current License (including entity counts and limits):
- Select Administration > General > License key
To modify the license or for assistance in managing licensing limits, contact Statseeker. Once your license has been updated by Statseeker Support/Sales, your Statseeker server needs to download a new license Key. To do this:
- Select Administration > General > License Key
- Click Edit (top-right)
- Click Download a new key
Once the key has been downloaded, a status screen is displayed detailing the changes in the License.
- Accept the terms of the license and click Save
Observability Appliance Creation
Observability Appliances can be created and managed from Administration:
- Select Administration > Observability Appliances > Observability Appliance Management
The page presents a list of existing Observability Appliances and options to create, edit, and delete Observability Appliances. The list can be filtered and searched, and details the Observability Appliance configuration, current status, uptime, and the services currently running on the Observability Appliance.
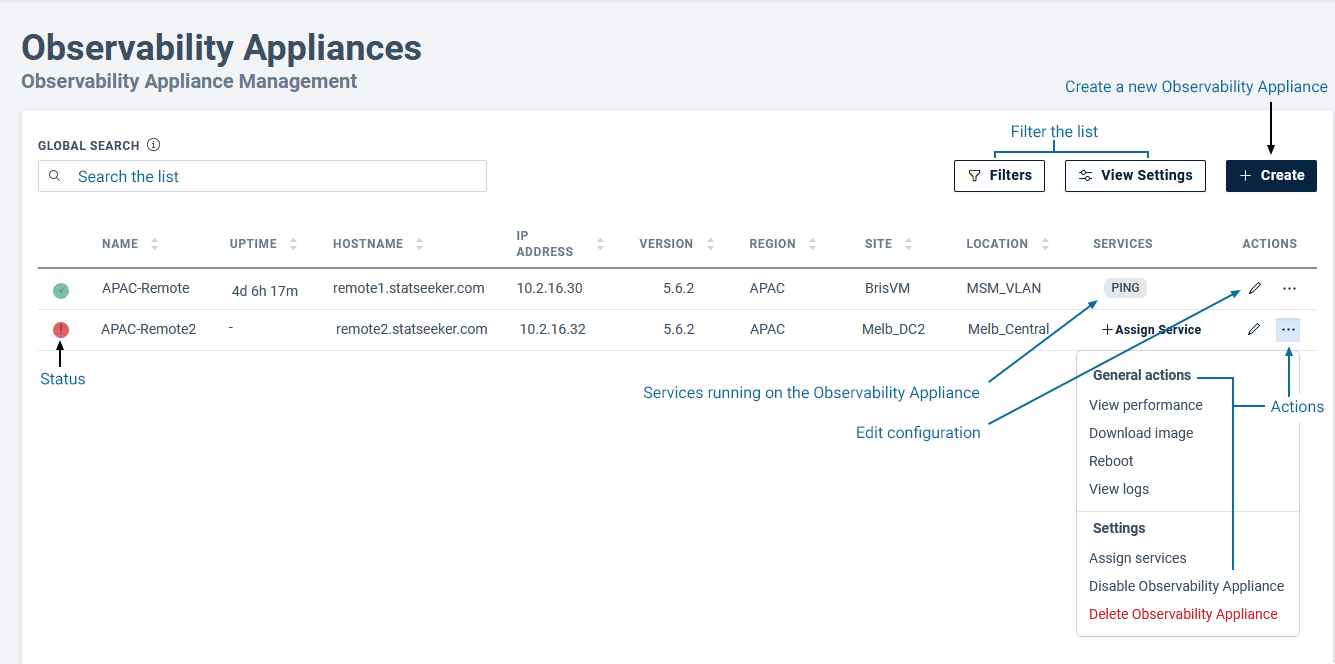
The process for creating an Observability Appliance can be summarized as:
- Configure the Observability Appliance
- Download the Observability Appliance image
- Deploy the Observability Appliance
To create an Observability Appliance:
- Select Administration > Observability Appliances > Observability Appliance Management
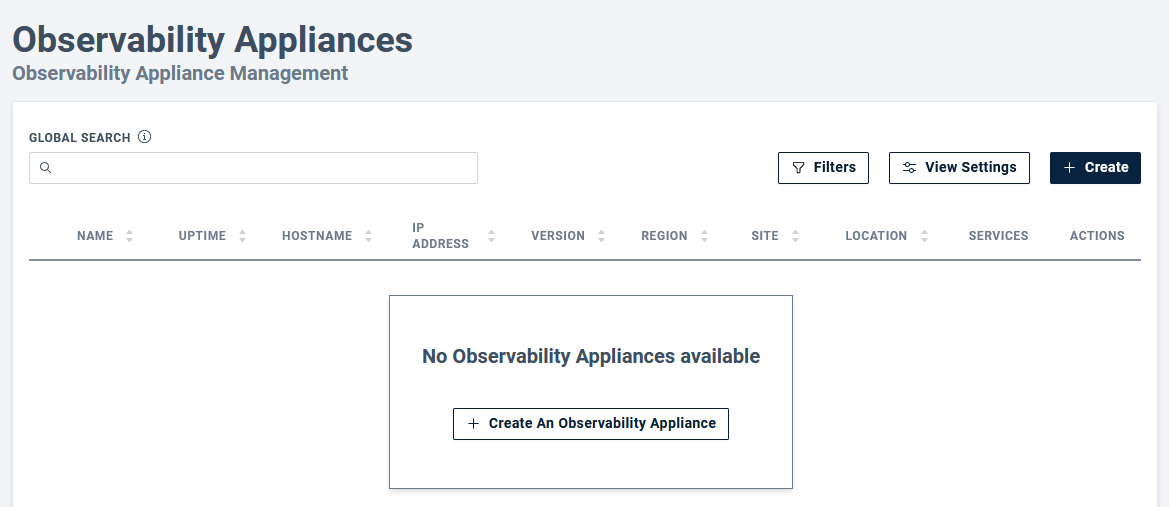
- Click Create an Observability Appliance
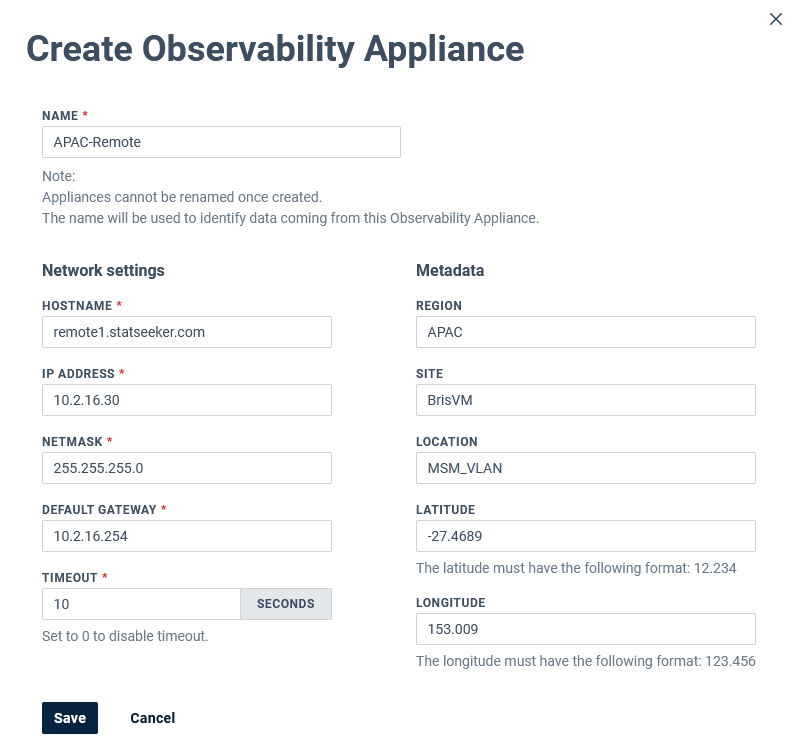
- Configure the Observability Appliance, specifying the network settings required for deployment within your network, and click Save
- Name – (required) label for the Observability Appliance (valid characters: 0-9; a\A-z\Z; _; –)
- IP Address – (required) IP address for the Observability Appliance
- Netmask – (required) netmask for the Observability Appliance
- Default Gateway – (required) gateway for the segment of the network that will house the Observability Appliance
- Timeout – (required) the number of seconds to allow for a transmission to the Statseeker server to complete
- Region – metadata label
- Site – metadata label
- Location – metadata label
- Latitude\Longitude – metadata, can be used (when supplied with longitude) for presenting Observability Appliance data in Worldmap dashboard panels
- From the actions menu, select Download to save the Observability Appliance configuration to the local machine
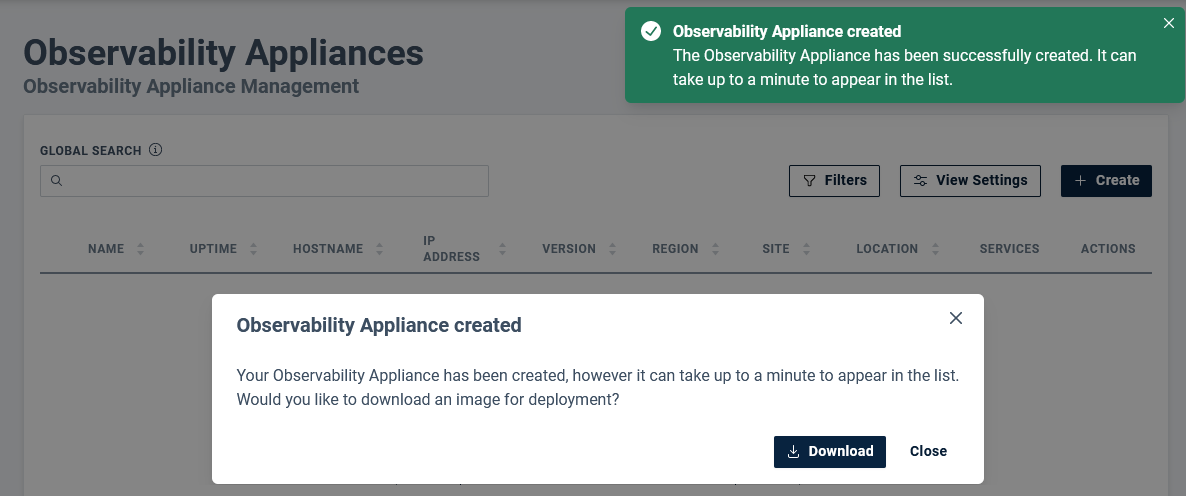
- Select the image format required for deployment within your environment
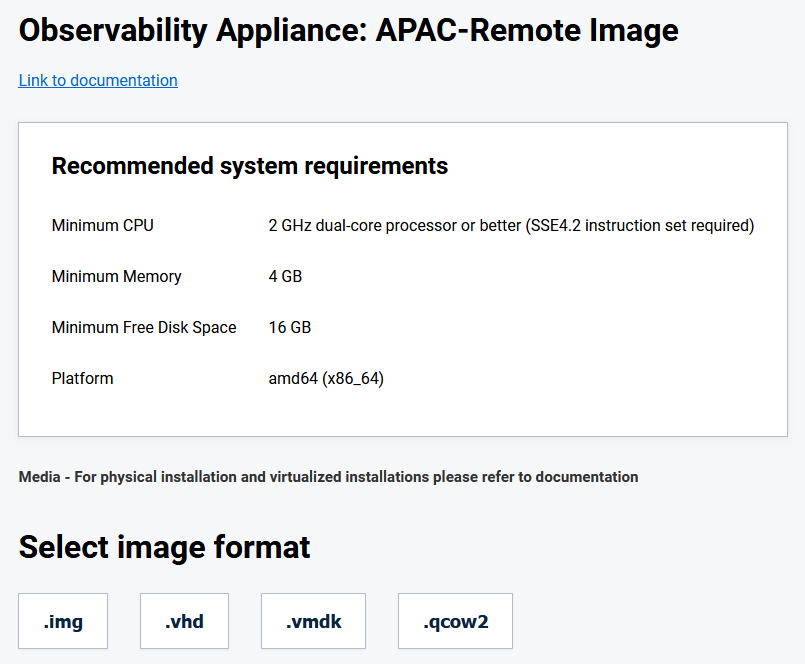
The image will be prepared, compressed, and a download link is presented.
- Do not update or delete the Observability Appliance configuration while the image is being created – wait until the image creation process completes, then make the required changes and download the updated image
- The download file will be archived for transport (*.gz file) and will need to be unpacked prior to use
- Provision a host and deploy the Observability Appliance, see:
Observability Appliance Hardware Requirements
- CPU: 2 GHz dual-core processor or better (SSE4.2 instruction set required)
- RAM: 4G
- Disk: 16G
- Platform: amd64 (x86_64)
- Boot: EFI\UEFI
Deploying the Observability Appliance as a Virtual Machine (ESXi)
Observability Appliances can be deployed as virtual devices anywhere on the network. The process for the virtual deployment can be summarized as:
- Create the Observability Appliance image on the Statseeker server and download as a VMDK
- Build the VM utilizing the VMDK
- Launch the VM
Create the Observability Appliance Image
Follow the steps outlined in Observability Appliance Creation, selecting VMDK as the output file format, and download the image. The download is archived for transport (*.gz file) and will need to be unpacked prior to use.
- Use an archiving tool to unpack the downloaded *.gz file, exposing the compressed *.vmdk file
Create the VM
- Upload the VMDK to a vSphere datastore
- Create the VM according to the requirements specified above (these requirements are also detailed when selecting the image format to build) – when prompted, specify the OS as Other > FreeBSD 12 or later (64-bit) (alternatively use Other > Other (64-bit))
Note: as of Statseeker v5.6.2, Observability Appliances require the Boot type to be set to EFI. For ESXi deployments, when specifying the hardware:
- Select the VM Options tab
- Set Boot Options > Firmware = EFI
- Locate the VMDK, select Move to, and move the image to the folder housing the VM – this Move to action will expand the VMDK to the full 16G drive image for use by your Observability Appliance
- Right-click the VM and select Edit Settings
- Remove the current hard disk
Note: The VM folder will contain two disks:
- The disk created with the VM – this will have the same name as the VM – remove this disk
- The uploaded VMDK – this will have the name you specified when creating the image – select this disk in the next step
- Select Add New Device > Existing Hard Disk and select the uploaded Observability Appliance VMDK
- Click OK to save the changes
The Observability Appliance supports up to 8 additional interfaces which can be used to receive NetFlow/sFlow and summarized LAN traffic (port or VLAN mirroring) data from elements of the network. Each data source requires its own dedicated interface on the Observability Appliance, but there is no limit to the number of Observability Appliances which can be deployed to the network.
- Optionally add additional Network Adaptors as needed
- Save the VM configuration
- Launch the VM
Deploying the Observability Appliance as a Virtual Machine (Hyper-V)
Observability Appliances can be deployed as virtual devices anywhere on the network. The process for the virtual deployment can be summarized as:
- Create the Observability Appliance image on the Statseeker server
- Build the VM utilizing the VHD
- Launch the VM and configure interfaces for the network
Create the Observability Appliance Image
Follow the steps outlined in Observability Appliance Creation, selecting VHD as the output file format, and download the image. The image is archived for transport (*.gz file) and will need to be unpacked prior to use.
- Use an archiving tool to unpack the downloaded *.gz file, exposing the compressed *.vhd file
Create the VM
Edit the VHD:
- Select Server
- Select Actions > Edit Disk
- Locate and select the Observability Appliance VHD
- Select Expand > 16GB
- Click Finish
Create the VM:
- Select Server
- Select Actions > New > Virtual Machine
- Name the VM and specify a Location as needed
- Choose Generation 1
- Set Startup Memory = 4096 MB and deselect Dynamic Memory
- Configure Networking options to suit requirements
Note: the Observability Appliance supports up to 8 additional interfaces that can be used to receive NetFlow/sFlow and summarized LAN traffic (port or VLAN mirroring) data from elements of the network. Each data source requires its own dedicated interface on the Observability Appliance, but there is no limit to the number of Observability Appliances that can be deployed to the network. The description field can be used to differentiate these additional interfaces.
When assigning the virtual hard disk:
- Select Use an existing virtual hard disk
- Select the edited/expanded Observability Appliance VHD
- Finish the VM configuration
Deploying the Observability Appliance on a Physical Host
Observability Appliances can be deployed on physical devices anywhere on your network. The process for physical deployment can be summarized as:
- Create the Observability Appliance image on the Statseeker server
- Convert the Observability Appliance image to a bootable USB
- Connect and boot from the USB
Create the Observability Appliance Image
Follow the steps outlined in Observability Appliance Creation and download the image. The image is archived for transport (*.gz file) and will need to be unpacked prior to use.
- Use an archiving tool to unpack the downloaded *.gz file, exposing the compressed *.img file
Create a Bootable USB from the IMG
You will need to employ a 3rd-party tool to expand the *.img and create a bootable USB.
Select a tool suitable for your environment, then:
- Unpack the archive
- Expand/inflate the compressed IMG to 16GB
- Use the extracted and expanded IMG to create a bootable USB
- Deploy and boot from the USB
Editing Observability Appliance Configurations
The Observability Appliance configuration can be updated from the Observability Appliance Management screen:
- Select Administration > Observability Appliances > Observability Appliance Management and click the Edit button (
 ) of the target Observability Appliance
 - Update the Observability Appliance configuration details as needed and click Save
- The name and metadata items are only on the Statseeker side, but the network settings need to match those on the Observability Appliance for communication to occur. Changes made in Statseeker are not pushed to a deployed Observability Appliance. When making changes to Observability Appliance network settings (other than IP) on the Statseeker side, either update the Observability Appliance host to match the configuration in Statseeker (contact Customer Support for assistance) or download the updated configuration and redeploy the Observability Appliance.
Updating Observability Appliance Network Settings
Updating the network settings of a deployed Observability Appliance requires that the Observability Appliance be redeployed using an updated disk image. This requirement does not apply to the content of the Metadata fields, just the fields under Network Settings – hostname, IP address, netmask, default gateway, and timeout.
If you need to alter the network settings:
- Edit the configuration and save the changes
You will be prompted to download the updated configuration image.
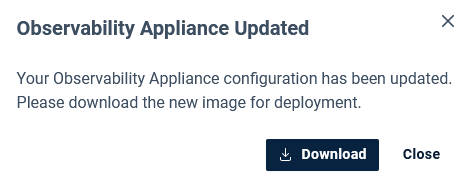
- Download the updated configuration when prompted
- Redeploy the Observability Appliance
This will not result in any loss of historical data. All ping entities associated with the previous deployment are automatically associated with the new Observability Appliance.
Observability Appliance Actions
The Observability Appliance actions menu offers a range of options for managing Observability Appliance deployments:
- View performance – open the Statseeker Server dashboard, filtered to the selected Observability Appliance
- Download image – download the Observability Appliance configuration for deployment within the network
- Reboot – remotely reboot the Observability Appliance
- View Logs – display server logs for the selected Observability Appliance
- Remote Ping Discovery – (requires the Ping service running on the Observability Appliance) perform a ‘discovery via ranges’ from the Observability Appliance, see Ping – Discovery for the output from this action
- Remote Ping – Manage Devices – (requires the Ping service running on the Observability Appliance) assign ping pollers to known devices
- Assign Services – remotely enable/disable polling and LTM services, the Observability Appliance must be ‘up’ (active and reachable)
- Disable appliance – disable polling from the Observability Appliance, data forwarding from the Observability Appliance to the Statseeker server, and maintains existing data history
- Delete appliance – remove the Observability Appliance configuration and all historical data collected from the Observability Appliance
Assigning Services
The Assign Services action allows users to specify which services to run on the Observability Appliance:
- Ping – collect ping data from specified network devices and forward this data to the Statseeker server
- Local Traffic Monitor (LTM) – forward flow and summarized LAN traffic data to the Statseeker server
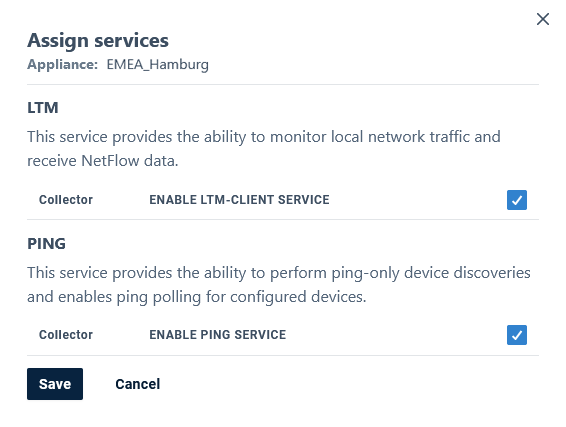
Ping – once the ping service is running on the Observability Appliance, the Observability Appliance can be directed to run a ping-only discovery (see Ping Discovery to create new ping entities for ping data collection. The Observability Appliance will ping-poll all ping entities assigned to the Observability Appliance every 15 seconds, collecting a range of Ping Data, which is then available for use in Statseeker reports and dashboards, as well as threshold and alert configurations.
LTM – once the LTM service is running on an Observability Appliance, other elements of your network can be configured to forward data to the LTM for processing and transport to Statseeker, see LTM Configuration for details.
Remote Ping Discovery
The Ping Discovery action is available on all Observability Appliances running the ping service. This action allows users to initiate a ping-only discovery by specifying a set of IP discovery ranges.
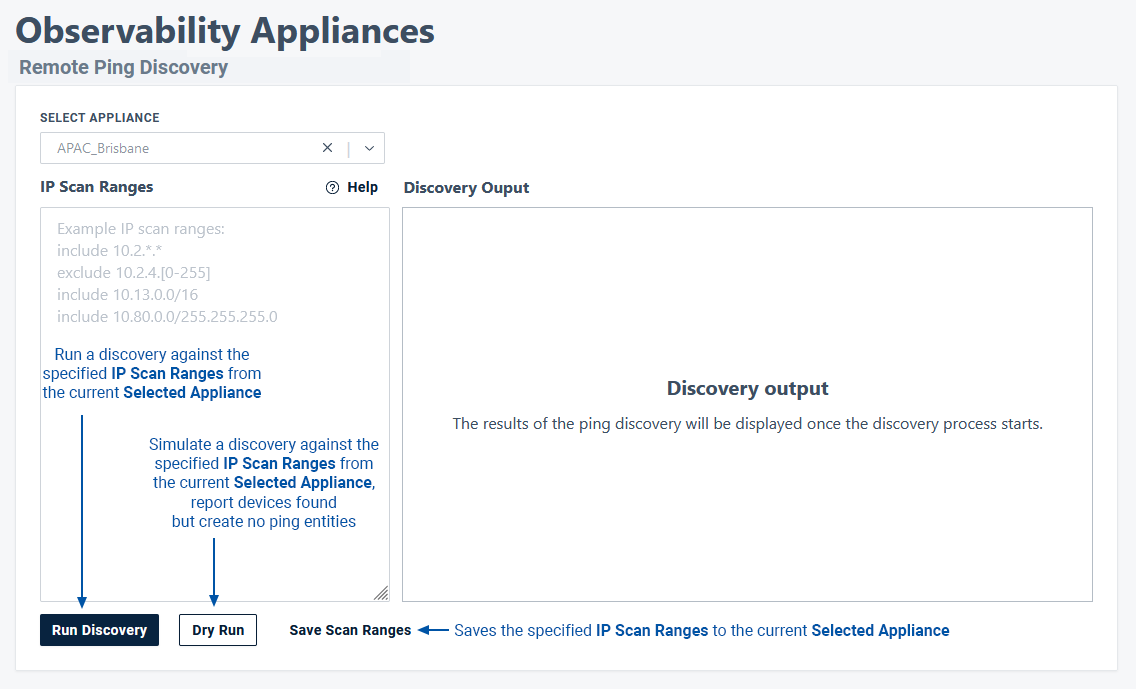
- Select Appliance – select an Observability Appliance from the list
- IP Scan Ranges – specify include/exclude rules of IPv4 addresses to target the discovery process
- Discovery Output – output log of the discovery process being run
- Run Discovery – run a discovery against the specified IP Scan Ranges from the current Selected Appliance
- Dry Run – Simulate a discovery against the specified IP Scan Ranges from the current Selected Appliance, report devices found, but create no ping entities
- Save Scan Ranges – save the specified IP Scan Ranges to the current Selected Appliance
Discovery Outcomes
If a new device is discovered (no known device at that IP):
- A new ping-only device is created within Statseeker
- The device IP is assigned as the device name (this can be updated from the General > Device Details report in the Console)
- A new ping entity, linked to the device record, is created within Statseeker
- The Observability Appliance is set as the default poller for that ping entity
If a known device is discovered (device at that IP already exists within Statseeker):
- A new ping entity, linked to the device record, is created within Statseeker
- The default poller is unchanged
- Are added to Statseeker as ping-only devices and will not be SNMP polled by the Statseeker server. SNMP polling can be enabled on an individual device basis from the Device Details report, and as a bulk action via Auto-Grouping (see Use Auto-Grouping to Apply Bulk Configuration Changes) or the API.
- Do not have a hostname set, and will not adhere to the specified device naming convention
Disabling/Enabling and Deleting Observability Appliances
The far-left column in Observability Appliance Management displays the current status of the Observability Appliance:
 – up, Observability Appliance is active and communicating with Statseeker
 – down, Observability Appliance is not responding to the Statseeker server, its operational status is unknown
 – disabled, Observability Appliance is communicating with Statseeker, but is not actively polling or forwarding data
Observability Appliances can be configured to poll each other. If an Observability Appliance is presented as ‘down’ in Statseeker but the ping entity (associated with that Observability Appliance) resulting from the Observability Appliance being polled by another Observability Appliance indicates that the device is ‘up’, then we know the issue is with the communication path between the Observability Appliance and Statseeker server, and not with the operation of the Observability Appliance.
A device’s default poller is not updated as a result of the poller being disabled\deleted. Default dashboards and reports use data from the default poller; for this reason consider updating the default poller when disabling\deleting Observability Appliances. To update the default poller, see Ping – Assign Pollers.
Disable/Enable an Observability Appliance
The Disabling\Enabling command is sent from the Statseeker server to the Observability Appliance and requires that the Observability Appliance be either “up” or “disabled”. This action will fail if the target Observability Appliance is currently ‘down’. Disabling an Observability Appliance:
- Instructs the Observability Appliance to cease any polling or data forwarding processes
- Retains the Observability Appliance configuration
- Retains all ping entities associated with the Observability Appliance
- Does not update a device’s default poller
To disable an Observability Appliance:
- Select Administration > Observability Appliances > Observability Appliance Management
- Open the actions menu (
 )
)
- Select Settings > Disable\Enable appliance and confirm the action if prompted
Delete an Observability Appliance
Deleting an Observability Appliance:
- Deletes the Observability Appliance configuration
- Deletes all ping entities associated with that Observability Appliance
- Does not update a device’s default poller
To delete an Observability Appliance:
- Select Administration > Observability Appliances > Observability Appliance Management
- Open the actions menu (
 )
)
- Select Settings > Delete appliance and confirm the action
A dialog will be displayed detailing the impact of the action, the number of devices with the Observability Appliance as their default poller, and providing the option to assign a new default poller to those devices.
- Confirm the actions to delete the Observability Appliance
Assigning Pollers
Every Statseeker server is deployed with a local Observability Appliance that is used as the default poller for all devices discovered by the Statseeker server. Any number of additional Observability Appliances can be deployed within the network to act as additional ping pollers. For an Observability Appliance to poll a device, it needs to run its own discovery process, see Ping – Discover for details on this process and the process output.
While any number of pollers can be providing data for a single device, default dashboards and reports use data from the default poller – any Observability Appliance (including the local Observability Appliance) can be assigned as the default poller. The default poller can be reassigned, and additional pollers can be assigned\removed at any time. Once a poller has been assigned to a device, it may take a few minutes for data to be made available as Statseeker needs to create/update configuration data for the relationship between Observability Appliances and the polled devices.
Assign Pollers and the Default Poller
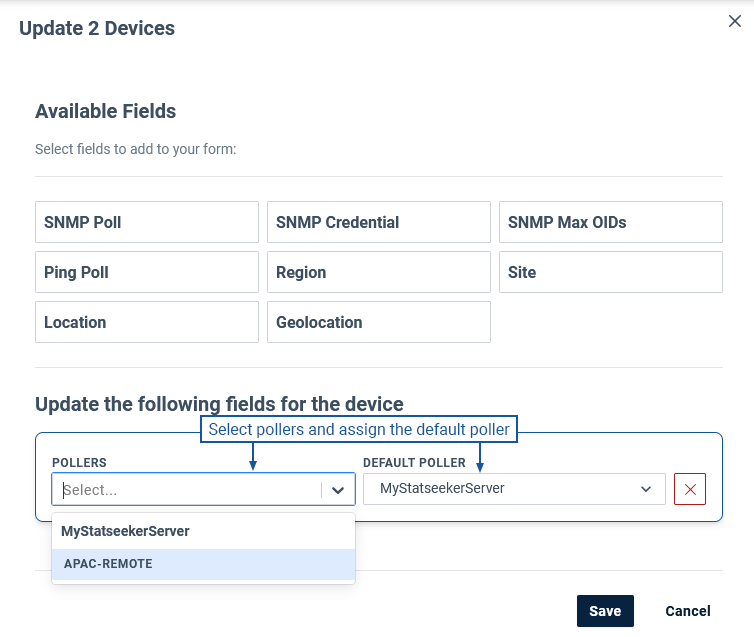
To assign\remove pollers:
- Select Administration > Observability Appliances > Observability Appliances
- Use checkboxes to select the devices that will have their pollers updated
- Select Actions > Remote Ping- Manage devices
- Search and filter the device list as needed
- Use the checkboxes to select one or more devices and select Actions > Edit
- Select Assigned Pollers from the fields list
- Update the pollers as required and click Save
Ping Data in Reports, Dashboards, Thresholds, and Alerts
A device’s ping data is available when querying either the Device or Ping data objects (API endpoints: cdt_device; cdt_ping).
- The Device object will reference data from the default poller, but data returned from the Ping object can be filtered to a specific ping entity – data from any poller monitoring a device
- Grouping (typically used to focus the output of reports and dashboards, and target thresholds and alerts) can be utilized by creating groups populated with specific ping entities
When filtering data to specific ping entities, the identifier is a combination of the names of the target device and the poller – [device name] [poller name]. With a device Brisbane-rtr being polled by two pollers APAC_Brisbane and APAC_DC1, the ping entities would be presented in report and threshold entity filters, and in grouping ping object lists as:
- Brisbane-rtr APAC_Brisbane
- Brisbane-rtr APAC_DC1
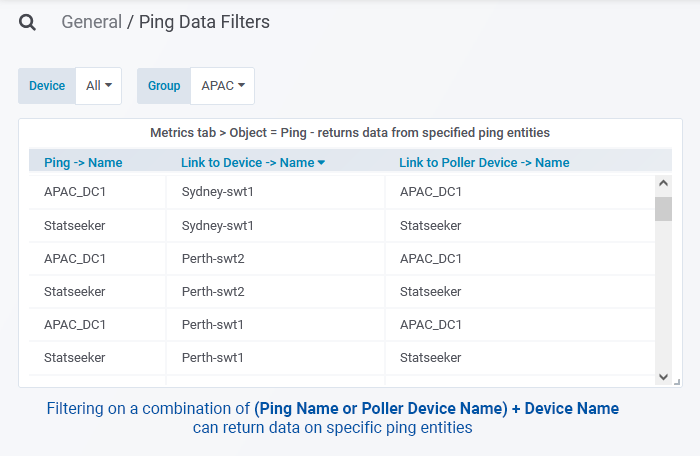
When configuring dashboard panels to data from specific entities, multiple filters are required to target specific ping entities:
- A filter against either Ping > Name or Poller Device > Name, these return the same value
- A filter against Device > Name
Reporting Ping Data
All Statseeker default reports (those under the Ping heading in the Console report list) present ping data from the device’s assigned default poller. The Ping – Availability report presents a row for each polled device from the default poller, and an additional row for each other Observability Appliance polling that device.
When creating custom reports containing ping data:
- Report Data Type = Device – returns data from the default poller only
- Report Data Type = Ping – returns data from selected ping entities, can be used to return data from any/all poller/s
Groups can be populated with ping entities, allowing the group to be used as a filter in report configuration. In addition, when Report Data Type = Ping, both Attribute and Ping filters can be employed to restrict data to specific ping entities.
Presenting Ping Data in Dashboards
All Statseeker default dashboards present ping data from the device’s assigned default poller. When creating custom dashboard content, the panel’s data source is defined in the query specified in the Metrics tab.
- Object = Device – returns data from the default poller only
- Object = Ping – returns data from selected ping entities, can be used to return data from any/all poller/s
Groups can be populated with ping entities, allowing the group to be used as a filter in panel configuration. In addition, when Object Data Type = Ping, filters can be applied to combinations of Ping, Device, and Poller entities to restrict data to specific ping entities, see Filtering Ping Data for details.
Thresholding and Alerting on Ping Data
Threshold Configuration
- Attribute = Device – thresholds against data from the default poller only
- Attribute = Ping – thresholds against data from selected ping entities, can be used to return data from any/all poller/s
Groups can be populated with ping entities, allowing the group to be used as a filter in threshold configuration. In addition, the Entity Filters section offers the option to specify which ping entities are subject to the threshold.
Alert Configuration
When configuring alerts on ping events:
- Entity Filter = Device – alerts are triggered by events from all pollers polling that device, if multiple Observability Appliances are monitoring the device, then the alert may be triggered multiple times
- Entity Filter = Group – alerts are triggered by events from entities in the selected groups
Groups can be populated with ping entities (rather than devices), allowing the group to be used as a filter in alert configuration to restrict alerts to events from specific ping entities/pollers. Remember, a ping entity is created for each instance of a device being monitored by an Observability Appliance. By grouping specific ping entities, alerts can be restricted to the loss of connectivity between a device and a specific Observability Appliance, rather than a device and any Observability Appliance monitoring that device.
Use Bundling to avoid multiple alerts for a single device – if there are multiple Observability Appliances ping polling a single device, and that device becomes unreachable, then a ‘device down’ event will be generated for each instance of an Observability Appliance being unable to communicate with the device. This can potentially trigger a device down alert multiple times. Alert ‘bundling’ is a configuration option which may be useful in this instance, see Alert Bundling for details.
Filter or Bundle poller_down alerts
When an Observability Appliance goes down, a State = poller_down event is created for every device polled by the Observability Appliance. This can result in the generation of a lot of alerts. To mitigate this, when configuring poller_down alerts:
- Apply a device filter specifying the Observability Appliance, or a group filter specifying a group containing only Observability Appliance devices
- Alternatively, where notification of which devices are affected by the down Observability Appliance is required, apply Alert Bundling to restrict the alert to a single email/output
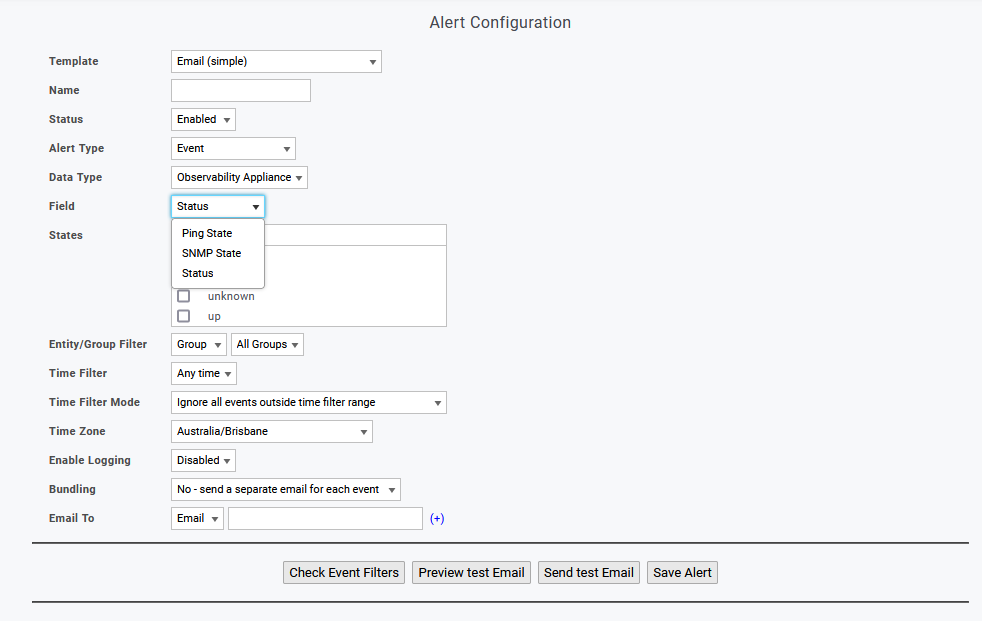
Observability Appliance State Alerting
There are 3 Observability Appliance state fields that can be used in alerting:
- Ping State – the ping state of the Observability Appliance, as monitored from the Statseeker server and any additional Observability Appliances assigned to monitor the device
- SNMP State – the SNMP state of the Observability Appliance, as monitored from the Statseeker server
- Status – the operational status of the Observability Appliance
Maintenance Windows
An offline device does not produce any ping data. To prevent empty rows/records in reports for devices being intentionally taken offline, you can simply disable ping polling for that device.
For a given ping entity to present timeseries data in reports and dashboard panels, it requires that both:
- The ping entity has poll = on
- The parent device has ping_poll = on
This means that disabling ping polling on a parent device (ping_poll = off) will prevent ping data from all associated ping entities being presented in reports, without needing to adjust the configuration the ping entity itself.
To disable/enable ping polling, see Manage Devices.
Ping Data
Network devices can be monitored by any number of Observability Appliance ping pollers, providing the ability to monitor reachability of critical infrastructure from multiple locations throughout the network. Every device has an assigned ‘default poller’ which is referenced by Statseeker dashboards and reports, but custom reports and dashboard panels can be configured to present ping data from any Observability Appliance monitoring the device.
Observability Appliances ping their target entities 4 times/minute, every minute. The data presented in the table below is available for each ping entity. In the event that the Observability Appliance is operating but unable to communicate with the Statseeker server, polled data remains in a queue on the Observability Appliance until communications are reestablished. The Observability Appliance’s data queue can hold around 200 000 records (20mins of data when polling 10 000 devices). When this limit is reached, newly acquired data is discarded and is not recoverable.
Ping Data
| Field Title | Description |
| Duplicate Pings | The number of duplicate ping packets Timeseries Data: Stats, Formats & Options |
| Ping Jitter | The ping jitter Timeseries Data: Stats, Formats & Options |
| Ping Lost | The number of lost ping packets Timeseries Data: Stats, Formats & Options |
| Ping Lost Percent | The percentage of lost ping packets Timeseries Data: Stats, Formats & Options |
| Outage Time | The duration in seconds before device is declared down |
| Ping Received | The number of received ping packets Timeseries Data: Stats, Formats & Options |
| Average Ping RTT | The Average ping RTT to the Device Timeseries Data: Stats, Formats & Options |
| Maximum Ping RTT | The maximum ping RTT to the Device Timeseries Data: Stats, Formats & Options |
| Minimum Ping RTT | The minimum ping RTT to the Device Timeseries Data: Stats, Formats & Options |
| Ping Sent | The number of sent ping packets Timeseries Data: Stats, Formats & Options |
| Ping State | The current ping state of the device from the default poller, one of:
Can be combined with an event format for event-based analytics, see Event Formats |
LTM Configuration
The Observability Appliance supports up to 8 interfaces, which can be used to receive NetFlow/sFlow and summarized LAN traffic (port or VLAN mirroring) data from elements of the network.
Netflow/sFlow
To collect NetFlow/sFlow data:
- Each device sending NetFlow/sFlow data to the Observability Appliance should be configured to forward the flow data to a unique port on the first interface of the Observability Appliance. This interface should be connected to a non-mirrored switch port.
On the Statseeker server:
- Select Administration > Traffic Analyzer > Flows
- Select an Observability Appliance from the dropdown
- Specify a unique Port on the Statseeker server – this port will receive all content from the specified Observability Appliance
- Set a label and click Save
For more details around configuring an Observability Appliance’s connection to Statseeker for NetFlow/sFlow, see Netflow Configuration.
For details on reporting on NetFlow/sFlow data, see Traffic Analyzer.
Summarized LAN Traffic Data
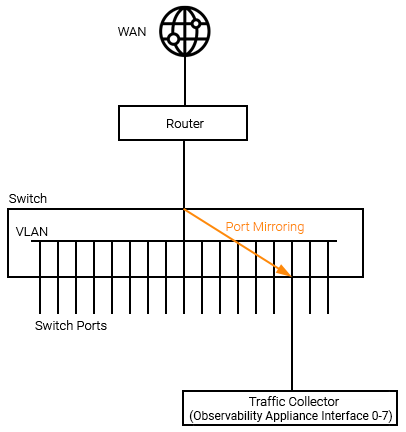
When traditional flow data is not available, Statseeker Observability Appliances can be configured to receive mirrored port or VLAN traffic and output summarized traffic data, forwarding this data to the Statseeker server. LAN traffic collectors should be configured as follows:
Port Mirroring
VLAN Mirroring
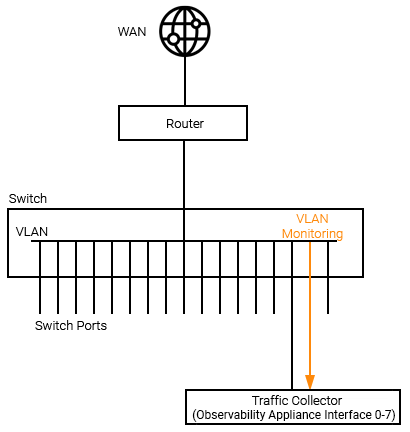
No additional configuration on the Statseeker side is required for LAN traffic collection. For details on reporting on NetFlow/sFlow data, see Traffic Analyzer.

