Legacy Documentation for Statseeker version 5.5.3
Index
- Overview
- What Devices are in my Group?
- What Interfaces are in my Group?
- What Other Entities are in my Group?
Overview
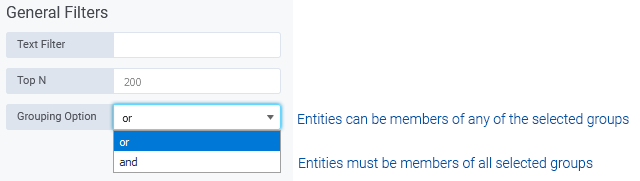
Grouping is a fundamental feature in the Statseeker product, it is a core mechanic utilized by reporting, thresholds, alerting, visibility, access control, and filtering response data when utilizing the API. Grouping within Statseeker can be manual or automated by defined grouping rules, for more information on creating and maintaining groups, see Grouping.
Groups can contain a mixture of entities (devices, interfaces, users, reports, etc.), so how can you view the contents of a group once it has been populated?
What Devices are in my Group?
To determine which devices are contained within groups:
- Select one or more groups from the Groups column in the Console
- From the Reports list, select the General > Device Details report
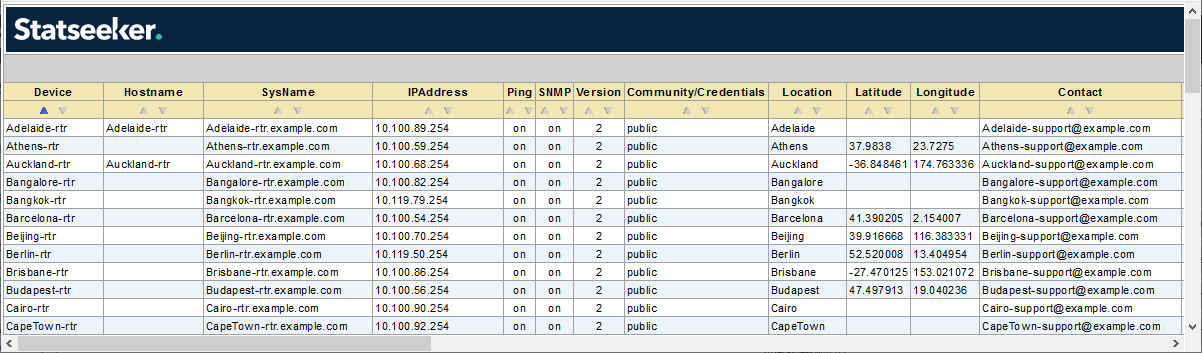
The Device Details report provides configuration details for all devices found within any of the selected group/s, the data includes:
- Device name, host name, sysName and IP address
- Ping and SNMP polling state
- SNMP polling version and community string (SNMPv1/2) or credentials (SNMPv3)
- Location information including longitude/latitude
- SNMP ObjectID, sysDescription and contact details for the person/team responsible for the device management
What Interfaces are in my Group?
To determine which interfaces are contained within groups:
- Select one or more groups from the Groups column in the Console
- From the Reports list, select the Interfaces > Details report
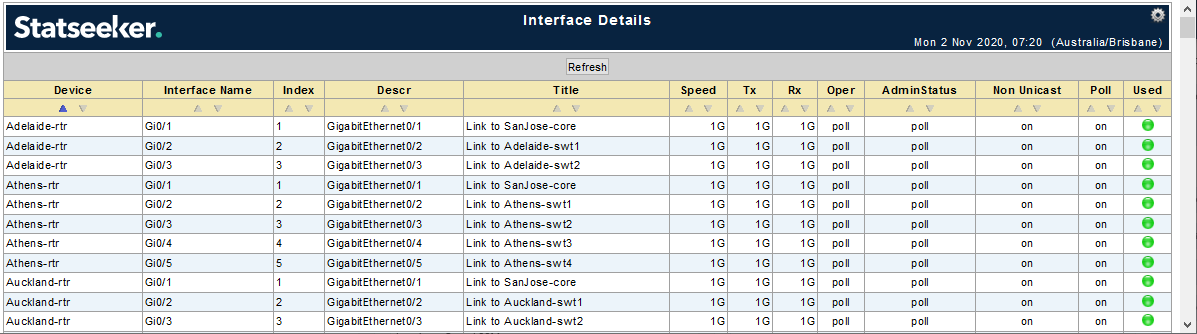
The Interface Details report provides configuration details for all interfaces on devices within the selected group/s, the data includes:
- Device name
- Interface name, title, index, and description
- Interface speed and configured in/out speeds
- Operational and Admin statuses, and poll state
- Whether the interface allows nonunicast traffic, and if traffic has been seen on the interface recently
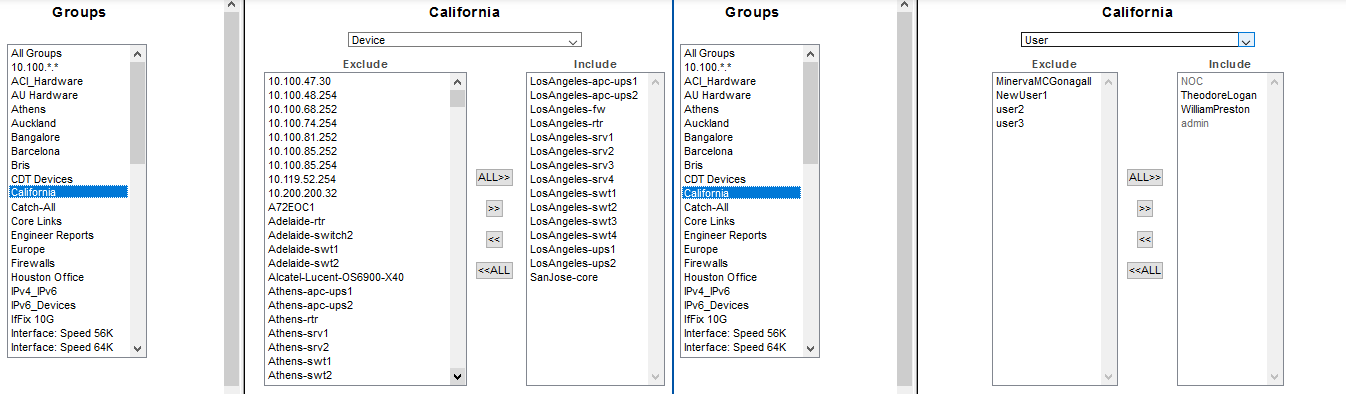
What Other Entities are in my Group?
While reports can be used to view hardware-related entities, details on all group contents, regardless of entity type, can be found within the Admin Tool.
- From within the Admin Tool select User Profile and Grouping > Entities to a Group
- Select the group to be viewed
- Select the entity type from the dropdown
Current group contents are displayed in the Include column, available entities of the selected type are displayed in the Exclude column. Use the ‘arrow’ buttons to update the group if needed.