
Index
Overview
Statseeker provides NetFlow reporting via the Traffic Analyzer, a core component of Statseeker, which analyzes data collected from your configured NetFlow feeds. The Traffic Analyzer can interrogate data from NetFlow v5,7,9, and 10/IPFIX and sFlow data sources. For more information on configuring NetFlow data sources and collectors, see Netflow Configuration.
The Traffic Analyzer allows you to present NetFlow data via a range of customizable reports available in the NIM Console Report List.
Reporting on NetFlow Traffic
To report on NetFlow traffic:
- Select Nim Console > Report List > Traffic Analyzer
This displays the Traffic Analyzer window. This window displays:
- Report List – a list containing the available reports
- Traffic Collector – a list containing the available data sources. See Netflow Configuration for details on configuring NetFlow data sources.
- Time Filter – the time filter to be used in the report. This functionality duplicates that from the NIM Console, see Time Filters for more information.
- General Options – additional filtering and presentation options for the report, see General Options for more information
The report is generated by:
- Setting a Time Filter
- Configuring the General Options to suit the report requirements
- Selecting a Traffic Collector
- Selecting a report from the Report List
General Options
The General Options offers an optional set of filter and layout options for your reports.
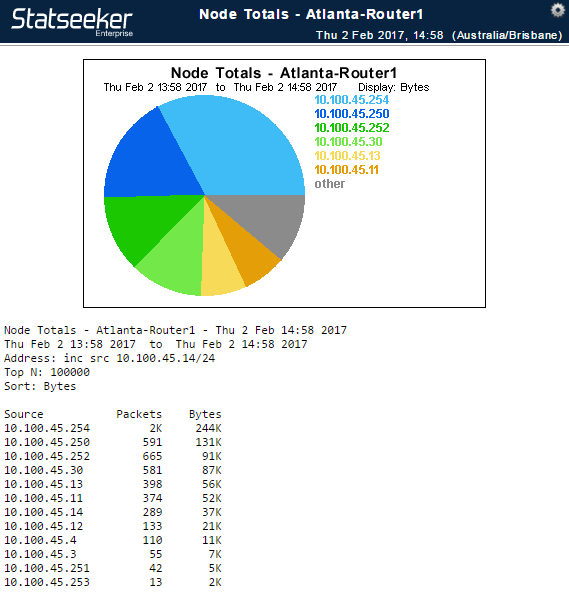
Address – the IP addresses to include/exclude from the report. This information should be provided in the following format:inc/exc src/dst/both ipaddress/mask, where:
- inc/exc refers to the filter being an include or exclude filter
- src/dst/both refer to source (outgoing) / destination (incoming) / both (both) traffic with respect to the specified IP address
- ipaddres/mask refers to an IP address with an optional address mask
E.g. inc src 10.5.10.0/24 specifies that the report contain outgoing traffic from IP addresses in the range of 10.5.10.0 – 10.5.10.255.These filters can be joined with an and/or operator. E.g. inc src 10.5.10.0/24 or inc src 10.5.20.17, all outgoing traffic from IP addresses in the range of 10.5.10.0 – 10.5.10.255, as well as traffic outgoing from 10.2.20.17.E.g. inc src 10.5.10.0/24 and inc dst 10.5.20.17 – all traffic going from 10.5.10.* to 10.2.20.17.
Protocol – filter on the protocols to include/exclude in the report in the format inc/exc protocol.subprotocol, e.g. inc udp.* – include all UDP traffic. Multiple space separated include/exclude rules can be added e.g. inc tcp.ftp inc tcp.tp-data
The Top N is used to specify the number of results to return for each reporting interval over the reporting period.
Interval – the reporting interval/frequency over the reporting period defined by the time filter. The format is Nd | Nh | Nm, e.g. 1d – every day; 2h – every two hours.A report with:
- Report = Conversations
- Time Filter = Last Week
- Top N = 5
- Interval = 1d
- Sort = Bytes
Would show the 5 largest conversations involving the target device for each day over the previous week. 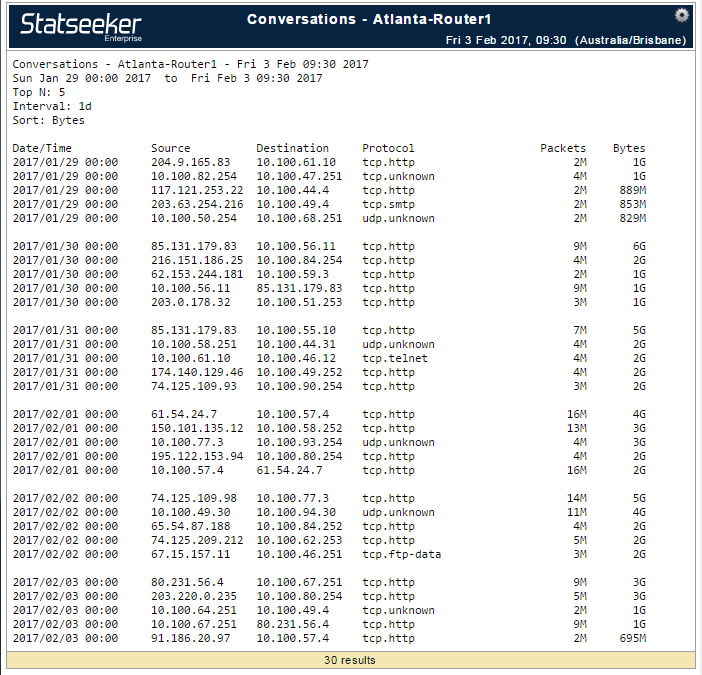
Sort – the metric by which to sort the returned results.
Format – the format for displaying the metric data.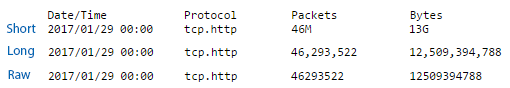
Display – the report style to use (tabular, graph, both).