
Index
Overview
Statseeker will see a correctly configured switch stack as a single entity and monitor its availability via the stack’s shared IP. But this level of monitoring is only looking at whether or not the stack is reachable by the Statseeker server, what about the availability of individual switches within the stack?
There are a few methods to be alerted to a state change relating to a stack member:
- An alert triggered from a syslog entry
- An alert triggered from an SNMP Trap message
- An alert triggered from a change in the ifOperStatus of a stack member’s stack port
Alerting via Syslog
This alerting option will look for syslog messages from the stack members that indicate a stack link state change.
You will need to configure the stack to export syslog messages to the Statseeker server, and then we can configure an alert to review those messages and trigger when a state change is detected.
- Refer to your device specific documentation on how to output syslog
- Direct the syslog output to the Statseeker server IP
- Statseeker listens for incoming syslog on the standard syslog port UPD 514
The following is an example of a state change messages sent from a Cisco Catalyst 9300 series switch which result from disconnecting the cable from Port 2 on Switch 1:
%STACKMGR-4-STACK_LINK_CHANGE: Stack Port 1 Switch 2 has changed to state DOWN

%STACKMGR-4-STACK_LINK_CHANGE: Stack Port 2 Switch 1 has changed to state DOWN
- Simulate a stack member going down (by disconnecting the stack port cable) and review the device’s syslog to determine the appropriate message content
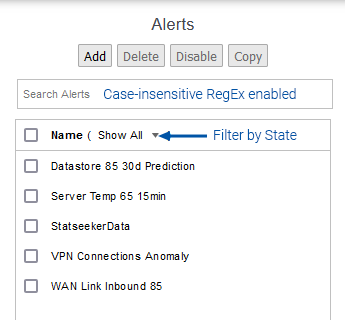
- Select Administration > Alerting / Event Management > Alerting
This will display a list of currently configured alerts.
- Click Add
This will display the New Alert screen.
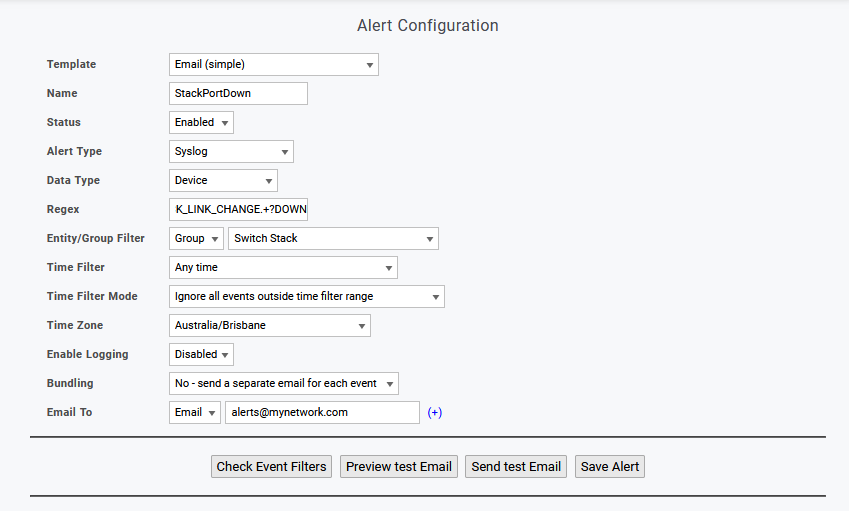
- Select a Template and Name the Alert configuration to suit your requirements
- Set Event Type = Syslog
- Set Data Type = Device
- Set the Syslog regex to reflect the syslog messages being sent by your stack
Syslog messages can differ between vendors, and device types, so ensure that you use the correct regex when creating your filter. Referring to the sample messages presented above, to alert on our example stack we would set the Syslog regex field to:
STACKMGR-4-STACK_LINK_CHANGE.+?DOWN
This will only alert on DOWN state changes. To alert on both UP and DOWN state changes simply omit the .+?DOWN. You can confirm that the regex filter you supplied is picking up the events you want to alert on by using the Check Event Filters option and reviewing the results.
- Set Entity Filter and Time Filter options to suit
From the sample messages we see that a single port going down creates two syslog messages. We can leave the alert configuration as is, and receive two alerts for the one event, or, if we have selected one of the email templates for the alert, we can set a bundling policy to capture both and send them in a single alert email.
- Complete the alert configuration as required by the template you selected and Save the alert
Alerting via SNMP Trap Messages
This alerting option will look for SNMP trap messages from the stack members that indicate a stack link state change.
You will need to configure the stack to export SNMP trap messages to the Statseeker server, and then we can configure an alert to review those messages and trigger when a state change is detected.
The following is an example of a state change message sent from a Cisco Catalyst 3750 series switch:
wlgcsw3750-ES CISCO-STACKWISE-MIB.ciscoStackWiseMIBNotifsenterpriseSpecificCISCO-STACKWISE-MIB.cswRingRedundant.0 true
- Simulate a stack member going down by disconnecting the stack port cable
- From the Console, select Events > SNMP Traps and review the collected SNMP trap messages to determine the appropriate message content
- Select Administration > Alerting / Event Management > Alerting
This will display a list of currently configured alerts.
- Click Add
This will display the New Alert screen.
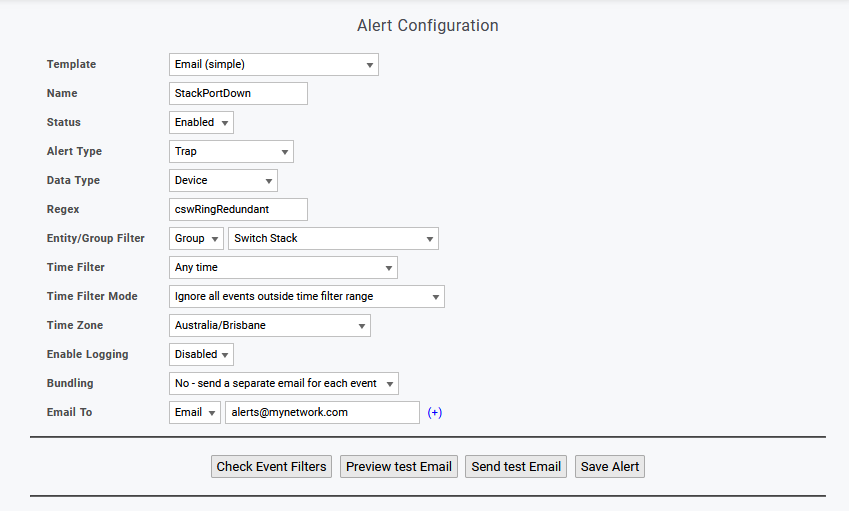
- Select a Template and Name the Alert configuration to suit your requirements
- Set Event Type = Trap
- Set Data Type = Device
- Set the Trap regex to reflect the SNMP trap messages being sent by your stack
SNMP Trap messages can differ between vendors, and device types, so ensure that you use the correct regex when creating your filter. Referring to the sample messages presented above, to alert on our example stack we would set the Trap regex field to:
cswRingRedundant
You can confirm that the regex filter you supplied is picking up the events you want to alert on by using the Check Event Filters option and reviewing the results.
- Set Entity Filter and Time Filter options to suit
- Complete the alert configuration as required by the template you selected and Save the alert
Alerting via ifOperStatus State
By default, ifOperStatus polling is disabled, but can be enabled for those interfaces that we want to alert on. Once enabled, we can configure an alert to trigger on ifOperStatus state changes.
To do this, we will:
- Create a group and populate it with the interfaces that we want to alert on
- Use an Auto-Grouping rule to enable ifOperStatus polling on those interfaces
- Create an alert to trigger on ifOperStatus state changes
Group the Interfaces
We want to create a group that contains only those interfaces to alert on.
- Select Administration > User Profile/Grouping > Add / Edit Groups
- Click Add, enter a group name, and click OK
The group will be created and selected ready for population. By default, the entity type will be set to Device (top of the right-hand column).
- Click the entity type dropdown and set to Interface
- Add the stackport interfaces that you want to alert on, to the newly created group
Enable ifOperStatus Polling via Auto-Grouping
ifOperStatus polling can be quickly enabled for a selection of interfaces by configuring an Auto-Grouping rule within Administration.
- Select Administration > Auto Grouping and click Add
- Set a name for the rule
- Click the Add button for Groups to populate and specify the name of the group we just created
- Set the Group Type to Interface
- Add a group filter specifying the group of stackport interfaces
- Click Show Advanced Options
- In the newly exposed Configuration section, click the Items > Add button and select Interface Options > ifOperStatus
- Ensure that this is set to poll
- Click Test Rule and review the output of the test
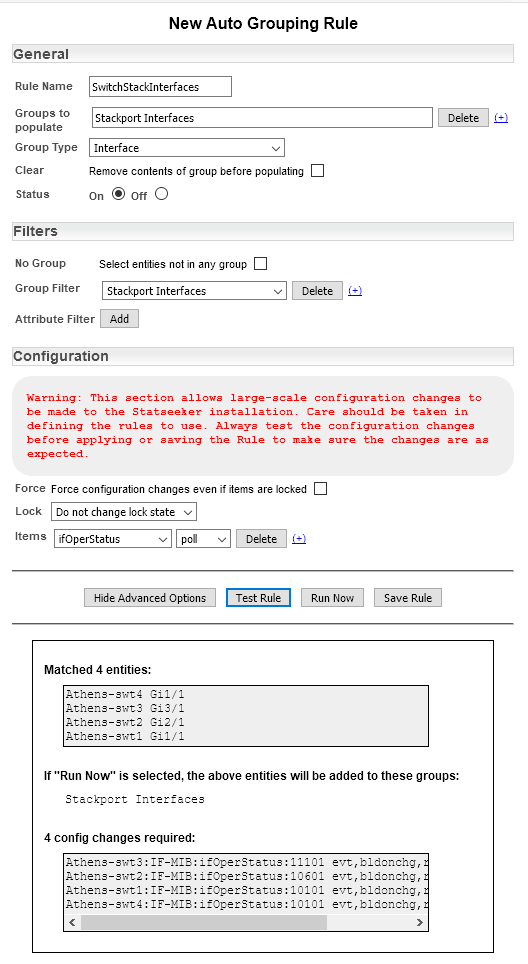
If the output from the rule suits your requirements:
- Select Run Now
- Click Save Rule
Configure an Alert on ifOperStatus State
To configure an alert on the ifOperStatus of the stackports being monitored:
- Select Administration > Alerting / Event Management > Alerting
This will display a list of currently configured alerts.
- Click Add
This will display the New Alert screen.
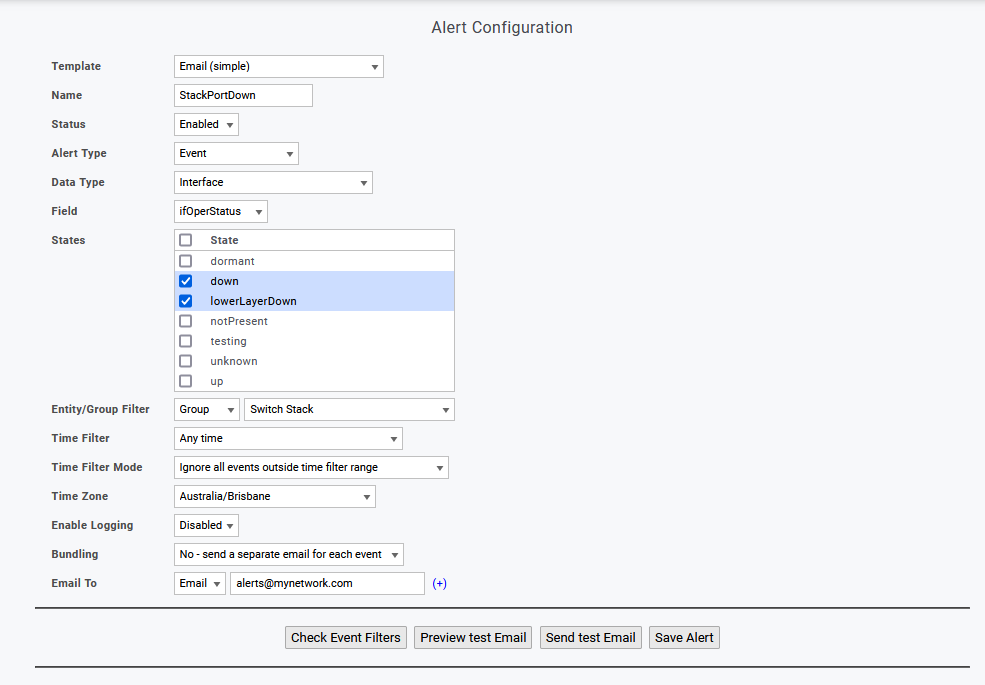
- Select a Template and Name the Alert configuration to suit your requirements
- Set Event Type = Event
- Set Data Type = Interface
- Set Field = ifOperStatus
- Select the States that you want to trigger the alert
- Set the Group Filter to your stackport group
- Set the Time Filter options to suit your needs
If the stack/s you are alerting on have previously dropped switches while being monitored by Statseeker, then there will be event records relating to those events.
- Use Check Event Filters, and review the output, to ensure that your group and time filters are configured correctly
- Save the alert configuration