
Index
- Overview
- Viewing a Report
- Report Links, Drill Downs & Historical Views
- Summary Reports
- Report Filters
- Advanced Reporting Tool
- Statseeker Stock Reports
- Custom Reports
Overview
The Statseeker NIM Console provides the major entryway into the Statseeker reporting functionality. From here you have access to every Statseeker report, be it pre-packaged or custom made to suit your exact requirements, as well as the options and filters to focus that report to show the data you want in the way you want.
The NIM Console tailors the stock Report List to reflect those devices/interfaces being polled by Statseeker, filtering out any pre-packaged report that does not apply to your network. For example, if your network does not feature a Frame Relay, then no Frame Relay reports will be displayed in the NIM Console. If, later, a Frame Relay is added to your network, then the Frame Relay will be discovered on the next rewalk/discovery, added to your list of polled devices and the associated reports will be made available in the NIM Console.
Viewing A Report
To view a report from the NIM Console:
- Select either a device or a device group. Hold Shift while clicking to select groups of devices and Ctrl to add/remove a single device to/from the selection.
- Click to launch the report
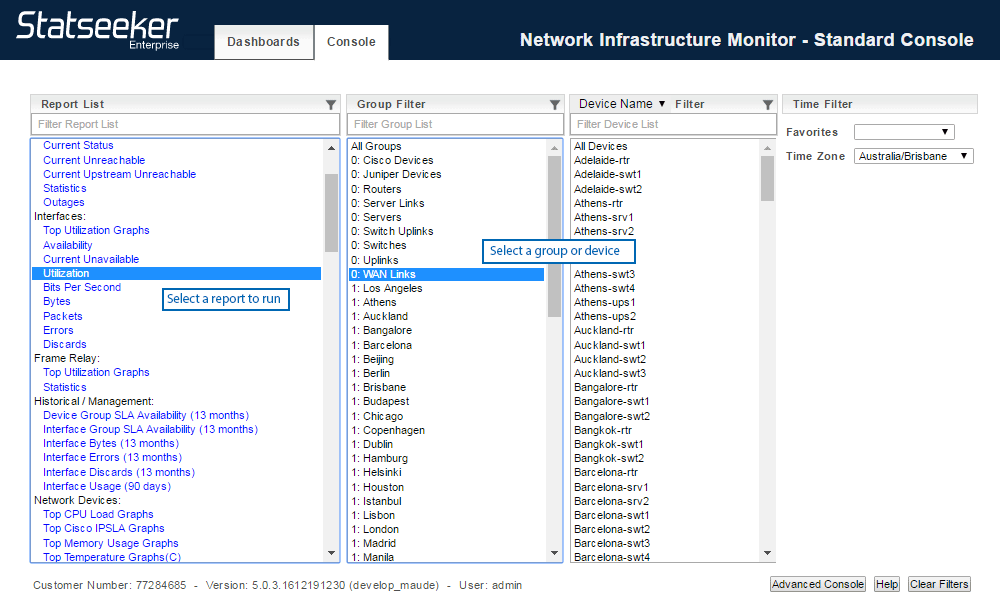
The report will launch in a new window.
Report Links, Drill Downs & Historical Views
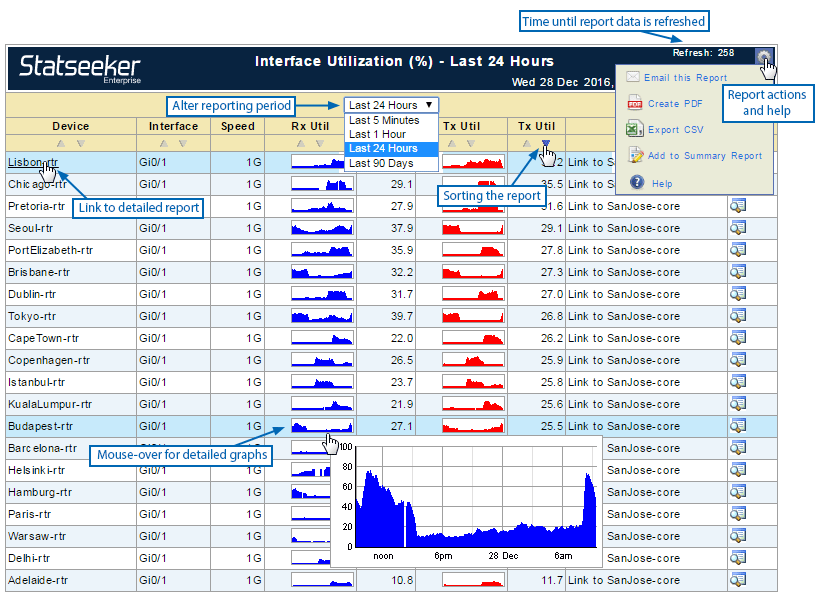
Most reports will offer the ability to drill-down to more specific data regarding a device, interface, property or activity presented in the report. In this way, you can review a metric across a range of devices or a range of metrics returned from a single device, identify anomalous values and then investigate further to resolve the issue as required.
In tabular reports, these drilldowns and pointers to other reports are provided as links on each of the appropriate cell contents, simply click to access the new report.
All graphs act as links to a ‘details’ report for that metric on that device.
In a similar manner, you can zoom out to review a device or metric over a larger, historical time scale. By default, most reports will present what is currently happening but you can easily alter the report period to ascertain if the current behavior is anomalous or typical.
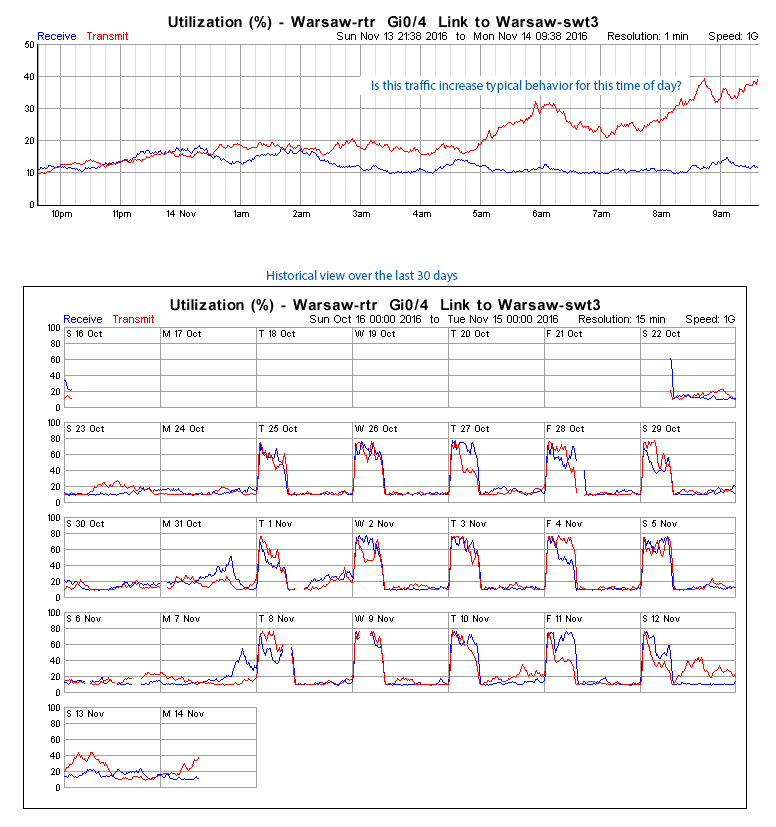
Historical data is available for all devices/interfaces from the moment that they are discovered and this data is always available at the same, 1-minute interval, resolution that it was collected. Statseeker will never ‘roll-up’, or average your data, regardless of how long ago it was collected.
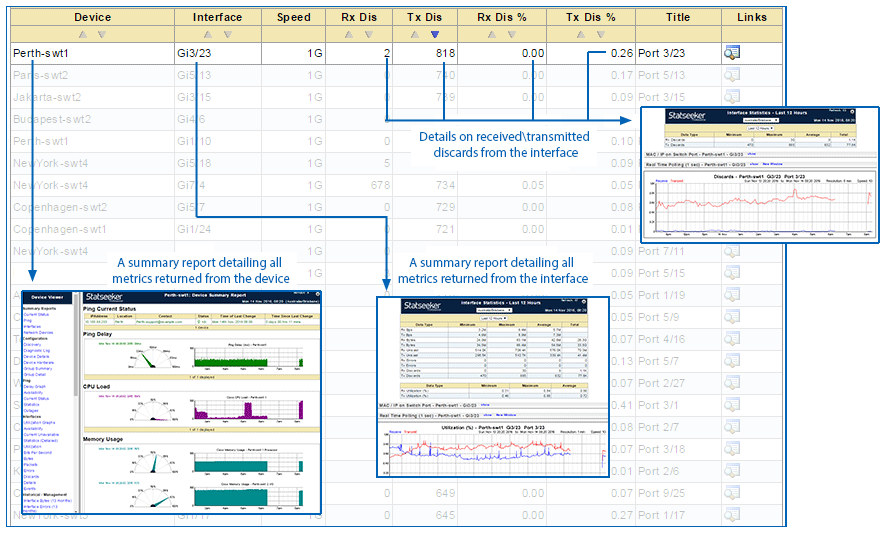
Summary Reports
A summary report is a report containing other reports. Summary reports might provide a snapshot of a device/interface across a range of metrics, such as the Device Viewer, or maybe details of a single metric over a range of devices, such as the Top Utilization Graphs, or maybe a combination of these perspectives.
Summary reports can also be created in the Custom Reporting Tool, allowing you to tailor a report to precise requirements and like all other reports, summary reports can also be embedded in a dashboard.
Report Filters
Reports generally focus upon a device/interface, group of devices/interfaces or a metric, and can be filtered. The filters consist of four main sections.
- Group Filter
- Device Name (IP Address or sysName)
- Time Filter
- General
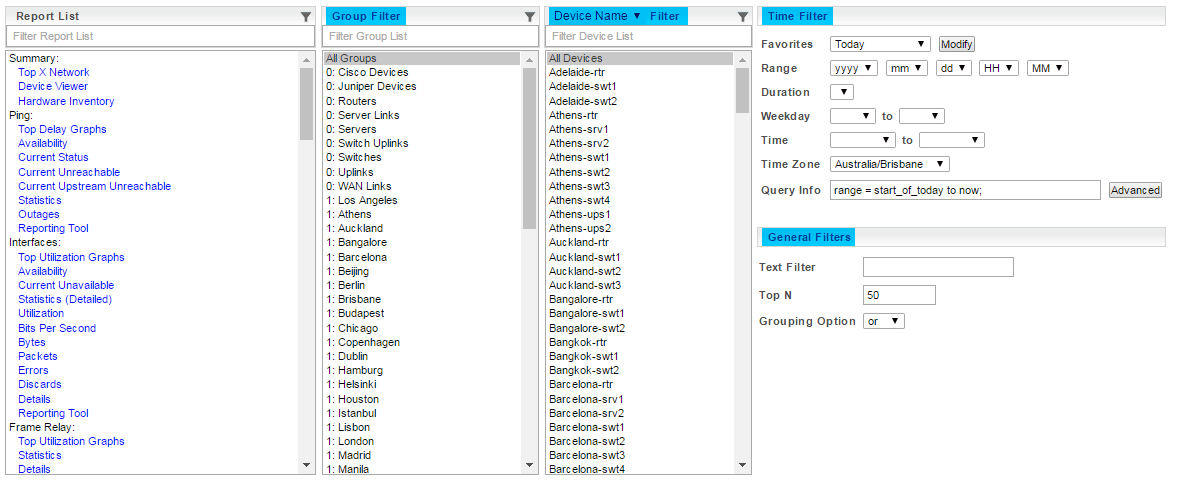
While the Group Filter and Device Name filters remain the same between the Standard and Advanced views, the contents of those filters may vary between users according to the groups that have been assigned to the user.
The time filters apply to ‘event’ based reports (such as Availability, Syslog, Traps, and Thresholds) and the available options vary between the Standard Console and Advanced Console views.
The Advanced Console also offers an additional General Filters section.
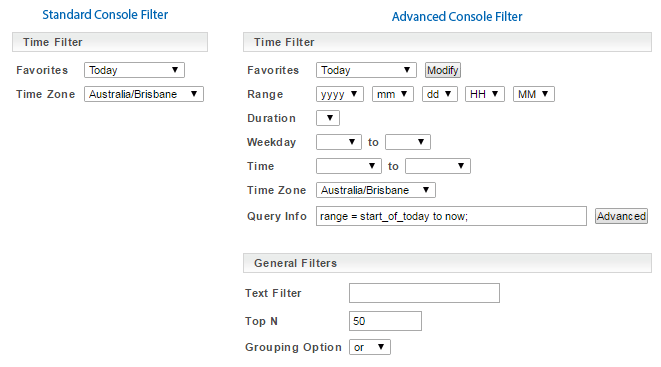
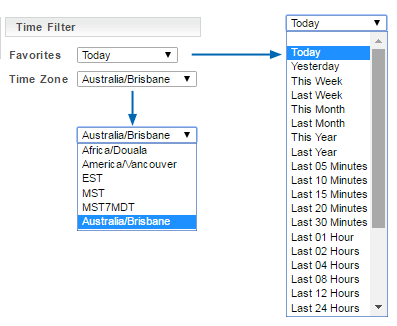
The Standard Console Time Filter offers two drop-down menus:
- Favorites – populated from entries configured in the Administration Tool or the Advanced Console
- Time Zone – contents configured in the Administration Tool, defaults to all time zones
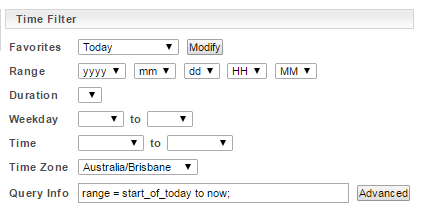
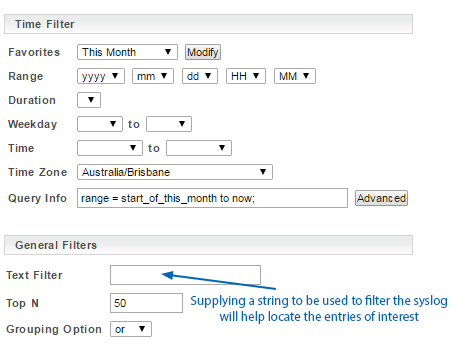
The Advanced Console Time Filter presents a range of options that can be used to specify a reporting period.
- Favorites – populated from entries configured from the Modify button or in the Administration Tool
- Range and Duration – can be used together to specify a reporting period
- Weekday and Time – can be used together to filter a specified reporting period
- Time Zone – select the time zone to be used with the specified reporting period
- Query Info – a set of time filter rules used to interrogate the Statseeker database to build the report. This field can be manually edited at any time.
The General Filter available from the Advanced Console offers additional filtering options:
- Text Filter – enter a single string, or regex expression, to be used in filtering the results based on the returned values for Device Name
- Top N – limit the number of results to return
- Grouping Option – the operator to be applied when making multiple selections in the Group Filter column
- The default Top N can be configured from the edit user screen
- Custom reports can be configured with a specific Results per page setting which will override the Top N setting in the NIM Console
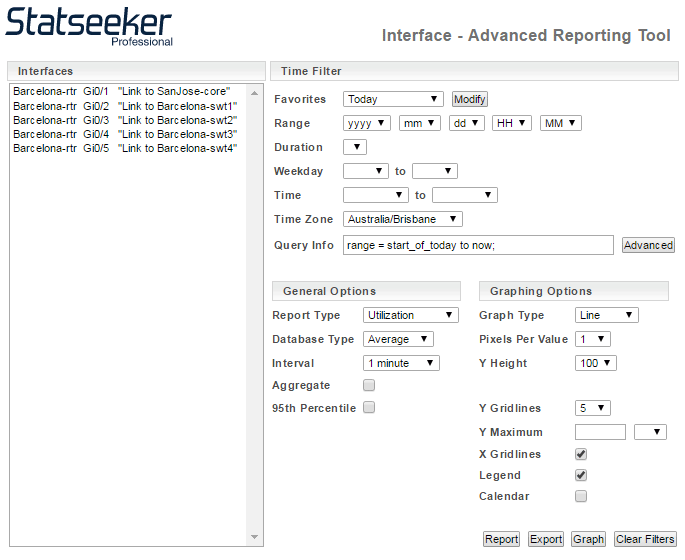
Advanced Reporting Tool
Many of the sections in the Report List feature an entry called Reporting Tool which provides access to additional reporting customization options useful for quickly configuring one-off reports. This feature is also available as a link from within many reports.
The Advanced Reporting Tool breaks available filters and options into 3 groups:
- Time Filter – offering the same options as the advanced console time filters
- General Options – general options concerning the type of report to be run which vary depending on the focus of the report (server, device, interface, etc.) but can include:
- Report Type – which metric to report on
- Database Type – data manipulation options (display averages, totals, maximums, etc.)
- Interval – resolution of the data
- Aggregate – toggle to select individual or aggregate values reported
- 95th Percentile – toggle to identify the 95th percentile values for the metric
- Graphing Options – presentation options for graphs
- Graph Type – line, bar, etc.
- Pixels Per Value – how large to display each data point, useful for modifying how bar graphs are presented
- Y Height – modify the y-axis height by the selected % of standard Statseeker graph height
- Y Gridlines – select number of y-axis reference lines to display
- Y Maximum – specify a value and a unit of measurement and only values under that limit will be plotted
- X Gridlines – toggle to display x-axis reference lines
- Legend – toggle to display
- Calendar – toggle to wrap the x-axis and remove the requirement for horizontal scrolling when viewing large data sets
The tool allows you to produce tabular reports (using the Report button) or graphical reports (Graph button) and to export (Export button) the report data in *.csv format.
Statseeker Stock Reports
Statseeker is packaged with a wide range of stock reports covering all aspects of network monitoring, providing you the ability to interrogate and visualize your network infrastructure and activity with no requirement for report configuration.
Top X Network
The Top X Network report is a summary report defaulting to the last 5 minutes and returning:
- Current Device Outage Status – all currently unreachable devices
- Network Delay/Ping Response time (Top 20) – top 20 devices which are online but possessing the highest latency
- Interface Utilization % (Top 20) – top 20 interfaces experiencing the highest level of utilization
- Interface Bits per Second (Top 20) – top 20 interfaces experiencing the highest traffic throughput rate (bits/second)
- Interface Bytes (Top 20) – top 20 interfaces experiencing the highest traffic throughput total (bytes)
- Interface Error Totals (Top 20) – top 20 interfaces reporting the highest number of errors in their traffic
- Interface Discard Totals (Top 20) – top 20 interfaces reporting the highest number of discards (combined in/out) from their traffic
The Top X Network report ignores all filters.
Device Viewer
The Device Viewer report is a summary report offering all reports, across all metrics, applicable to the device. The report window is broken into two parts, the left offering a list of all reports for the device and the right which displays the selected report. At launch, the Device Viewer will display a current state performance view for the device. This report also offers the ability to rewalk the device to retrieve any recent changes to the MIB (Management Information Base) for the device.
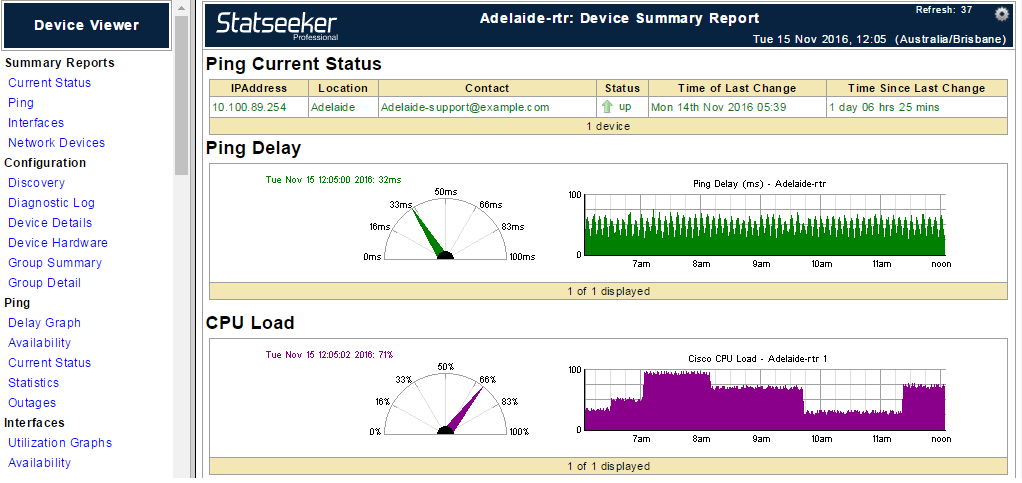
The Device Viewer requires a device to be selected prior to running.
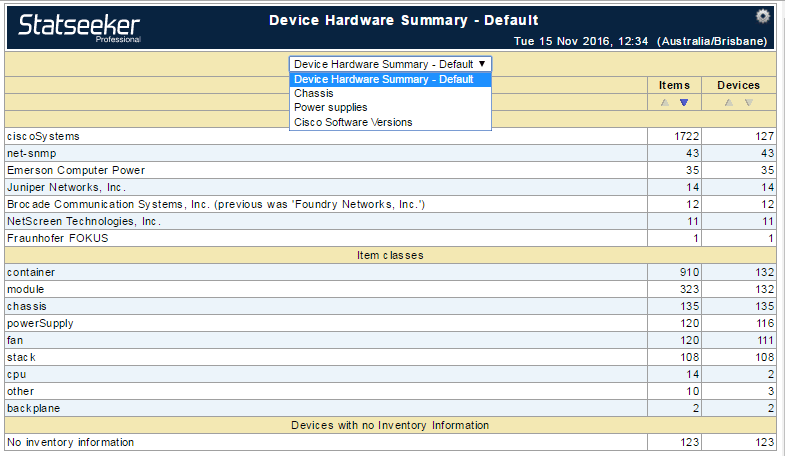
Hardware Inventory
The Hardware Inventory report is a summary report presenting details (make, model, location, IPAddress, licensing details) on all the hardware in your network that is being polled by Statseeker. The default view presents this information categorized by vendor and hardware type, each of which is a link to a report detailing the contents of that category.
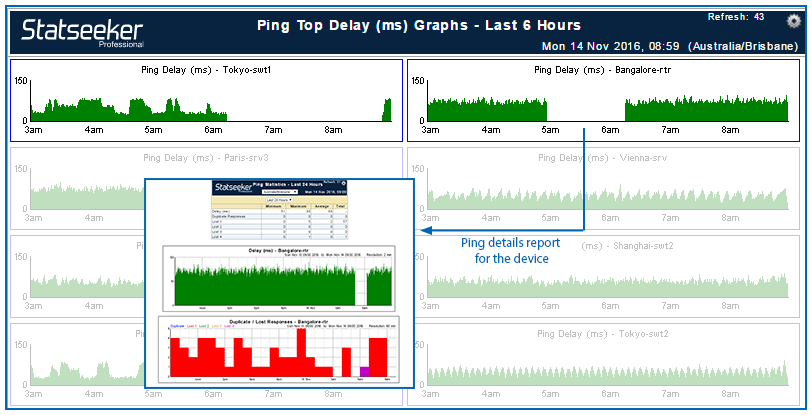
Ping: Top Delay Graphs
The Ping: Top Delay graph is a summary report of the top 50 interfaces reporting the highest ping value over the previous 6 hours. Each graph can be clicked to access a ping statistics report for that interface.
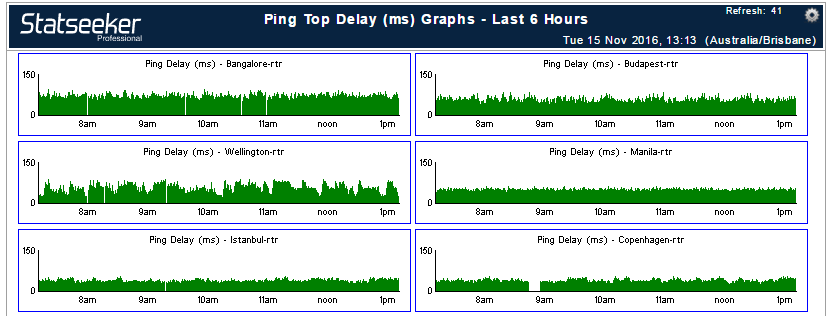
This report requires that a group or device be selected prior to running.
Ping: Availability
The Ping: Availability report is a tabular report highlighting those devices that were reported as being in a down state during the date-time range specified by the time filter. The report has a default sort of ‘number of transitions’, descending. You can drill down into a selected groups’ contents and into the Device Viewer for a selected device.
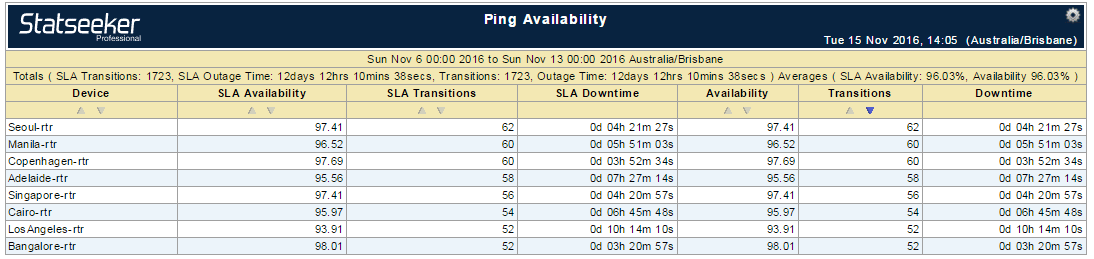
This report requires a time filter and a group/device selected prior to running.
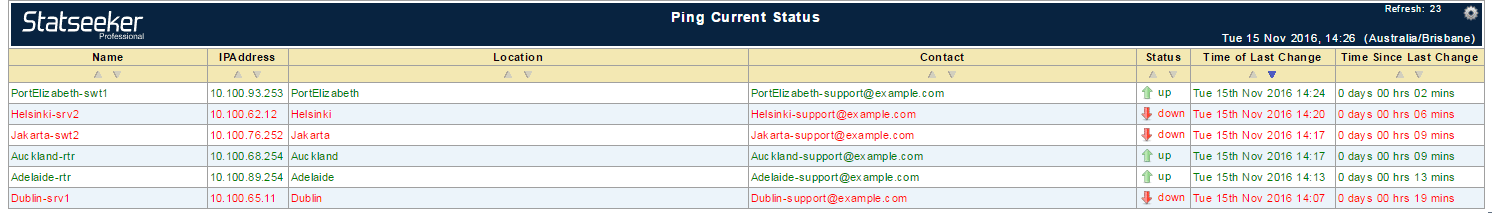
Ping: Current Status
The Ping: Current Status report presents the availability status of all polled devices at the current time. The report offers drill-downs to the Device Viewer and Outages reports.
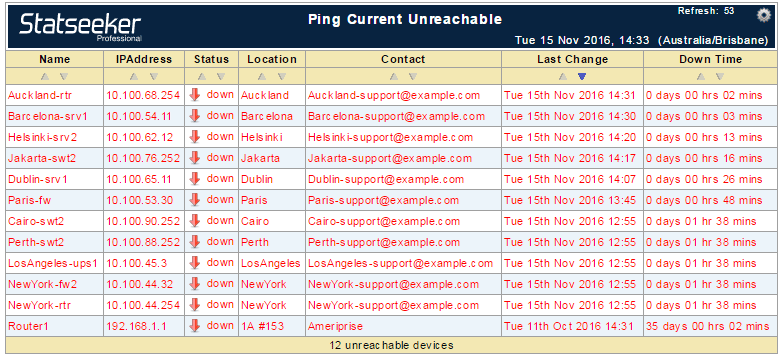
Ping: Current Unavailable
The Ping: Current Unavailable report details those devices that are currently not returning a ping response. The report offers drill-downs to the Device Viewer and Outages reports.
Ping: Current Upstream Unreachable
The Ping: Current Upstream Unreachable report returns those devices that are currently not returning a ping response and are not considered to be downstream from another unreachable device. The report offers drill-downs to the Device Viewer and Outages reports.
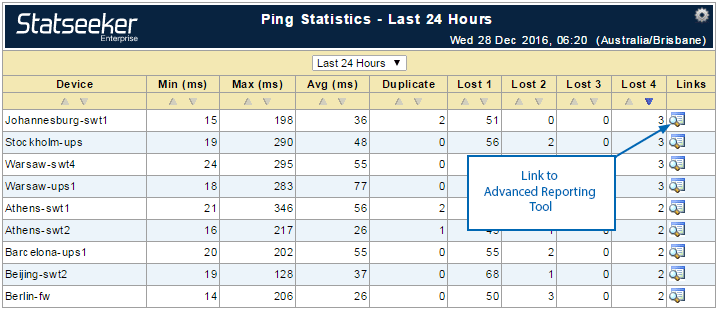
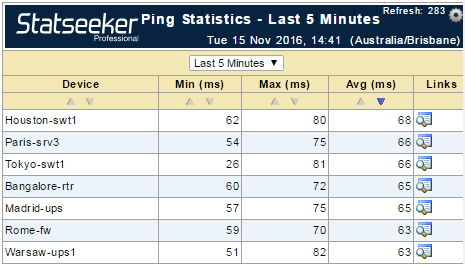
Ping: Statistics
The Ping: Statistics report details minimum, maximum and average ping response times for devices. The report offers drill-downs to the Device Viewer and a ping response details report.
Outages
The Ping: Outages report details the outages for the selected group/device over the specified time period. The report offers drill-downs to the Device Viewer.
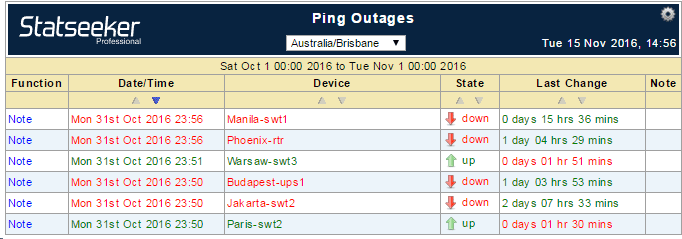
This report requires a time filter.
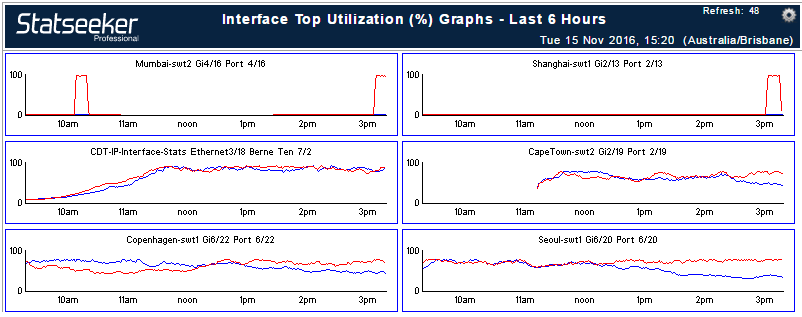
Interface: Top Utilization Graphs
The Interface: Top Utilization Graphs report is a summary report presenting a graphical representation of traffic from the interfaces which have recorded the highest peak level of utilization in the last 6 hours. Each graph is a link to the Interface Statistics report for that interface.
Interface: Availability
The Interface: Availability report is a tabular report using the ifOperStatus of an interface to assess that interface’s availability, and how this may affect assigned SLA figures, for the specified time period.
The report offers drill-downs to Device Viewer and an Interface: Outage report.
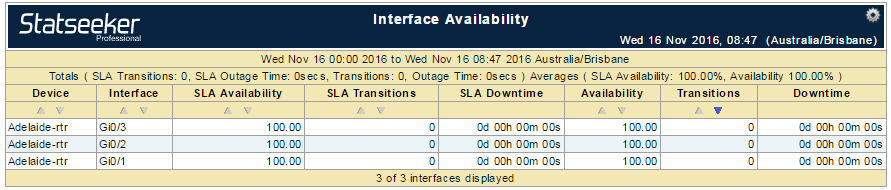
This report requires both a time filter and a group/device (other than All Groups/Devices) be selected prior to running. If selecting a group, then that group must contain at least one interface with ifOperStatus being polled. The current state of this polling can be determined by:
- Selecting a device or group
- Running the Interface: Details report
- Reviewing the contents of the Oper column
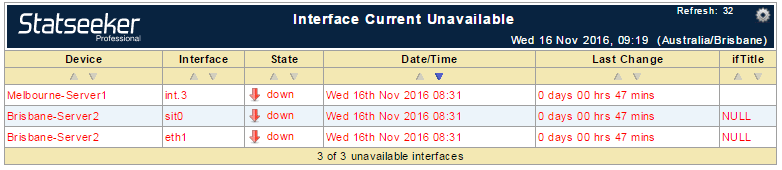
Interface: Current Unavailable
The Interface: Current Unavailable report details those interfaces that are currently not returning a ping response. The report offers drill-downs to the Device Viewer and an Interface Outages report.
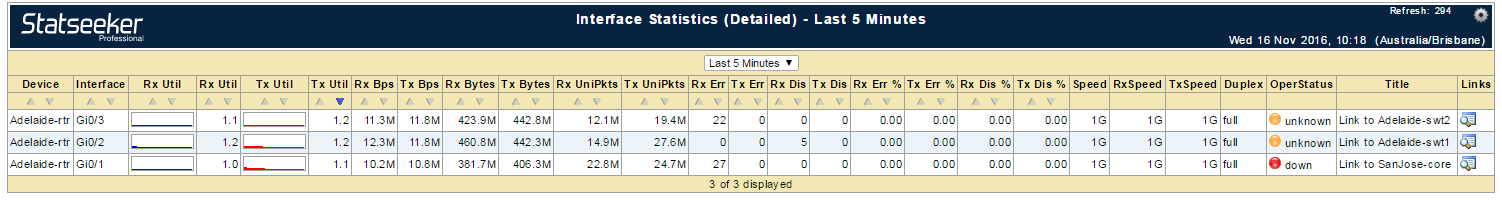
Interface: Statistics (Detailed)
The Interface: Statistics (Detailed) report returns a range of data on all interfaces on the selected device, or all interfaces within the selected group. The returned data includes:
- Interface utilization details, up and down
- Received and transmitted traffic rates, counts, errors and discards
- Interface speed, configuration and ifOperStatus
The default sort is by Transmit Utilization and offers drill-downs to various focused interface statistics reports and the Device Viewer.
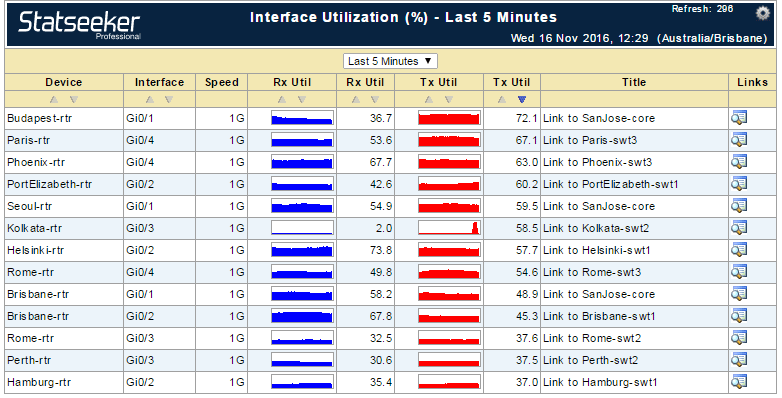
Interface: Utilization
The Interface: Utilization report returns graphical and text-based data on the utilization percentages for all interfaces included in the report. The default sort is by transmit utilization and default time period is the last 5 minutes, this time period can be altered from within the report to expand the scope.
The report offers drill-downs to various interface statistics reports and the Device Viewer.
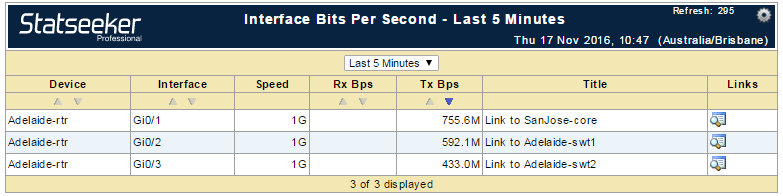
Interface: Bits Per Second
The Interface: Bits Per Second report is a tabular report detailing the average maximum transfer rates, in bits/sec over the time period specified within the report. Depending on the device/group selected, the report will return the top 50 interfaces, those with the highest average maximum transfer rates.
The report offers drill-downs to various interface statistics reports and the Device Viewer.
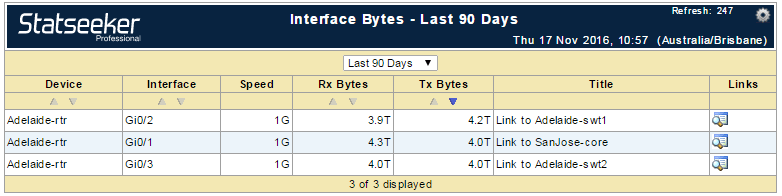
Interface: Bytes
The Interface: Bytes report is a tabular report detailing the total bytes transferred across the interface in either direction over the time period specified within the report. Depending on the device/group selected, the report will return the top 50 interfaces, those with the highest traffic counts.
The report offers drill-downs to various interface statistics reports and the Device Viewer.
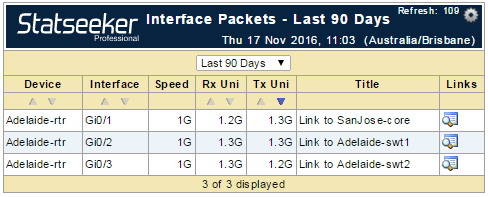
Interface: Packets
The Interface: Packets report is a tabular report detailing the total unicast traffic over the time period specified within the report. Depending on the device/group selected, the report will return the top 50 interfaces, those with the highest traffic counts.
The report offers drill-downs to a unicast statistics report and the Device Viewer.
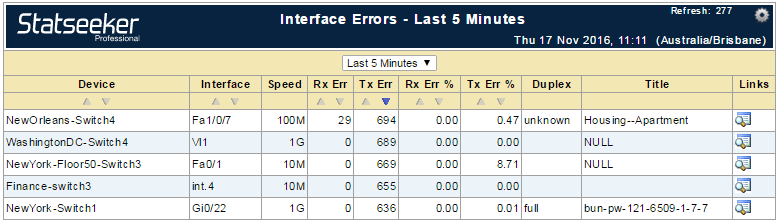
Interface: Errors
The Interface: Errors report is a tabular report detailing the total transmit and receive errors over the time period specified within the report. Depending on the device/group selected, the report will return the top 50 interfaces, those with the highest error counts.
The report offers drill-downs to detailed error and interface statistics reports as well as the Device Viewer.
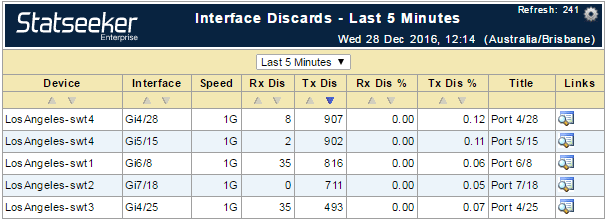
Interface: Discards
The Interface: Discards report is a tabular report detailing the total discarded packets for both transmitted and received traffic over the time period specified within the report. Depending on the device/group selected, the report will return the top 50 interfaces, those with the highest discard counts.
The report offers drill-downs to detailed error and interface statistics reports as well as the Device Viewer.
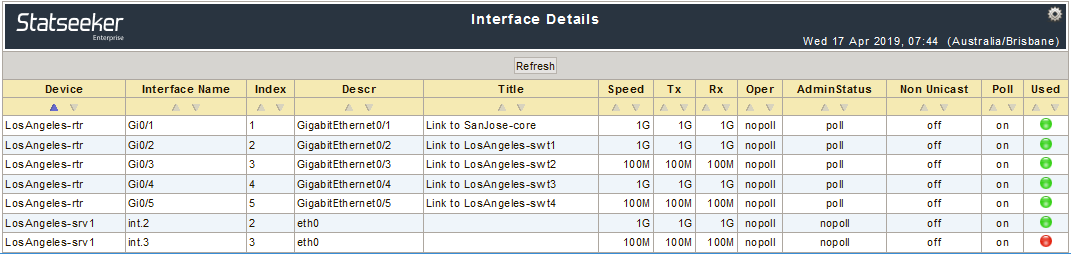
Interface: Details
The Interface: Details report is a tabular report covering specifications, configuration, and polling status. The report will return details on 50 interfaces (change the General Filters > Top N to adjust this value) sorted by Device Name > Interface Name.
The report offers drill-downs to the Device Viewer and NIM Config Editor as well as the ability to toggle ifOperStatus and ifAdminStatus polling, SNMP polling and unicast/multicast communication.
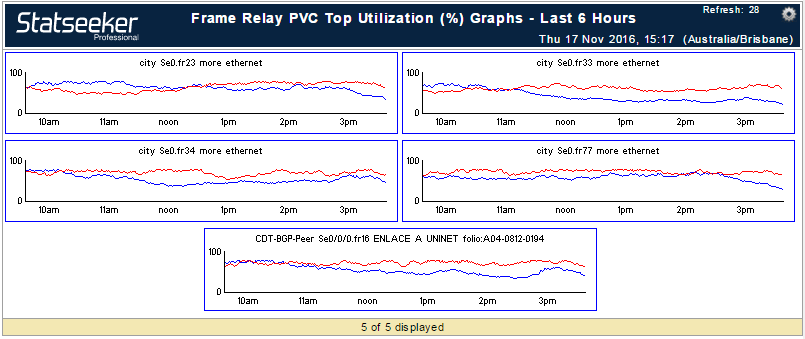
Frame Relay: Top Utilization Graphs
The Frame Relay: Top Utilization Graphs report is a summary report presenting a graphical representation of traffic through the Frame Relay interfaces which have recorded the highest peak level of utilization in the last 6 hours. Each graph is a link to the Frame Relay: Statistics report for that device.
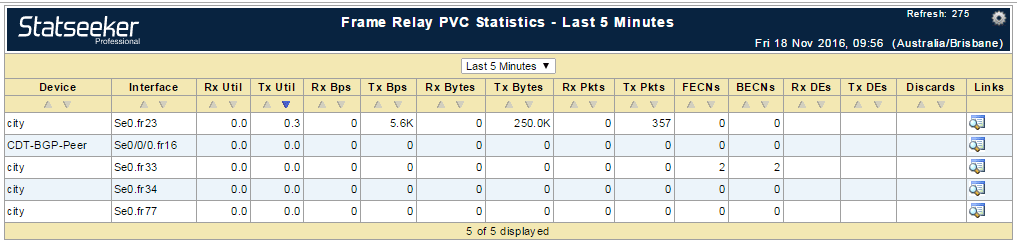
Frame Relay: Statistics
The Frame Relay: Statistics report returns a range of data on all interfaces operating within a Frame Relay in the selected group/device. The returned data includes:
- Interface utilization details
- Received and transmitted traffic rates, counts, errors and discards
- FECN (forward explicit congestion notification), BECN (backward explicit congestion notification) DE (discard eligibility) bit details
The default sort is by Transmit Utilization and offers drill-downs to various focused Frame Relay interface statistics reports and the Device Viewer.
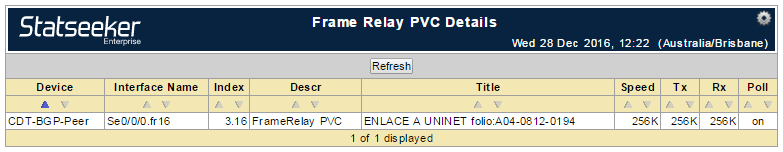
Frame Relay: Details
The Frame Relay: Details report is a tabular report covering specifications and polling status of the interfaces in the Frame Relay.
The report offers drill-downs to the Device Viewer and NIM Config Editor as well as the ability to toggle SNMP polling.
Historical/Management: Device Group SLA Availability
The Device Group SLA Availability report returns details on total availability and availability during defined SLA times for the previous 13 months. The report offers drill-down to Ping Availability reports for selected months.
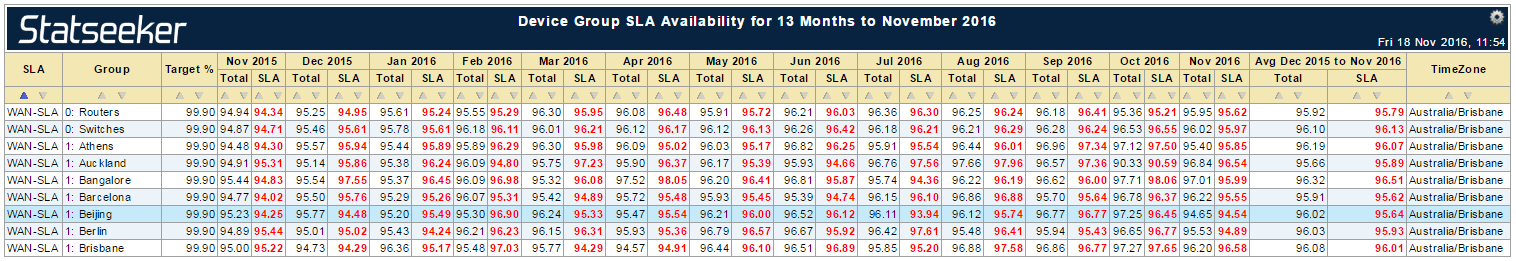
This report requires a group/device selected that has been associated with a defined SLA.
Historical/Management: Interface Group SLA Availability
The Interface Group SLA Availability report returns details on total availability and availability during defined SLA times for the previous 13 months. The report offers drill-down to Interface: Availability reports for selected months.
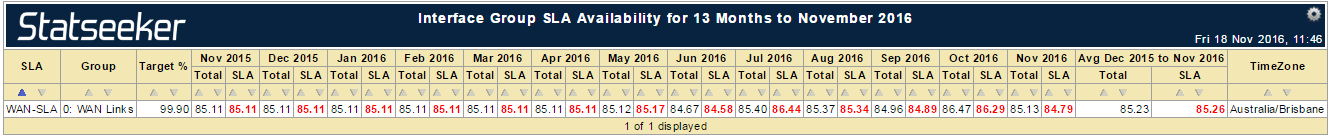
This report requires a group/device selected that has been associated with a defined SLA.
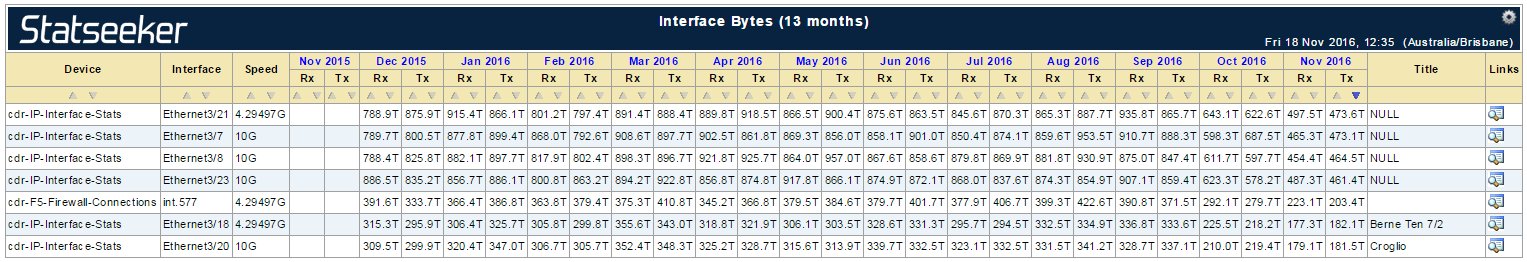
Historical/Management: Interface Bytes
The Historical/Management: Interface Bytes report details the monthly inbound and outbound byte counts over the previous 13 months. Drill-downs are offered to monthly Interface: Bytes reports and the Device Viewer.
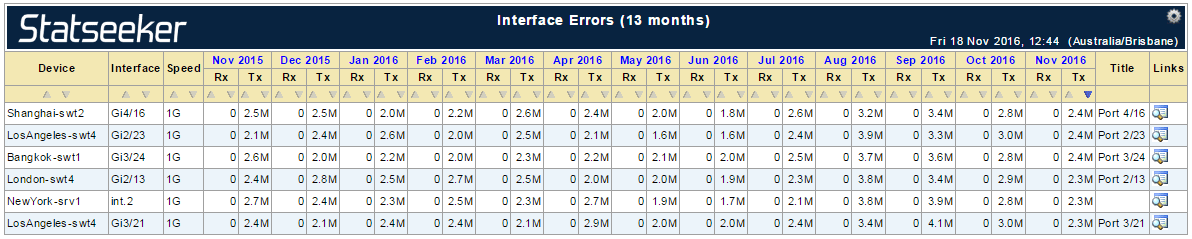
Historical/Management: Interface Errors
The Historical/Management: Interface Errors report details the monthly inbound and outbound error counts over the previous 13 months. Drill-downs are offered to monthly Interface: Errors reports and the Device Viewer.
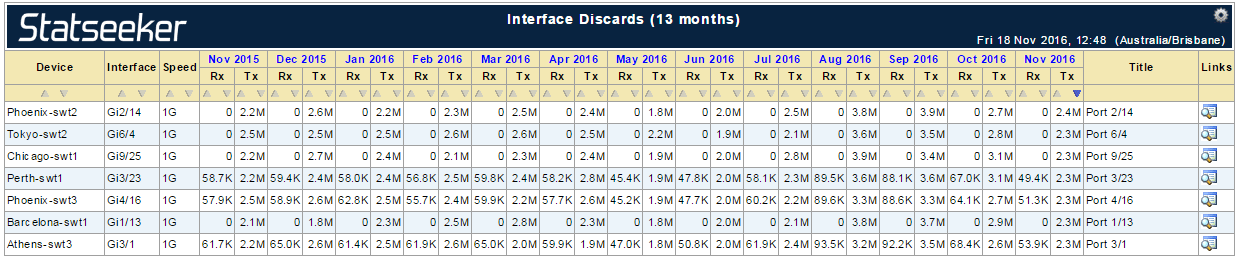
Historical/Management: Interface Discards
The Historical/Management: Interface Discards report details the monthly inbound and outbound discard counts over the previous 13 months. Drill-downs are offered to monthly Interface: Discards reports and the Device Viewer.
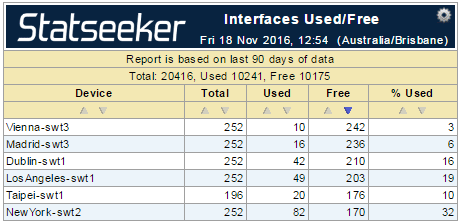
Historical/Management: Interface Usage
The Historical/Management: Interface Usage report details unused interfaces per device over the previous 90 days. Drill-downs are offered to Interface: Details reports and the Device Viewer.
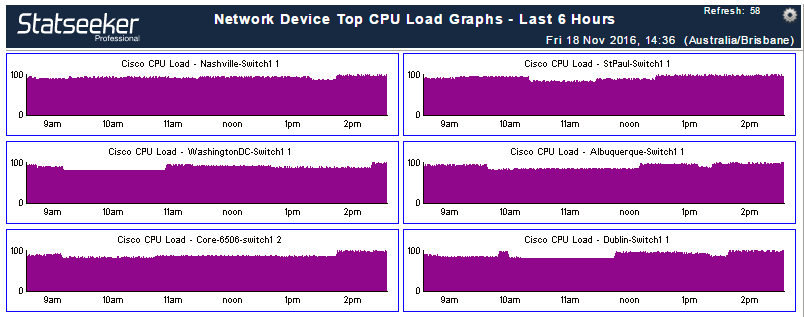
Network Device: Top CPU Load Graphs
The Network Device: Top CPU Load Graphs report is a graphical representation of the top 50 devices registering the highest CPU loads over the last 6 hours. Each graph is a link to a more detailed CPU load report for the selected device.
Network Device: Top Cisco IPSLA Graphs
The Network Device: Top Cisco IPSLA Graphs report is a graphical representation of the top 50 devices registering the highest network response times over the last 6 hours. Each graph is a link to a more detailed Cisco IPSLA report for the selected device.
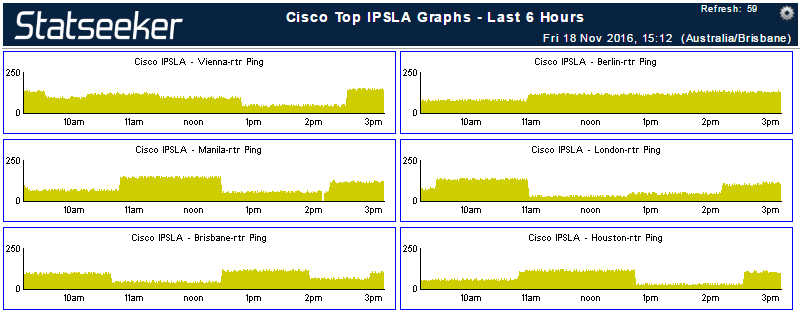
This report requires a Cisco device which supports CISCO IPSLA reporting.
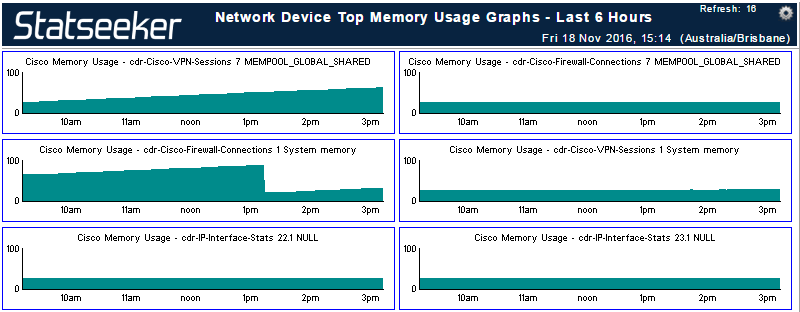
Network Device: Top Memory Usage Graphs
The Network Device: Top Memory Usage Graphs report is a graphical representation of the top 50 devices registering the highest memory usage over the last 6 hours. Each graph is a link to a more detailed Cisco Memory Usage report for the selected device.
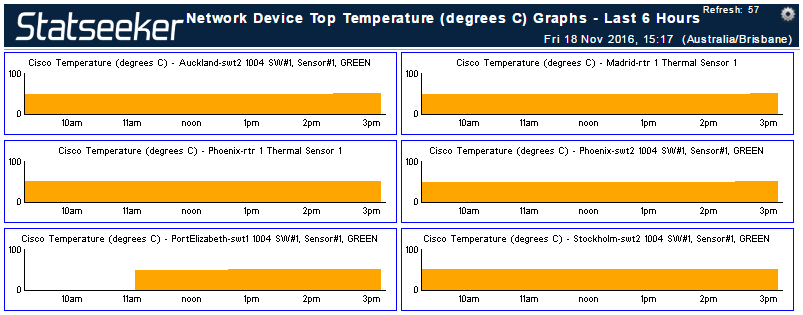
Network Device: Top Temperature Graphs (C)
The Network Device: Top Temperature Graphs (C) report is a graphical representation of the top 50 devices registering the highest CPU temperatures over the last 6 hours. Each graph is a link to a more detailed CPU Temperature report for the selected device.
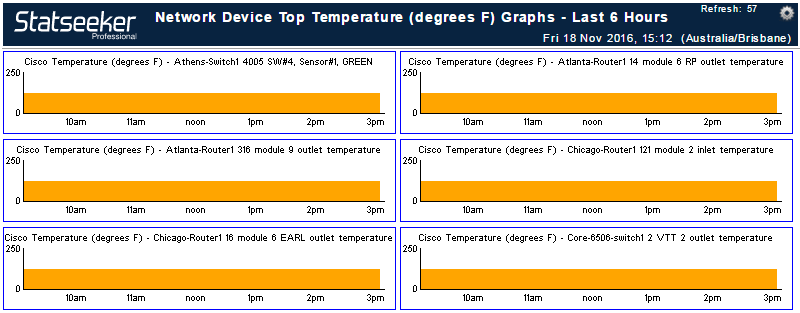
Network Device: Top Temperature Graphs (F)
The Network Device: Top Temperature Graphs (F) report is a graphical representation of the top 50 devices registering the highest CPU temperatures over the last 6 hours. Each graph is a link to a more detailed CPU Temperature report for the selected device.
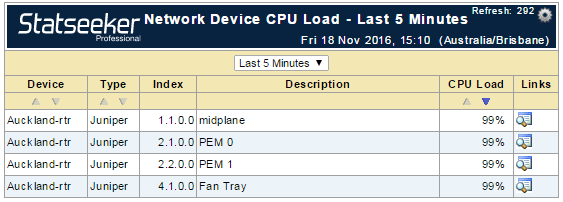
Network Device: CPU Load
The Network Device: CPU Load report returns the CPU load for the device/s or group/s selected. The report defaults to the last 5 minutes, and this reporting period can be edited from within the report. The report offers drill-downs to a detailed CPU Load report for the selected device and the Device Viewer.
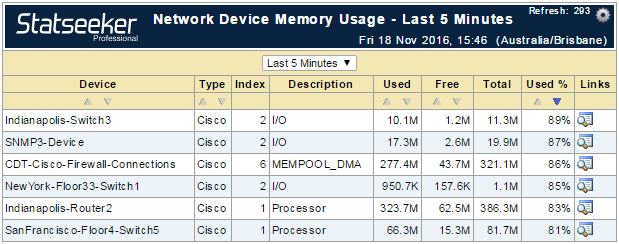
Network Device: Memory Usage
The Network Device: Memory Usage report details the memory usage for the device/s or group/s selected. The report defaults to the last 5 minutes, and this reporting period can be edited from within the report. The report offers drill-downs to a detailed memory usage report for the selected device and the Device Viewer.
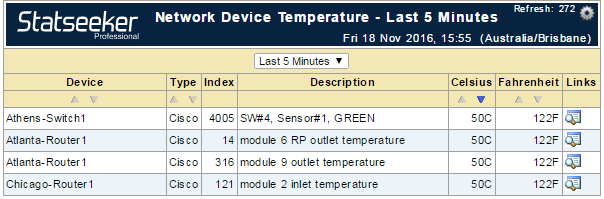
Network Device: Temperature
The Network Device: Temperature report presents the CPU temperature for the device/s or group/s selected. The report defaults to the last 5 minutes, and this reporting period can be edited from within the report. The report offers drill-downs to a detailed CPU temperature report for the selected device and the Device Viewer.
Network Device: Cisco IPSLA
The Network Device: Cisco IPSLA Graphs report details the network response times for the device/s or group/s selected. The report defaults to the last 5 minutes, and this reporting period can be edited from within the report. The report offers drill-downs to a detailed Cisco IPSLA report and the Device Viewer.
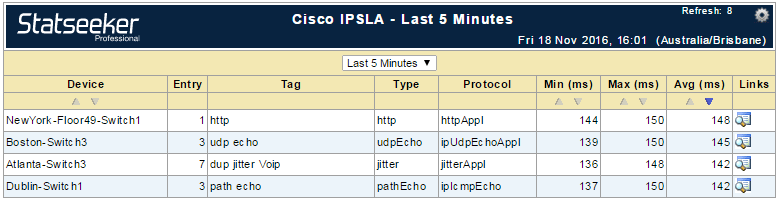
This report requires a Cisco device which supports Cisco IPSLA reporting.
Network Device: Cisco NBAR Interfaces
The Network Device: Cisco NBAR Interfaces report returns a result if the device, or group, selected contains an interface which is capable of reporting Cisco NBAR (Network Based Application Recognition) data. The report provides drill-downs to the Device Viewer and a Cisco NBAR report for the selected interface (pictured below).
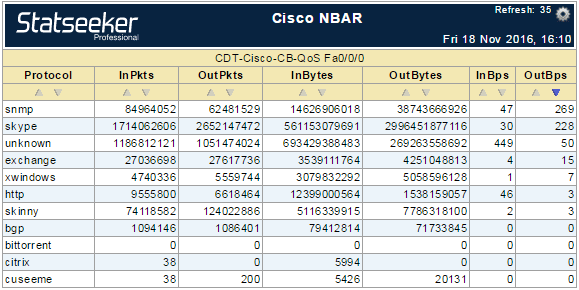
This report requires an interface capable of reporting Cisco NBAR data.
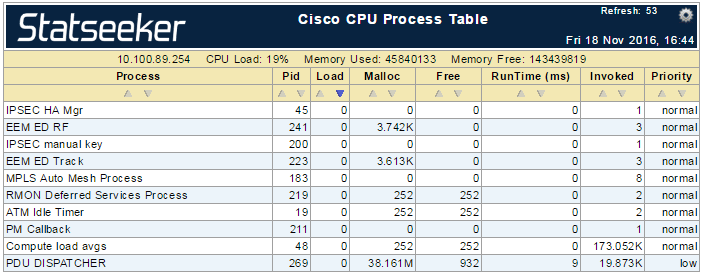
Network Device: Cisco Process Table
The Network Device: Cisco Process Table report returns a list of devices with drill-downs to a Cisco CPU Process Table report for each.
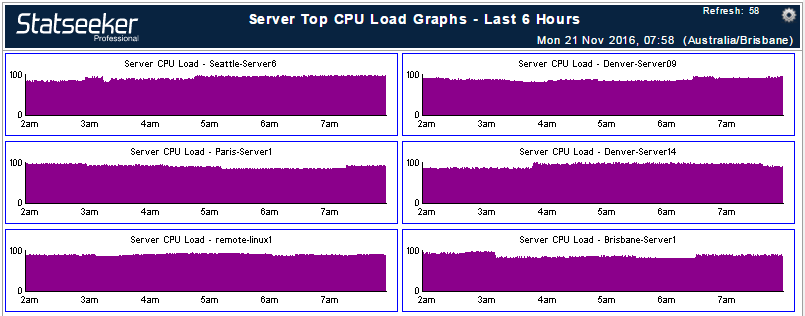
Server: Top CPU Load Graphs
The Server: Top CPU Load Graphs report is a graphical representation of the top 50 servers registering the highest CPU loads over the last 6 hours. Each graph is a link to a more detailed CPU load report for the selected device.
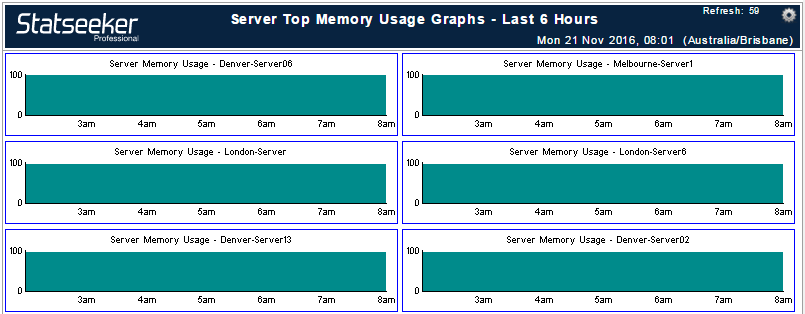
Server: Top Memory Usage Graphs
The Server: Top Memory Usage Graphs report is a graphical representation of the top 50 servers registering the highest memory usage over the last 6 hours. Each graph is a link to a more detailed server memory usage report for the selected device.
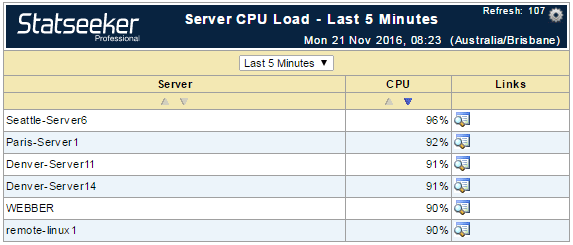
Server: CPU Load
The Server: CPU Load report returns the CPU load for the server/s or group/s selected. The report defaults to the last 5 minutes, and this reporting period can be edited from within the report. The report offers drill-downs to a detailed CPU Load report for the selected server and the Device Viewer.
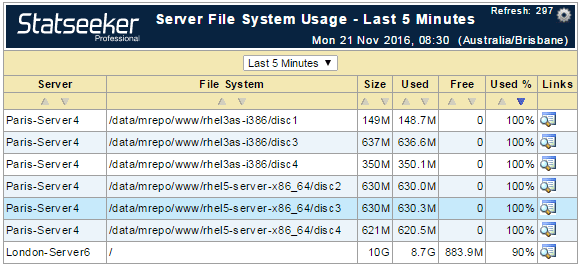
Server: File System Usage
The Server: File System Usage report returns the file system usage for the server/s or group/s selected. The report defaults to the last 5 minutes, and this reporting period can be edited from within the report. The report offers drill-downs to a detailed file system usage report for the selected server and the Device Viewer.
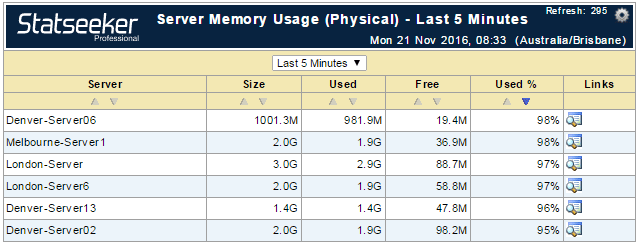
Server: Memory Usage (Physical)
The Server: Memory Usage (Physical) report details the physical memory usage for the server/s or group/s selected. The report defaults to the last 5 minutes, and this reporting period can be edited from within the report. The report offers drill-downs to a detailed memory usage report for the selected server and the Device Viewer.
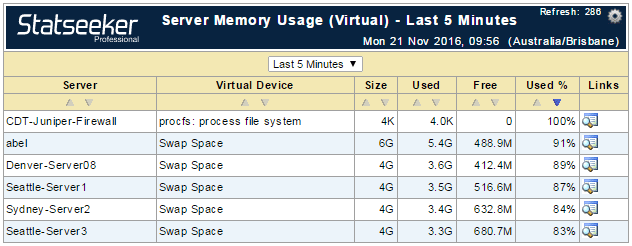
Server: Memory Usage (Virtual)
The Server: Memory Usage (Virtual) report details the virtual memory usage for the server/s or group/s selected. The report defaults to the last 5 minutes, and this reporting period can be edited from within the report. The report offers drill-downs to a detailed memory usage report for the selected server and the Device Viewer.
Events: Syslog
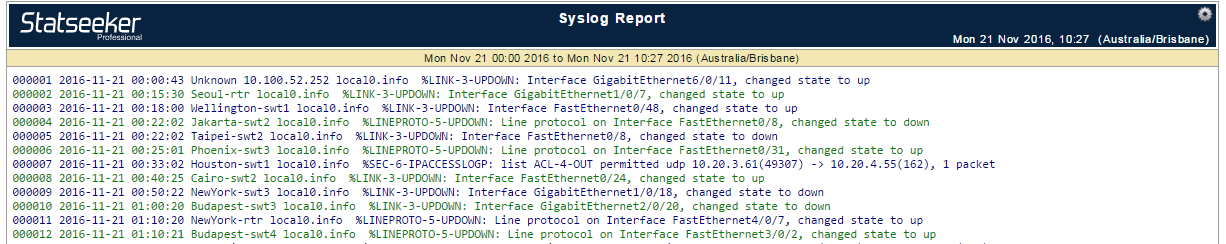
This report requires a time filter prior to running. If you are reviewing the syslog for messages regarding a certain device or event, then, due to the potential size of the log file, it is advised that you also supply a string in the Text Filter to focus the results.
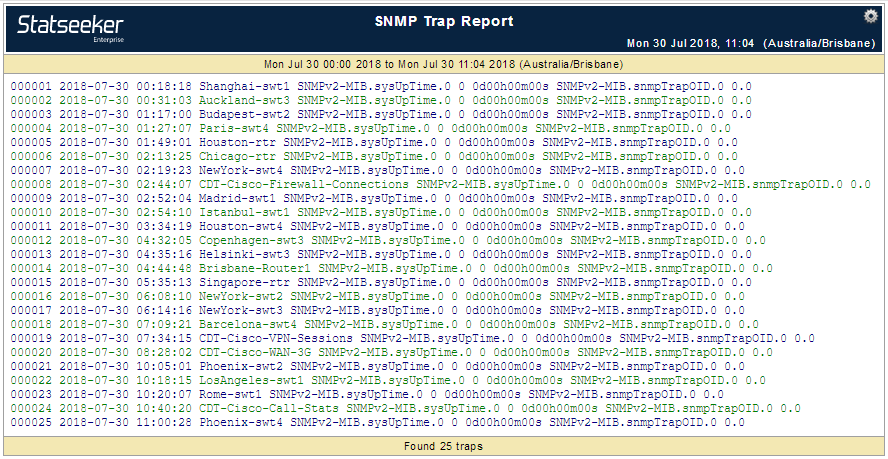
Events: SNMP Traps
This report requires a time filter prior to running.
Events: Device Events
The Events: Device Events report details the events (such as ping state changes) recorded for the devices selected. The report provides a link to the Device Viewer and an option to record a note in references to the reported event.
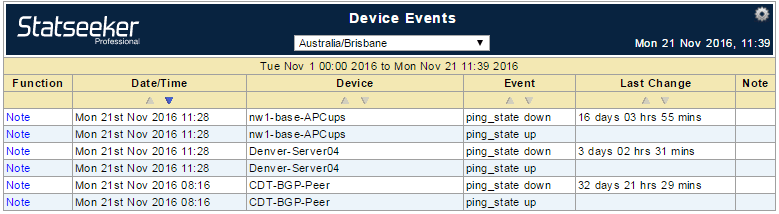
This report requires a time filter to be set prior to running.
Events: Interface Events
The Events: Interface Events report details the events (such as ifOperStatus state changes) recorded for the interface selected. The report provides a link to the Device Viewer and an option to record a note in references to the reported event.
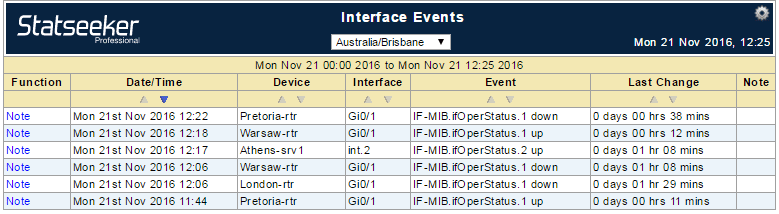
This report requires a time filter to be set prior to running.
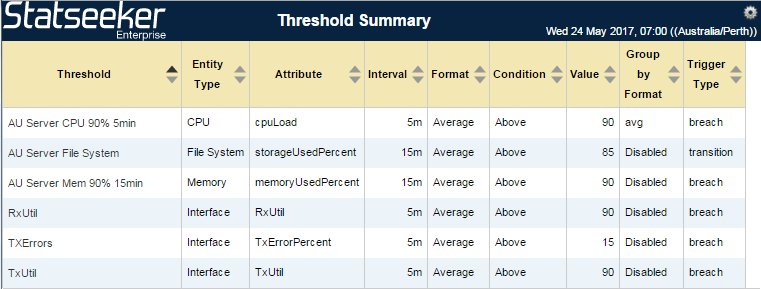
Thresholds: Threshold Summary
This report is available once a threshold has been set.The Thresholds: Threshold Summary report details the thresholds that have been set for the network. The report provides links to the Threshold Report for the selected threshold.
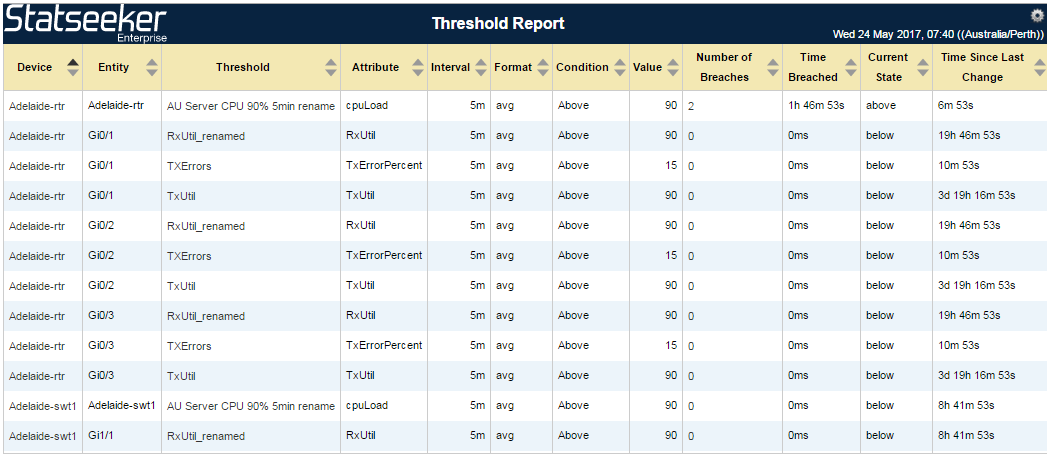
Thresholds: Threshold Report
This report is available once a threshold has been set.The Thresholds: Threshold Report details the threshold breaches recorded by Statseeker per device\entity and threshold combination. The report provides insight into the number of breaches per combination, the total time in breach and the current state of the device\entity with respect to that threshold. The report provides links to the Device Viewer, the Threshold Report, filtered for the selected threshold and the Threshold Event Report for each breach.
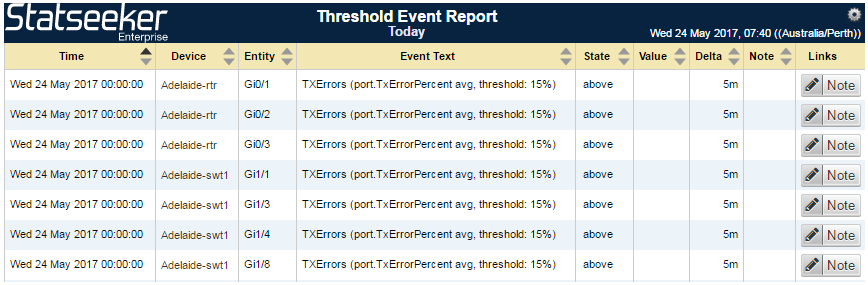
Thresholds: Threshold Event Report
This report is available once a threshold has been set.The Thresholds: Threshold Event Report details each threshold breach recorded by Statseeker. The report provides links to the Device Viewer, and the ability to record a note\comment against each breach for future reference.
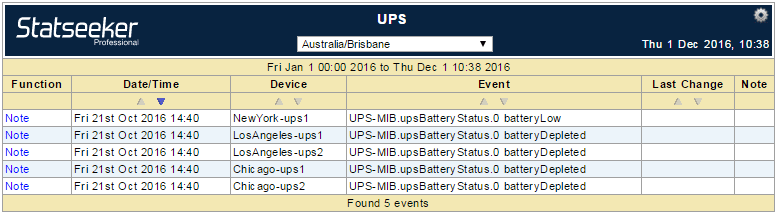
UPS/APC: Events
The UPS/APC: Events report details UPS/APC related events, such as reported changes in battery level, for the specified time period. The report provides the ability to assign a note to the event for future reference and drill-downs to the Device Viewer.
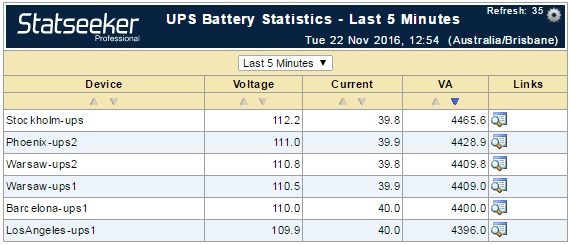
UPS/APC: Battery
The UPS/APC: Battery report presents UPS voltage, current and voltage-amps for the selected devices and offers drill-downs to a detailed UPS Battery report and the Device Viewer.
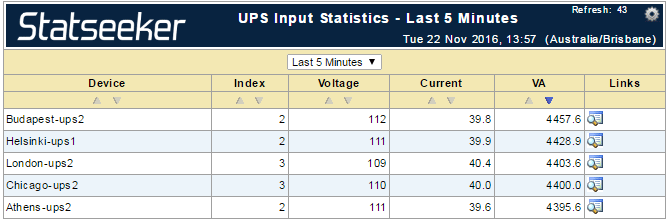
UPS/APC: Input
The UPS/APC: Input report presents input voltage, current and voltage-amps for the selected devices and offers drill-downs to a detailed UPS Input report and the Device Viewer.
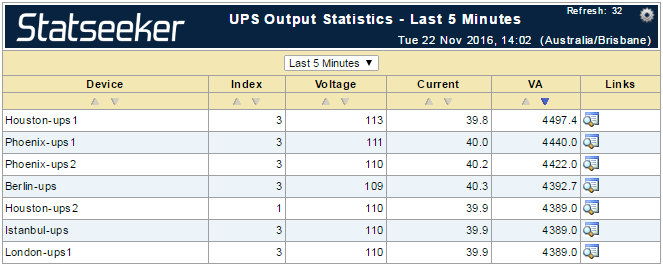
UPS/APC: Output
The UPS/APC: Output report presents output voltage, current and voltage-amps for the selected devices and offers drill-downs to a detailed UPS Output report and the Device Viewer.
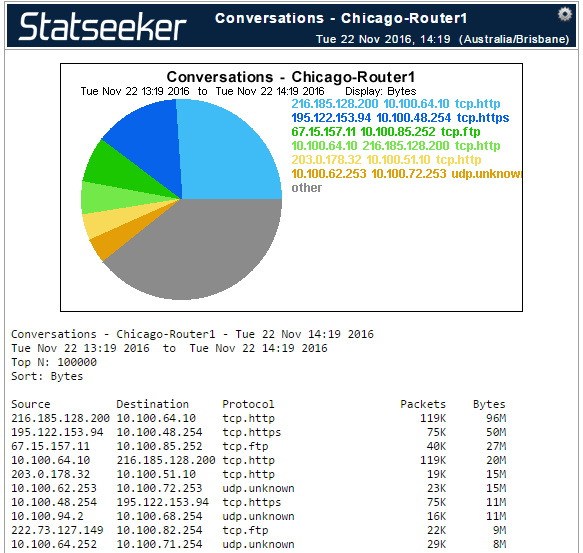
General: Traffic Analyzer
The General: Traffic Analyzer launches the Traffic Analyzer interface.
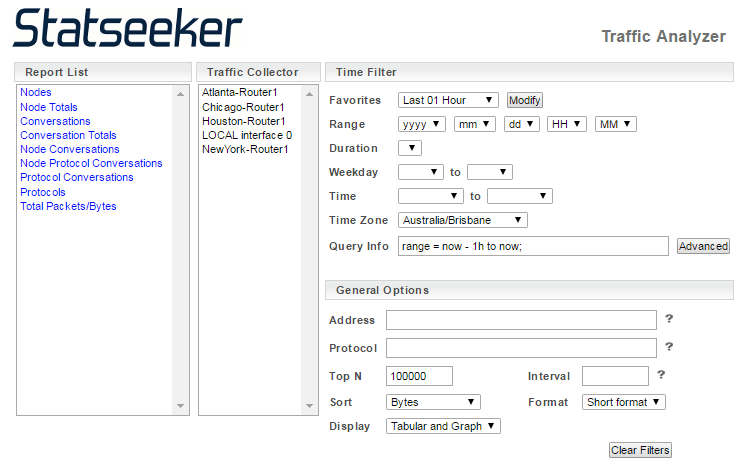
From here you can run netflow-centric reports against any device that has been configured as a netflow traffic collector.
This report requires that at least one device on your network is currently configured as a netflow traffic collector.
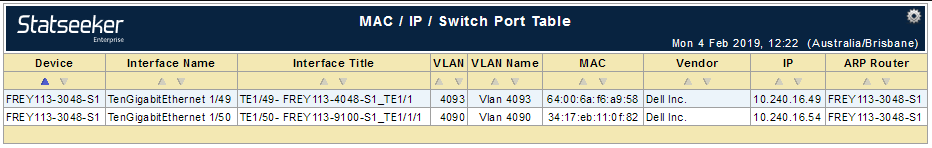
General: MAC / IP / Switch Port
General: MAC / IP / Switch Port report collects and presents the switch port tables for your network. The report offers drill-downs to the Device Viewer, and the Statistics report.
General: Custom Data Details
This report returns details on all devices associated with a custom data type package that has been added to your Statseeker installation, and allows you to modify your current CDT entity configuration . For more information on these packages, see Custom Data Types.
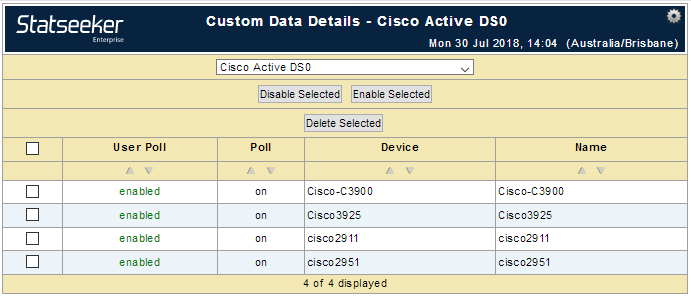
This report requires that a custom data package be installed and devices, associated with that package, be discovered on your network.
The User Poll field reflects the default polling state for the given entity, which is configured in the Admin Tool > Custom Data Ranges. The Disable and Delete options allow you to override this default polling behavior on a per device level. Any configuration changes applied via this report are applied during the next Statseeker Configuration Database build, a background process which occurs every few minutes.
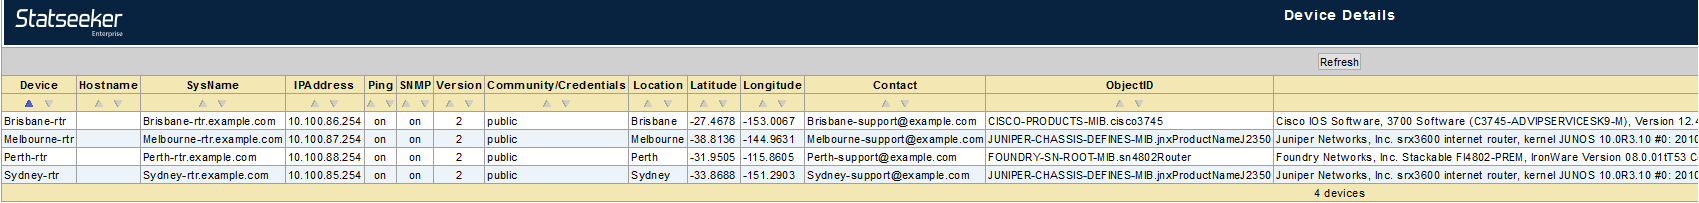
General: Device Details
The General: Device Details report presents configuration details on the selected device/s and provides the ability to:
- Toggle both ping and SNMP polling
- Rename the device: edit Device, Hostname or IPAddress, changes will be propagated on next config build (every few minutes)
- Reconfigure the devices SNMP credentials
- Add latitude and longitude details to the device record
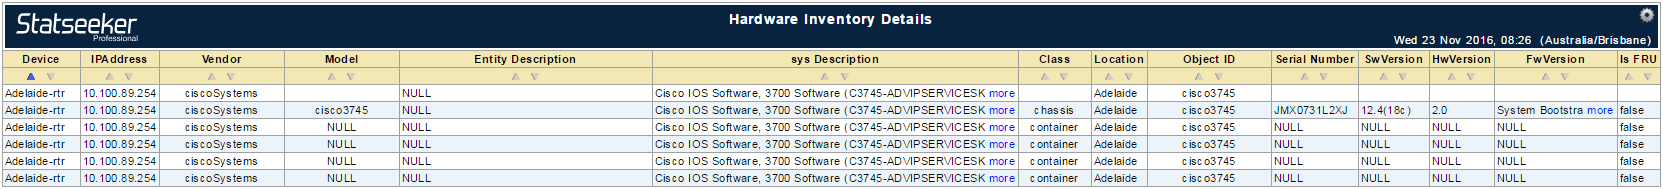
General: Device Hardware Inventory
The General: Device Hardware Inventory report offers inventory details for the selected devices. These details include:
- Vendor, model and serial number
- Location
- Software, hardware and firmware versions
The report also offers links to the Device Viewer for the selected device.
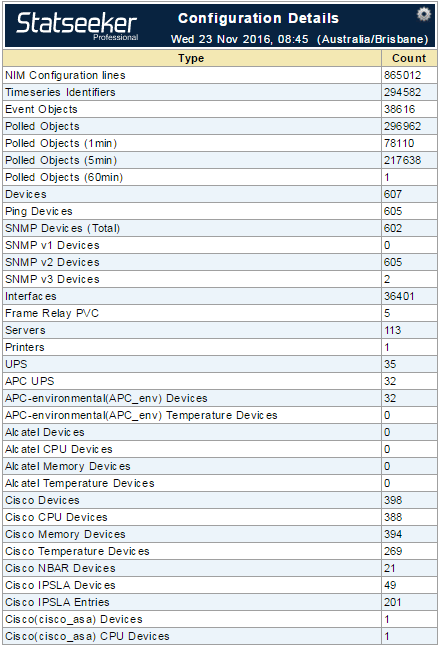
General: Configuration Details
The General: Configuration Details report provides details on your Statseeker installation, including a breakdown of the devices, counts of polled devices and interfaces and details on file system usage by the installation.
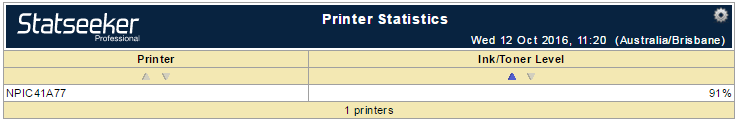
General: Printers
The Printers report is a tabular report returning ink/toner level. It is sorted by ink/toner level (ascending) to bring those devices requiring more immediate attention to the top of the list.Selecting the printer name will open a Device Viewer report for that device.
Custom Reports
In addition to both the stock reports and the Advanced Reporting Tool, Statseeker offers an extensive range of custom reports targeting specialist functionality, and a wide range of manufacturer-specific network devices and device configurations.
All of these custom reports are available from the NIM Console Report List, and can be added to dashboards, included in summary reports (See Embedded Reports), and have automated emailing schedules applied. For details on creating and editing custom reports see Statseeker Custom Reporting.
These custom reports (and any that you create and flag as available from the NIM Console) are automatically grouped according to the report data type and located at the bottom of the Report List in the NIM Console. By default, Statseeker hides from the NIM Console (they are always available from the Custom Reporting Console) those reports which don’t apply to any devices currently being monitored on your network. As Statseeker discovers these devices, the corresponding custom reports are displayed in the NIM Console.
- Select Administration Tool > Network Discovery / Advanced Options > Advanced Options
- Scroll down to the Reports section and set Report Hiding to Off
- Click Save
- Return to the NIM Console and refresh the page
As of Statseeker v5.4, there were over 150 of these additional custom reports bundled in a default Statseeker installation, covering a range of functionality and devices including:
- Application Service reports for Juniper devices
- Custom Asset Registry reports
- Device Health Reports including specialized Cisco TCAM reports
- Environmental Monitoring Equipment reports for APC, Geist and Interseptor
- Manufacturer-specific firewall reports for Checkpoint, Cisco, F5, Fortinet, Juniper and Palo Alto devices
- A wide range of custom IP interface statistics reports including specialized reports for Etherlike and Apcon devices
- Specialized F5 Load Balancer reports
- A wide range of Cisco Class-Based and Port Quality of Service (QoS) reports
- Topology reports
- Custom VPN reports for F5 APM and Cisco VPN, IPSEC and SCV
- Custom Voice and Call reports
- Specialized Riverbed WAN, Cisco 3G/4G WAN, and Ubiquiti AirMax, Radio, and Wireless reports