
Index
Overview
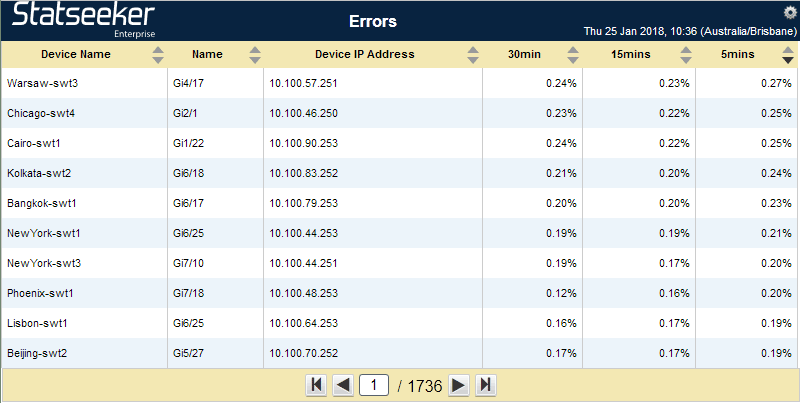
This custom report will look at interfaces reporting a high number of errors, and whether that error rate is increasing/decreasing over time.
Report Configuration
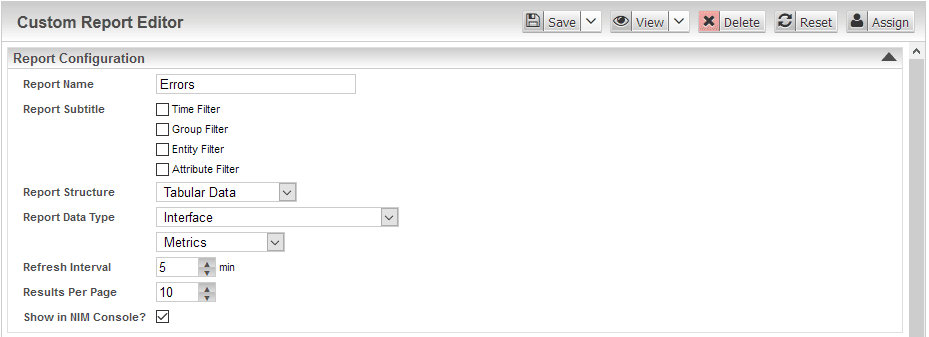
- Data Type: Interface Metrics
- Refresh: 5mins
- Results: 10, just show me the top ten on the first page
Filters
In this report we are looking at the entire network, and we will be applying a few metric-specific time filters (no global time filter for the report) so there are no filters being applied.
If you want to restrict the report to a subnet, or select group of devices, within your network, then you can apply a group filter, or an attribute filter restricting by IP range.
Fields
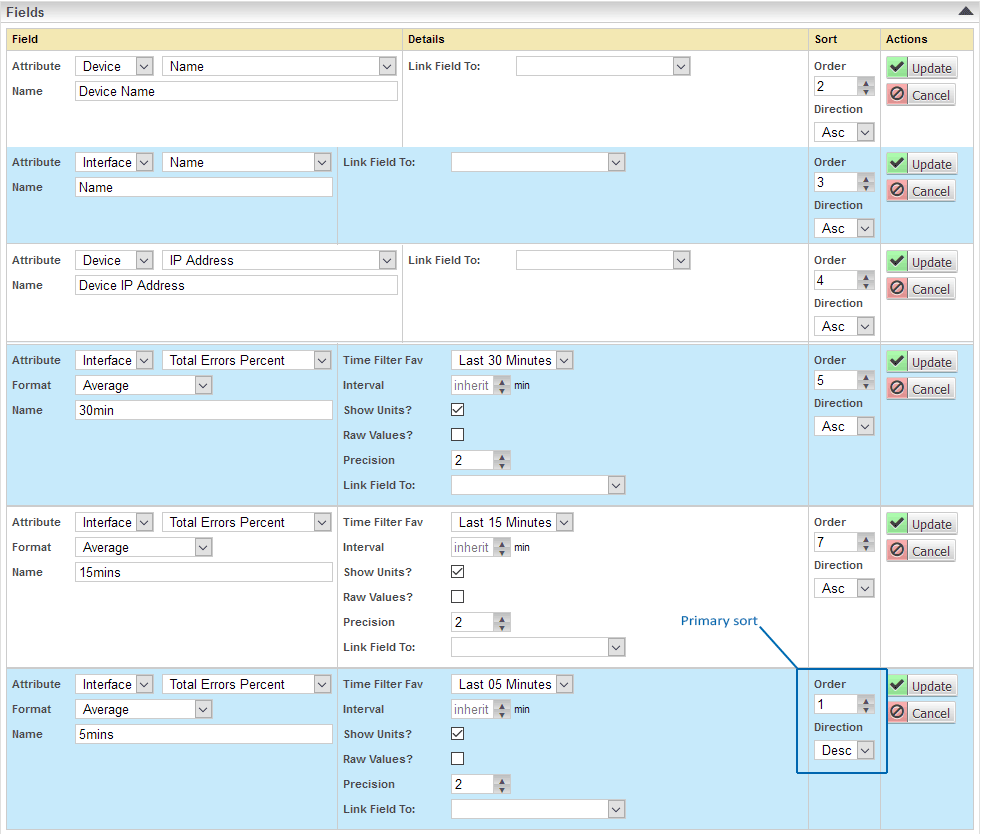
The first 3 are just to identify the device/interface reporting the errors:
- Device Name
- Interface Name
- Device IP Address
Now we add columns for the errors. In this example I used Interface Errors Percent, you can use Errors for a straight count if that’s better, and in the same manner you could use Discards or Discards Percent to look at dropped packets.
Because I am using Errors Percent, I have selected Format = Average and have added 3 columns, all reporting Errors Percent, but with different time filters applied. So, we are reporting on the average Errors over the last 30 minutes, 15 minutes, and 5 minutes. In this way you can see if the error rate is increasing or decreasing.
I have also selected the ‘last 5 minutes’ column as the primary sort for the report, ensuring that those interfaces reporting the highest Error Percentage over the last 5 minutes are pushed to the top of the report.
Options
Alternate Time Filters
An alternate method of displaying changes in error rates would be to set the time filters to report 15 minute blocks, essentially a bar chart in tabular form, but unlike a bar chart, you can report on multiple interfaces clearly. To do this you need to adjust the time filter in the columns to use a custom range, rather than just selecting “last N minutes” from the favorites list.
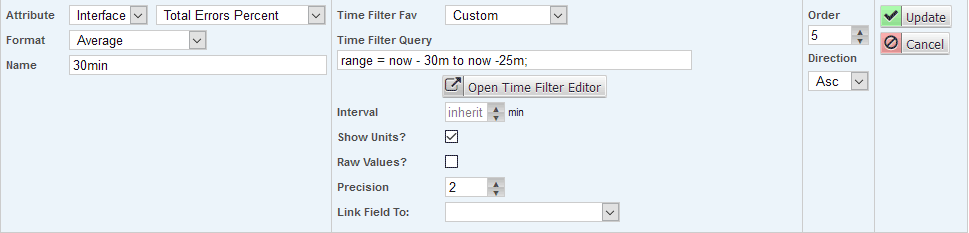
Apply the same custom time filter style to the other columns:
- range = now – 25m to now – 20m
- range = now – 20m to now – 15m
- range = now – 15m to now – 10m
- etc.
Each column displays a 5minute average so you clearly see if the error rate is decreasing/increasing.
Additional Metrics
Other options include:
- Breaking the errors columns down to Rx/Tx Errors
- Adding columns for device CPU load, memory load, and temperature
Drill-downs
Typical drill-downs for this report would be:
- Device name and IP to the device viewer
- Interface name to the Interface Statistics report
- The error columns through to Interfaces > Errors