Index
Overview
Statseeker is committed to providing both a product, and a website, that is accessible to the widest possible audience, regardless of technology or ability. We are actively working to increase the accessibility and usability of both, and in doing so, adhere to many of the available standards and guidelines.
Statseeker features a range of options that can be utilized to improve the overall accessibility of the product, these options being configured via the Statseeker product itself, or via the operating system being and web browser being used to display the Statseeker web interface.
Operating System (OS) & Web Browser Accessibility Options
Statseeker offers a web-based user interface (UI) for interacting with the server's monitoring, reporting, and alerting services. The web UI enables users to take advantage of the accessibility options provided by both the host operating system and the browser. These options typically encompass:
- Font style and size
- Background, font, and link colors
- Magnifiers
- On-screen keyboards
- Screen readers
The Statseeker web UI is displayed by the user's web browser, so the degree to which Statseeker adheres to OS level accessibility options is largely dictated by the combination of browser and OS being used.
When using modern, major browsers (Chrome, Firefox, Edge, etc.), Statseeker obeys all OS level accessibility requirements on modern Windows and iOS distributions, as well as major and Unix\Linux distributions.
When utilizing older browsers, older OS distributions, or highly customized Unix\Linux flavors, the degree to which the Statseeker web UI adheres to OS level accessibility settings depends entirely on the combination of OS and browser.
Note: due to the large amount of purely graphical content presented by Statseeker's core 'out-of-the-box' functionality, the use of screen readers, while supported, will be of limited benefit in many instances. These limitations can be largely bypassed via the use of the Reports panel to provide tabular alternatives to default graph/chart based reports.
- For more information on the Reports panel, see Custom Reports
- Contact Customer Services for access to training videos, and individually tailored seminars
Custom Report Options
The Reports panel allows you to create customized reports to suit your specific requirements, and this includes modifying some default properties of reports to enhance accessibility. While the OS and browser level options apply to all tabular reports, the content of graphical/chart based reports is handled by a separate graphing library which manages the appearance of the report content.
The colors used to represent the data points in graphs created through Custom Reporting can be edited to suit your requirements from within the report configuration. To edit the existing graph colors:
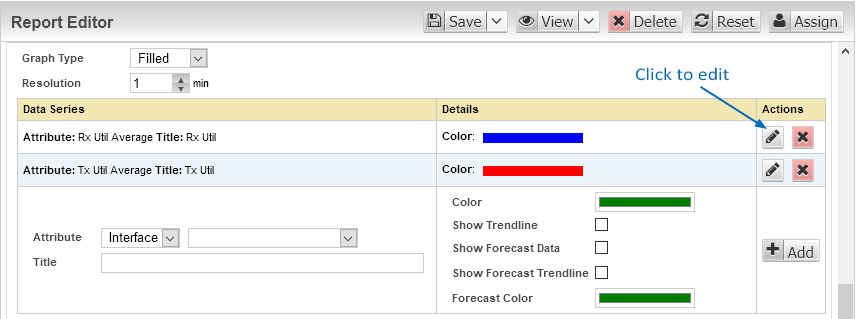
- Open the custom report in edit mode
- Click the Edit button associated with the data series
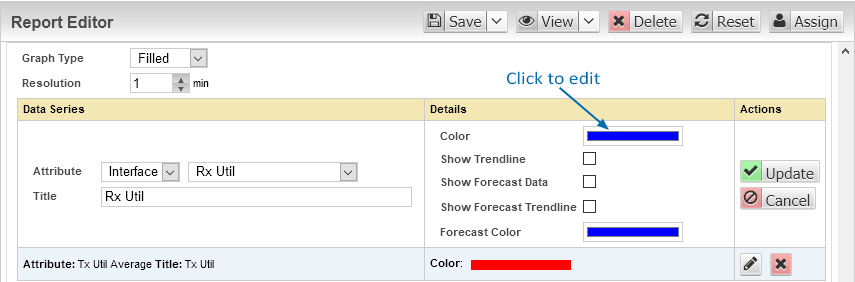
- Click the current color selection to edit it
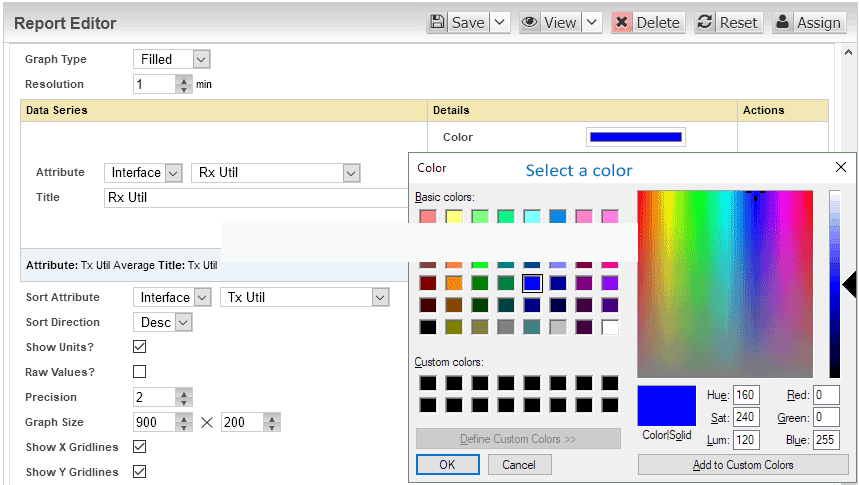
- Select a new color
- Click Update to apply the change
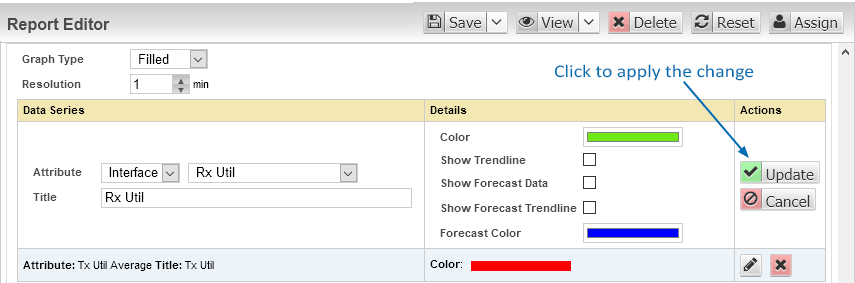
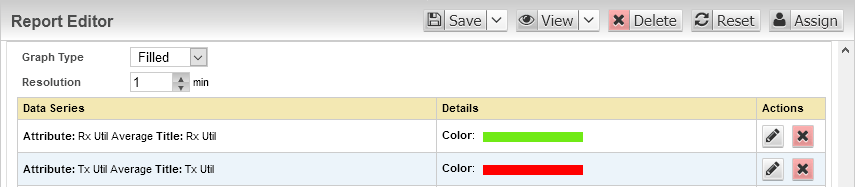
- Save the report