Index
- Overview
- Current Unreachable Report – details all unreachable devices
- Network Summary Dashboard – count of down devices and device down events
Overview
A default Statseeker installation contains a couple of ways to view details on currently unavailable devices. In addition, custom reports, dashboards, and alerts can quickly and easily be configured to suit your requirements.
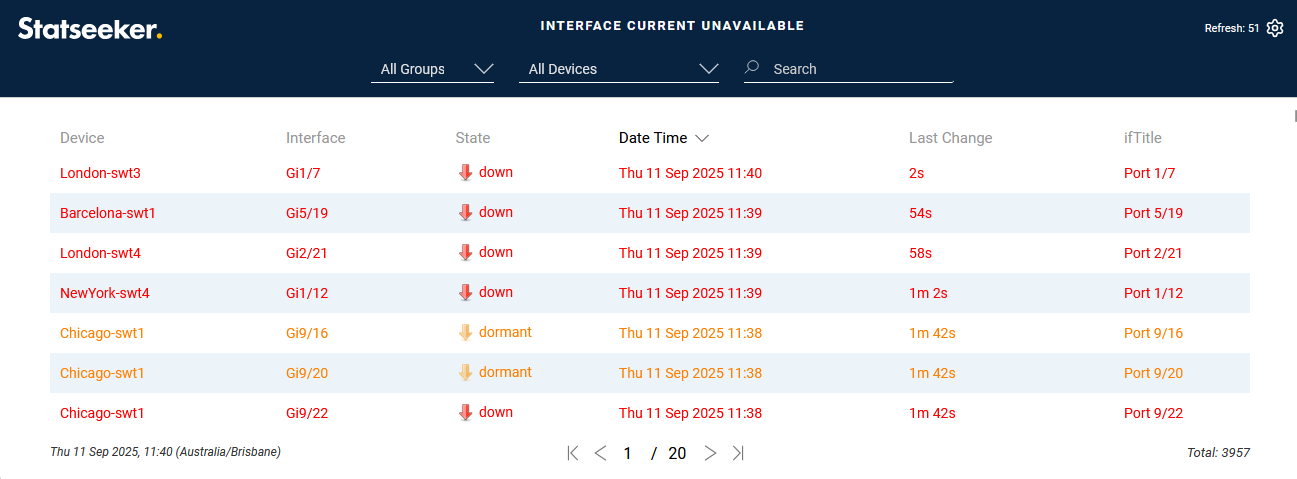
Current Unreachable Report
The Current Unreachable report details all devices that are currently considered down/unreachable. By default, Statseeker will ping every monitored device every 15s. If a device does not respond to 4 consecutive ping requests, then it is flagged as “unreachable” until it responds to a ping request. This report details:
- Device name and IP address
- The ping state (down), the duration in that state, and the time that the ping state last changed
- Device location and the contact details for the person/team responsible for managing the device
The report also offers drilldowns to the Device Viewer and a Ping Outages report, filtered to the selected device.
To view this report for your entire network:
- Select All Groups or All Devices in the Console
- From the report list select Ping > Current Unreachable – you can type part of the report name in search field above the report list to filter the list
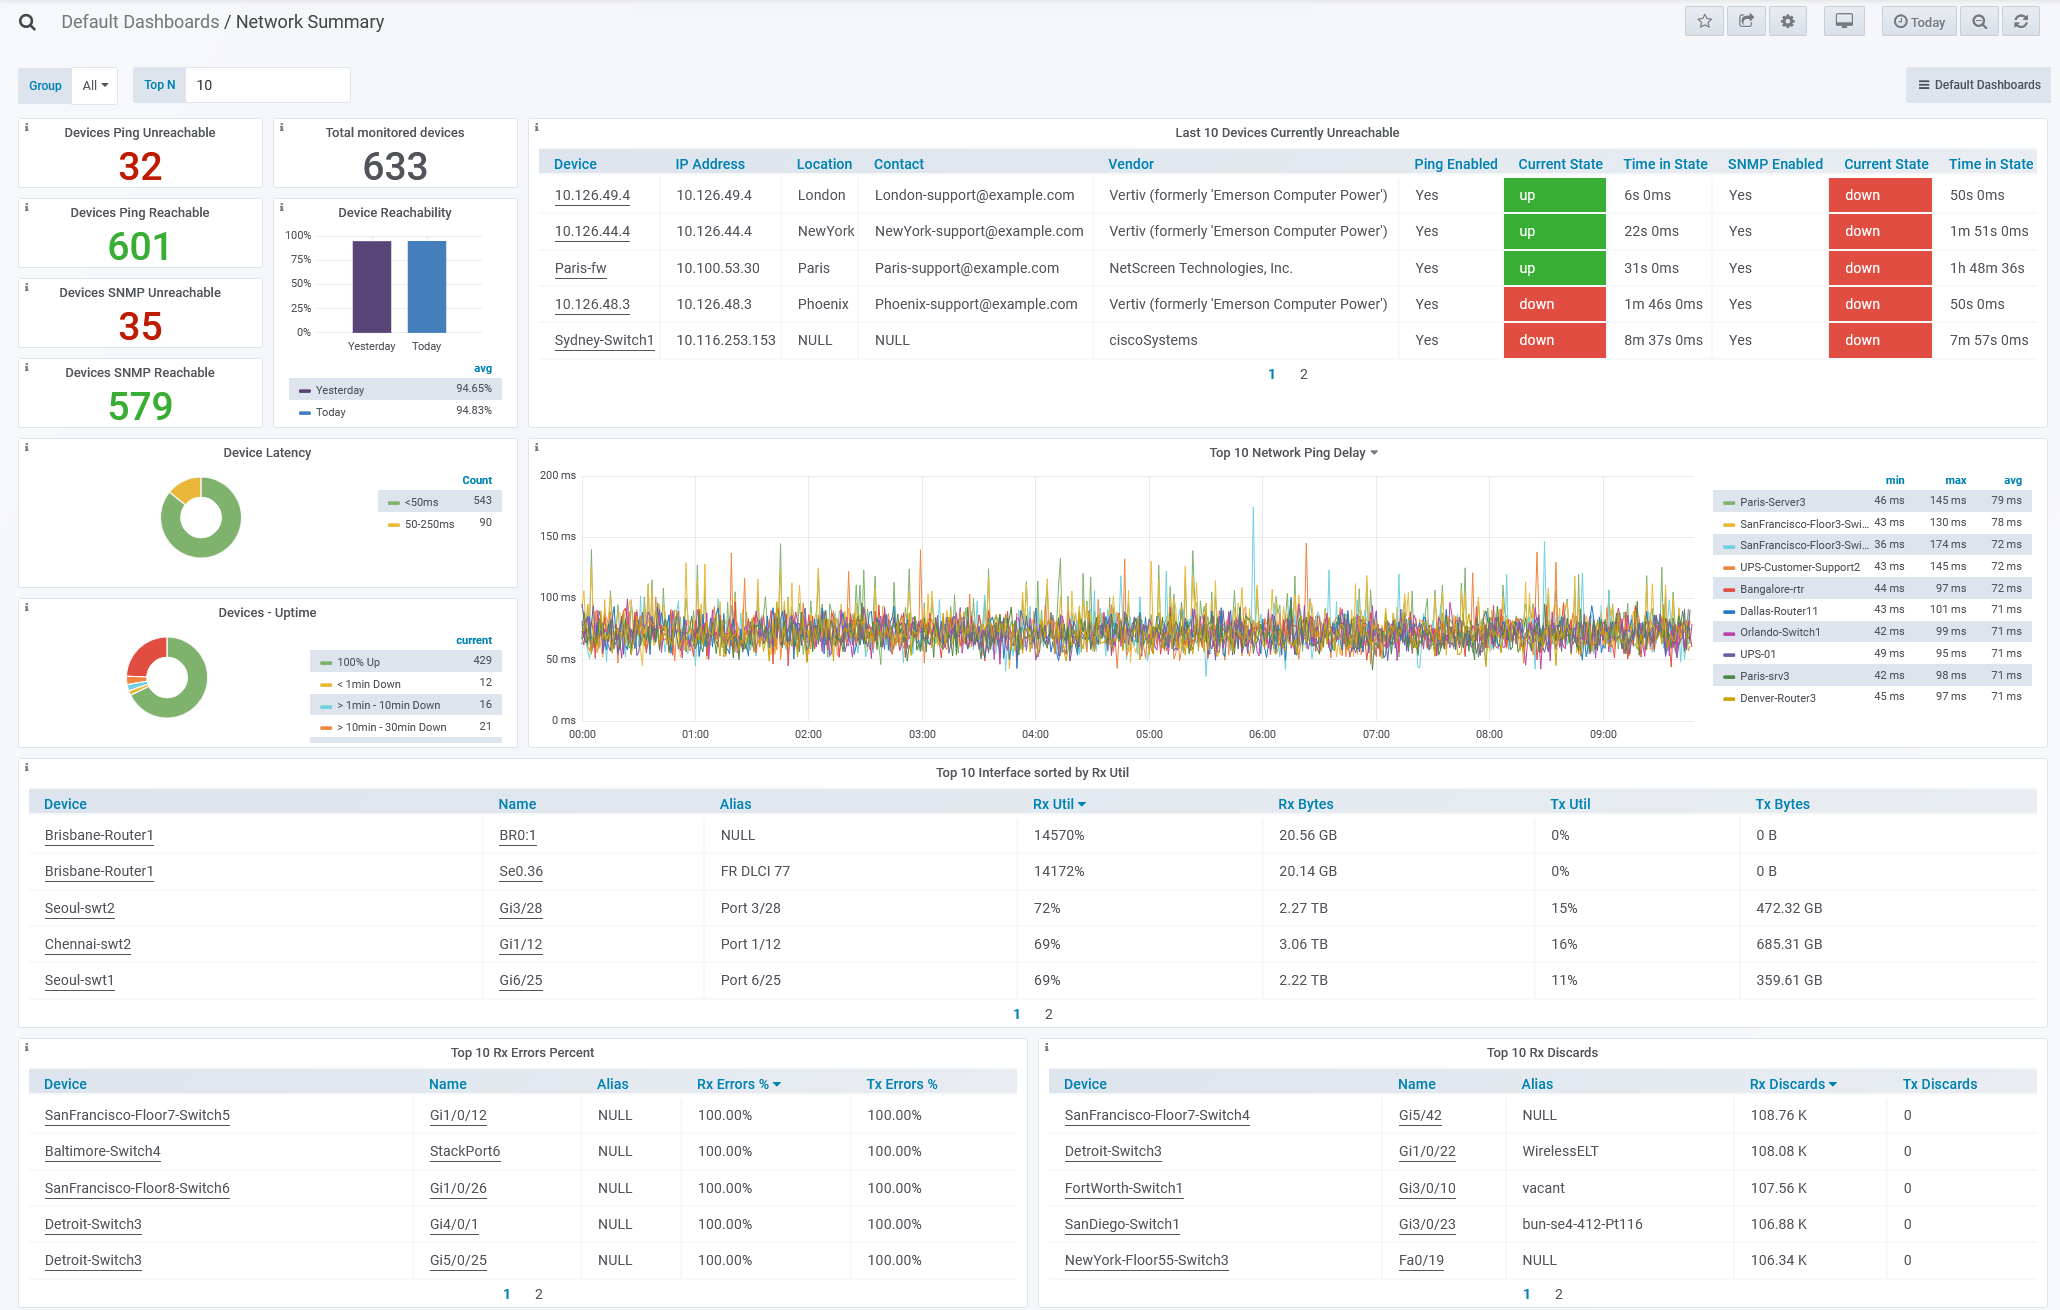
Network Summary Dashboard
Every Statseeker installation includes a number of default dashboards, one of these, the Network Summary, contains counts of available/unavailable devices as details on ‘down’ device events. The available/unavailable device counts include a drilldown to basic ping up/down reports
The Last N Devices Currently Unavailable panels provides details on the down device events and offers a drilldown to the Device Overview dashboard. The number of records displayed can be altered by setting the Top N variable in the top-left of the dashboard.
To view the dashboard:
- Select Dashboards > Manage Dashboards in the main navigator
- Select Default Dashboards > Network Summary