Index
- Overview
- Threshold Levels
- Configuring a Threshold
- Monitoring Threshold Configurations
- Managing Threshold Data
- Editing a Threshold
- Enabling/Disabling Thresholds
- Cloning a Threshold
- Deleting Thresholds
- Using Thresholds to Trigger Alerts
Overview
Thresholds are used to record instances of notable events occurring within your network and, optionally, to trigger automated alerts advising you of such events. Statseeker allows you to configure thresholds against:
- Any and every metric collected by Statseeker
- Both raw and calculated values (averages, standard deviations, 95th percentile, rates of change, etc.)
- Interpretive values such as anomaly strength
- Not just recorded, but also predicted values using trendlines and forecasted data based on your specific device and environment data history
Thresholds events are recorded when all conditions specified in the threshold configuration are met, and each time those conditions are met.
- Administration Tool > Network Discovery - Advanced Options > Advanced Options > History > Keep Threshold Event History For
Example:
A threshold has been configured for when Tx Utilization, of greater than 95%, occurs over a 10-minute interval.
- An event is not recorded when interface utilization passes 95%
- An event is recorded when the average interface utilization for the last 10 minutes exceeds 95%
- If the average interface utilization remains above 95% for a further 10 minutes, then another event will be recorded
Thresholds can be set so that an event is recorded while the metric is in breach of threshold (as described above), or when it transitions from one 'state' to another. The states that Statseeker utilizes are:
- High: the monitored value is above that set threshold level
- Low: the monitored value is below that set threshold level
- Unknown: the monitored value cannot currently be determined because the device\interface is unreachable; typically, because it is offline or something upstream of the device\interface is offline
You can also use an Upstream Device Configuration to suppress alerts for unreachable downstream devices\interfaces, when an upstream device becomes unreachable.
Threshold Levels
It is important to tailor thresholds to your network environment. It is strongly advised that you analyze your network to identify the extent of usual activity, and use this information when setting thresholds, to prevent threshold events being recorded against activity which is typical for your network. When setting a threshold:
- Be selective when assigning the threshold, consider which metrics to threshold and on which devices/groups
- Review the history of that metric on those devices, and select a threshold that is outside of the observed typical behavior
- Be sure to set the Time Filter > Data Range parameter for the threshold to take into account the 'spiky' behavior often encountered with interface utilization and CPU and memory load. A very small data range can be responsible for generating an excessive number of threshold events.
- Note: in the absence of an explicitly set Time Filter > Data Range, the Interval acts as both the interval (how often to assess the threshold), and the Data Range (what data to evaluate when assessing the threshold)
- Remember to account for network changes, such as maintenance windows, with respect to alerts being generated from threshold events
Configuring a Threshold
To configure a new threshold:
- Select Administration Tool > Alerting / Event Management > Threshold Config
- Click Add
This will display the Threshold Configuration screen.
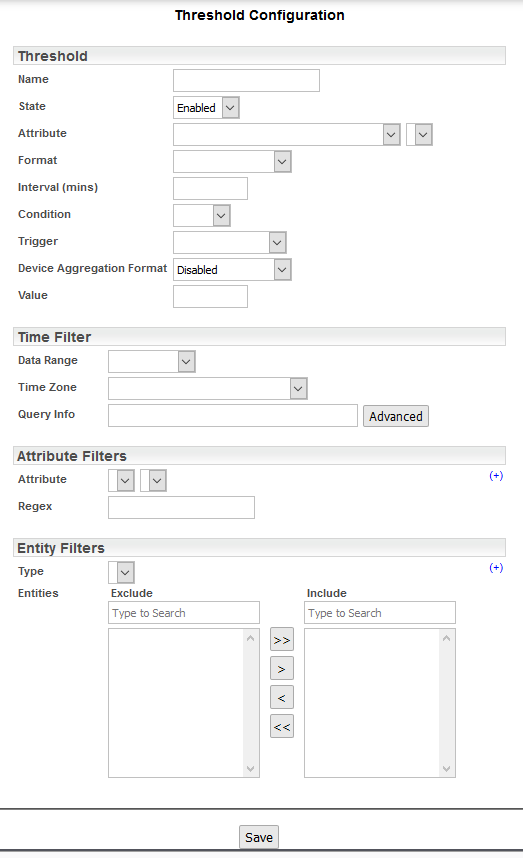
| Field | Required | Description | ||||||||||||||||||||||||||||||
| Name | The name of the threshold. This will be referenced by alerts and reports. | |||||||||||||||||||||||||||||||
| State | The state of the threshold:
|
|||||||||||||||||||||||||||||||
| Attribute | The metric that the threshold will be set against | |||||||||||||||||||||||||||||||
| Format | Data manipulation (Average, Total, Standard Deviation, 95th Percentile, etc.) applied to the metric
|
|||||||||||||||||||||||||||||||
| Baseline History | Timefilter specifying the scope of historical data used when calculating Baseline, Anomaly or Forecast values.Defaults to previous 6 months (range = now - 180d to now). | |||||||||||||||||||||||||||||||
| Interval (mins) | How often the threshold is checked.
Note: if a Time Filter is not set, then the Interval is used in its place. For example:
Every 5 minutes, the attribute average is calculated for the previous 5 minutes and compared to the threshold value. Compare this to the following where a time filter is set.
Every 5 minutes, the attribute average is calculated for the previous 10 minutes and compared to the threshold value. |
|||||||||||||||||||||||||||||||
| Condition | Threshold is in breach when the metric is Above or Below the threshold Value | |||||||||||||||||||||||||||||||
| Trigger |
|
|||||||||||||||||||||||||||||||
| Device Aggregation Format | Enable to combine data from a single device. Trigger alerts based on:
|
|||||||||||||||||||||||||||||||
| Value | The value that the monitored Attribute/Format combination is compared to for triggering an event | |||||||||||||||||||||||||||||||
| Time Filter | ||||||||||||||||||||||||||||||||
| The time filter settings allow you to set a data range to be used when calculating the Attribute/Format combination, the result will be compared against the threshold Value to determine if an event should be triggered. | ||||||||||||||||||||||||||||||||
| Data Range | Basic time filter options used to populate the time filter Query field.
Note: the Last option offers simple and flexible time range assignment.
|
|||||||||||||||||||||||||||||||
| Time Zone | The time-zone used when collecting data within the specified Data Range. If not specified, the server time zone will be used. | |||||||||||||||||||||||||||||||
| Query Info | The time filter query string that will be used for the threshold. The content of this field is automatically constructed based on the Data Range and Time Zone fields but can also be manually edited.
The Advanced button opens the Advanced Time Filter Editor. |
|||||||||||||||||||||||||||||||
| Attribute Filters | ||||||||||||||||||||||||||||||||
| The Attribute Filters allow you to limit the devices/interfaces that the threshold will apply to, based on an attribute of those devices/interfaces. Multiple filters may be applied by clicking the associated (+) button, and are combined in a logical AND fashion, i.e. all must be satisfied for the event to trigger. | ||||||||||||||||||||||||||||||||
| Attribute | The attribute to be used to filter devices for thresholding | |||||||||||||||||||||||||||||||
| Regex | The RegEx string used to match against attributes for filtering | |||||||||||||||||||||||||||||||
| Entity Filters | ||||||||||||||||||||||||||||||||
| The Entity Filters allow you to limit the devices/interfaces that the threshold will apply to, based on an attribute of those devices/interfaces. Multiple filters may be applied by clicking the associated (+) button, and are combined in a logical AND fashion, i.e. all must be satisfied for the event to trigger. Multiple group/device/interface selections within a single filter are combined in a logical OR fashion. | ||||||||||||||||||||||||||||||||
| Type | The type of entity, this selection will populate the Entities list | |||||||||||||||||||||||||||||||
| Entities | The Exclude and Include groups for entity selection | |||||||||||||||||||||||||||||||
- Enter a Name for the threshold
- Select the Attribute (metric) for the threshold using the drop-down lists provided
- Set all other fields in the Threshold section
- Optionally, set a Time Filter. If a time filter is not set, then the interval will be used instead.
- Optionally, set one or more Attribute Filters to refine the device\interface selection that the threshold applies to
- Optionally, set one or more Entity Filters to refine the device\interface selection that the threshold applies to
- Click Save when done
Once the threshold configuration has been saved, and if the threshold State = Enabled, activity satisfying the threshold requirements will generate threshold events. These generated events are logged and can be used to trigger alert functionality.
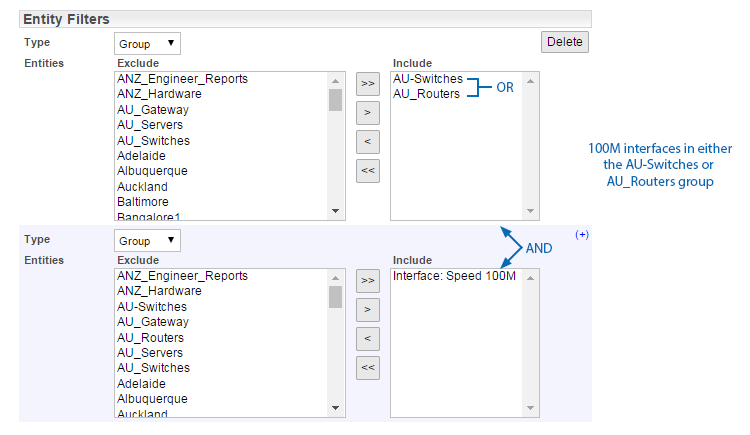
Entity Filter Combination
Multiple Entity filters may be applied by clicking the associated (+) button, and are combined in a logical AND fashion, i.e. all must be satisfied for the event to trigger. Multiple group/device/interface selections within a single filter are combined in a logical OR fashion.
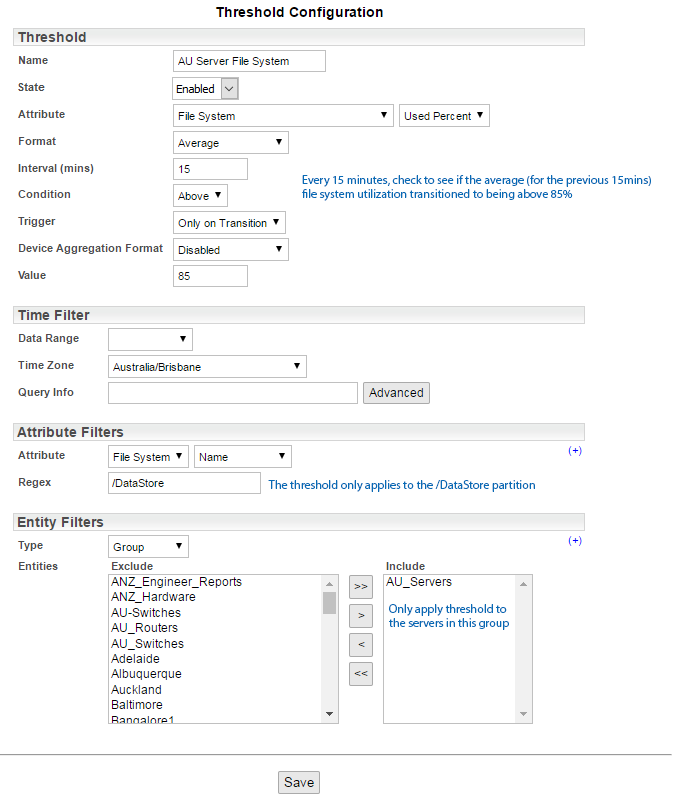
Example: Server File System Usage
The following is an example of a server file system threshold configuration.
- Every 15 minutes, check the average used percentage, for the previous 15 minutes, of the /DataStore partition, on servers in the AU_Servers group
- Trigger an event if this value transitioned to be above 85% (IE. do not trigger subsequent events if it remains above 85%)
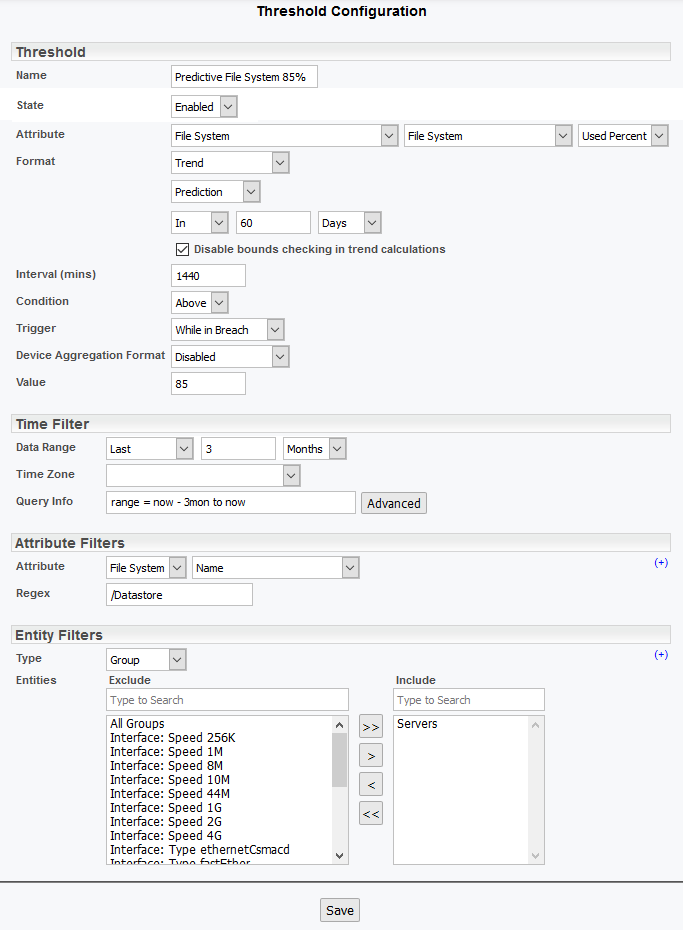
Example: Predictive File System Usage
The following is an example of a predictive threshold configuration. Predictive thresholds use your data history to predict the future shape of your data.
- Once a day, use the last 3 months data history of the file system to predict the used percentage at a point 60 days into the future, of the /DataStore partition, on servers in the Servers group
- Trigger an event if this value predicted to be above 85%
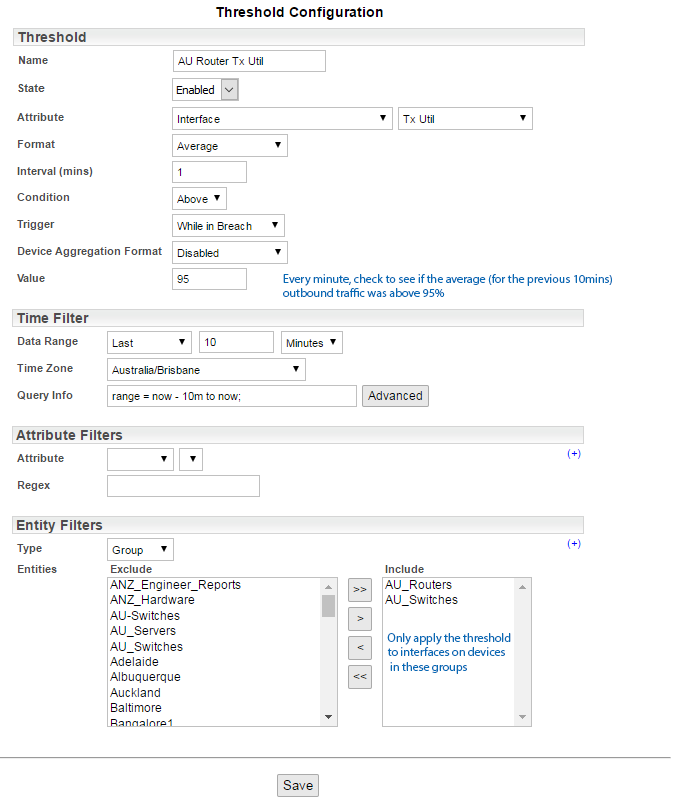
Example: Outbound Traffic Rolling Average
Every Minute, calculate the average Tx Utilization for all interfaces in the AU_Routers and AU_Switches groups, and trigger an alert if this average is greater than 95%.
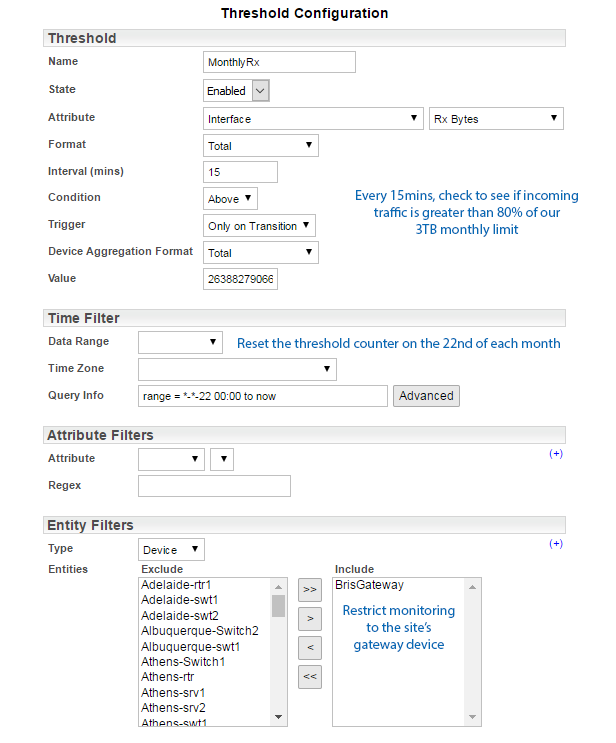
Example: Monthly Bandwidth Usage
Every 15 minutes, check the primary gateway router to see if incoming traffic is greater than 80% of the 3TB monthly limit for the site. Reset the traffic count on the 22nd of each month.
Monitoring Threshold Configurations
It is recommended that you monitor a newly configured threshold prior to configuring any alerts to be generated from the threshold. Too low a threshold can result in alert flooding, while too high a threshold can result in anomalous activity going unreported.
To review a threshold's performance for the week previous:
- Specify a time filter of Last Week
- Select Thresholds > Threshold Summary from the Report List
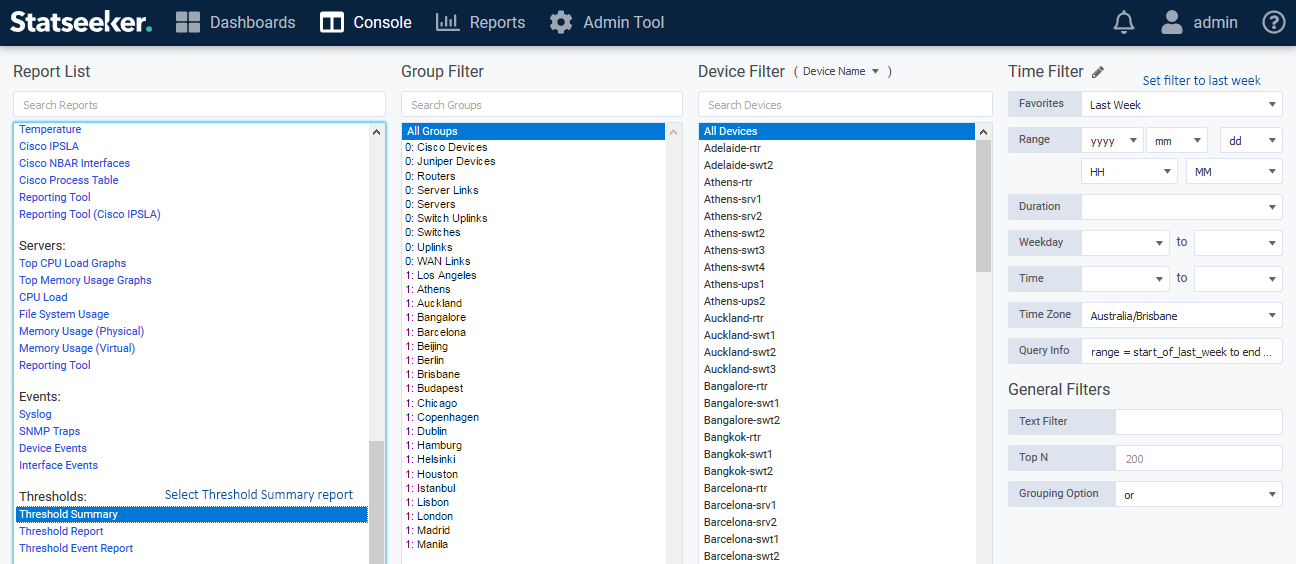
The summary report will detail each of the threshold configurations found on your server.
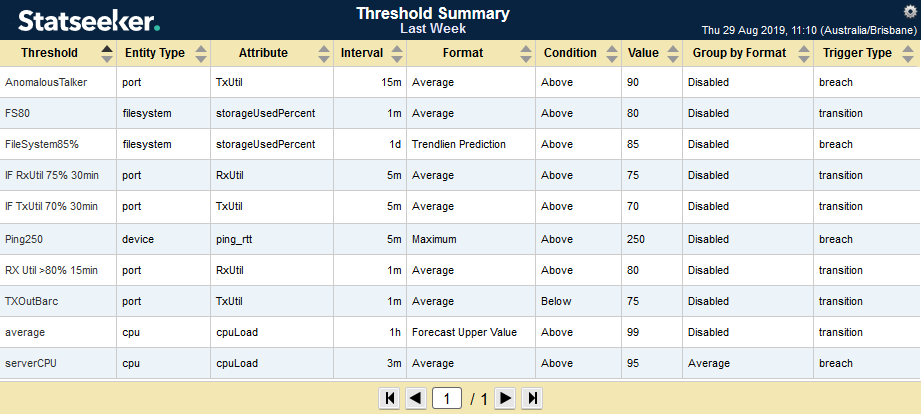
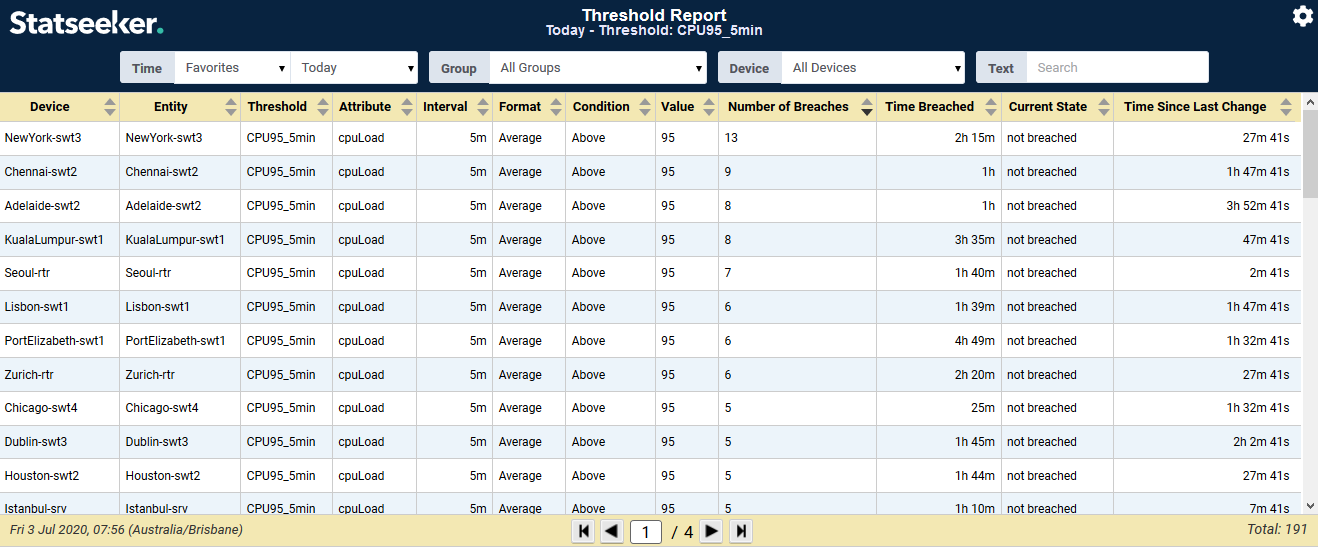
Selecting one of the threshold configurations will open the Threshold Report filtered by the selected threshold and the timefilter specified in the Console. The total number of generated events is an indicator of how appropriate the threshold level and interval are for your network activity.
Managing Threshold Data
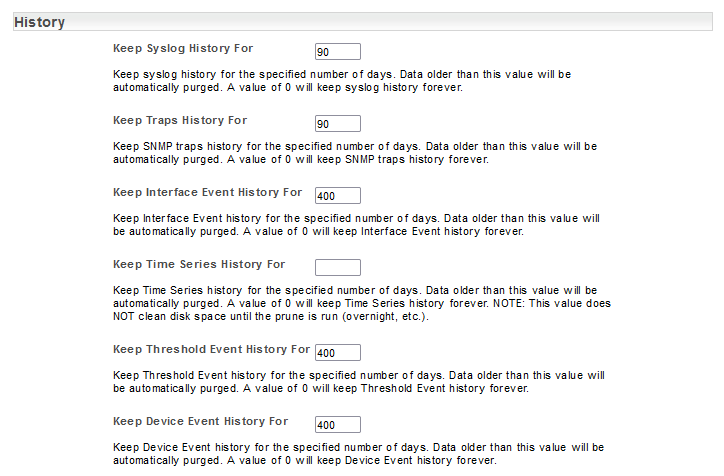
By default, Statseeker stores threshold event records for 400 days. This value can be altered as needed and threshold records can be kept indefinitely if required (set storage time to 0). To update the default value:
- Select Admin Tool > Network Discovery - Advanced Options > Advanced Options
- Under the History section, locate Keep Threshold Event History For and update as needed
- Click Save
Editing a Threshold
To edit an existing threshold configuration:
- Select Administration Tool > Alerting / Event Management > Threshold Config
- Select the configuration to be edited, the Search field above the threshold list accepts both standard strings and case-insensitive RegEx
The configuration panel will display the selected threshold configuration.
- Edit the configuration as required and click Save
Saving the configuration will restart the Statseeker thresholding monitoring engine, utilizing the latest configurations.
These fields are:
- Name
- Attribute
- Format
- Device Aggregation Format
- Value
Enabling/Disabling Thresholds
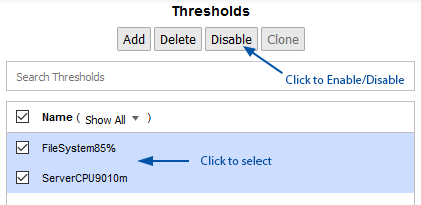
To enable/disable thresholds:
- Select Administration Tool > Alerting / Event Management > Threshold Config
- Click the threshold/s to select (the Search field is case-insensitive RegEx enabled) and click Enable/Disable
To enable/disable thresholds from within the rule configuration:
- Select Administration Tool > Alerting / Event Management > Threshold Config
- Click the threshold to select
- Set Status to On/Off as needed
- Click Save
Cloning a Threshold
To clone an existing threshold configuration:
- Select Administration Tool > Alerting / Event Management > Threshold Config
- Select the configuration to be cloned, the Search field above the threshold list accepts both standard strings and case-insensitive RegEx
- Click Clone
A new threshold configuration will be created, but not saved, amend the configuration as needed and be sure to save the threshold prior to leaving the configuration screen.
Deleting Thresholds
To delete an existing threshold configuration:
- Select Administration Tool > Alerting / Event Management > Threshold Config
- Select the configuration/s to be deleted and click Delete
- Confirm the action when prompted
This action will restart the Statseeker thresholding engine, utilizing the remaining configurations.
Using Thresholds to Trigger Alerts
Alerts can be triggered from recorded threshold events. To configure a threshold event alert:
- Select Administration Tool > Alerting / Event Management > Alerting
- Click Add
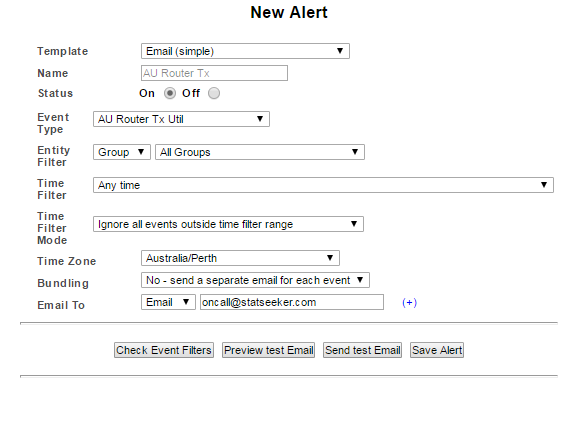
This will display the New Alert configuration screen.
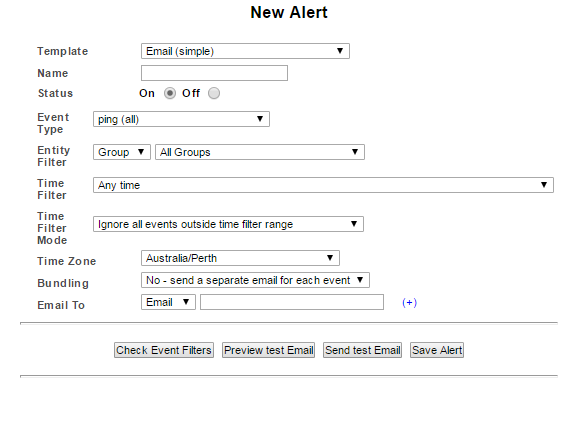
- Select an alert Template to suit your requirements
- Name the alert
- Set the alert status to On
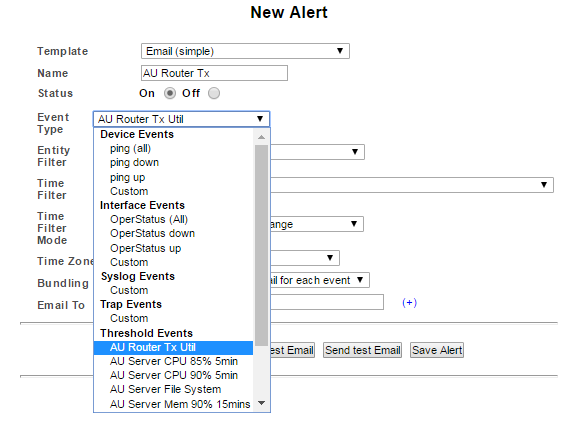
- Set Event Type to the required threshold event
- Set Entity and Time Filters if you want alerts triggered by a subset of the threshold event records
- Set the Time Filter Mode as required for the alert
- Configure the alert recipients
- Click Save Alert