
Index
- Overview
- Enable\Disable SNMP Polling
- Setting SNMP Polling Timeout
- Reporting on SNMP State Data
- Alerting on SNMP State Changes
Overview
Statseeker collects configuration and timeseries data from your network infrastructure via SNMP. Statseeker also monitors this infrastructure for its ability to respond to SNMP communications, presenting this information as the SNMP State. By default, if the Statseeker server fails to receive any SNMP response from a device for a 90-second period, then the device is considered ‘down’ with regard to SNMP communications.
SNMP State data is available in a number of default reports and dashboards, and can be used in custom dashboards and reports, as well as alert configurations.
SNMP States
The SNMP State for a device will be reported as one of the following:
- Unknown – there is an issue with SNMP polling the device, contact Statseeker Support
- Up – the device is responding to SNMP requests in an expected format
- Down – the device has not responded to any SNMP request for at least 90 seconds (configurable)
- Disabled – SNMP polling disabled for the device
- Poller_down – this state is not currently used by Statseeker, but will be relevant to functionality still in development
Enable\Disable SNMP Polling
SNMP polling is enabled for all devices by default during the Discovery with the exception of devices added via Ping-Only or Remote Ping-Only Discovery.
Once a device has been discovered, SNMP polling can be toggled (on/off) for devices on an individual or bulk basis via Manage Devices.
Setting SNMP Polling Timeout
By default, if a device fails to respond to all SNMP requests sent to the device in a 90s period, then the device is considered ‘down’ with regard to SNMP communications. The default 90s ‘timeout’ period can be modified as needed.
The syntax for the setting is ‘snmp_timeout_sec’ ‘{timeout_value_in_seconds}’ where {timeout_value_in_seconds} is an integer. This is an ‘advanced-user setting’ and as such there is no input validation performed – while there is no restriction on the value assigned here, any non-integer value or any integer value less than 60 is treated as 60.
- Select Administration > Network Discovery – Advanced Options > SNMP Config
- On a new line enter ‘snmp_timeout_sec’ ‘{timeout_value_in_seconds}’E.g. ‘snmp_timeout_sec’ ‘120’
This is a global setting and will apply to all devices SNMP-polled by the Statseeker server.
Reporting on SNMP State Data
Statseeker provides a number of pre-configured reports and dashboard panels containing SNMP State data.
SNMP State Reports
- General > SNMP Availability – SNMP availability SLA data using an ad-hoc timefilter
- General > SNMP Outages – event records for devices going entering\leaving an SNMP Down state
- Historical > Device Group SLA Availability for 13 Months – SNMP availability SLA data for all currently configured SLA configurations, aggregated by month for the previous 13 months (This report requires that you have at least 1 SLA configured, see SLA Reporting for details)
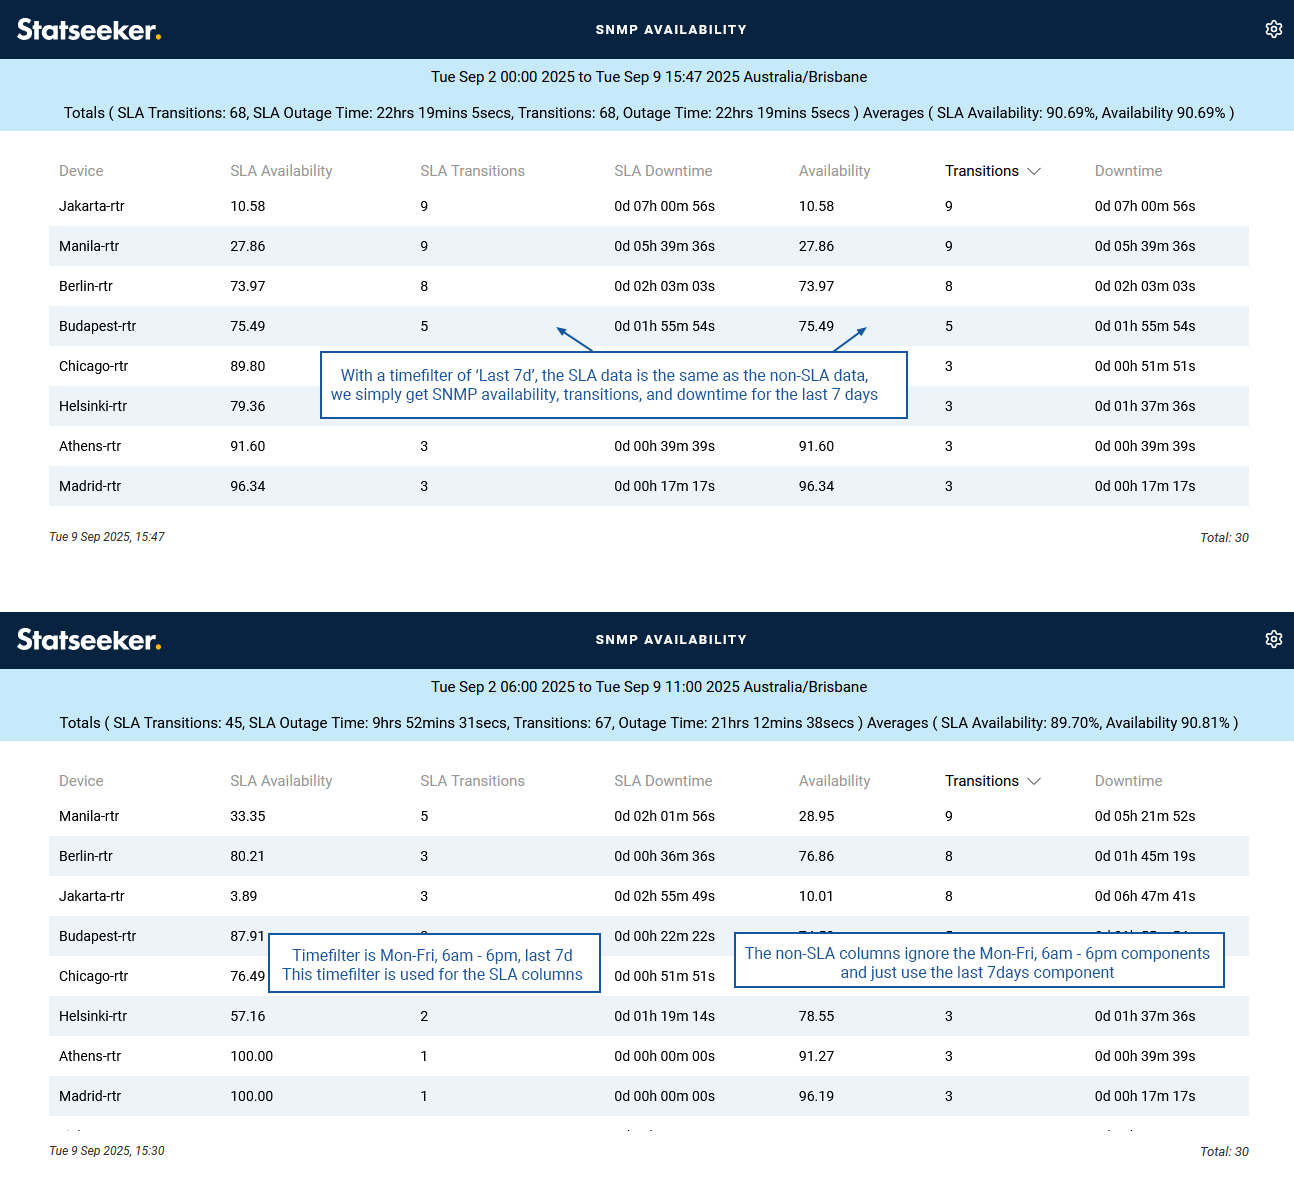
This report can be used to present SNMP availability (percentage of time ‘up’, total number of transitions into a ‘down’ state, total time in a ‘down’ state) for the specified reporting period (timefilter assigned prior to running the report). It can also be used to compare SNMP availability for a specific time range within a larger reporting period – for this option, specify a timefilter which includes some degree of an ‘exclusion’ period.
For example, rather than a time filter of the last 7 days (range = start_of_today – 7d to now;), configure a timefilter of Mon-Fri, 06:00 – 18:00, for the last 7 days (range = start_of_today – 7d to now; wday = Mon to Fri; time = 06:00 to 18:00;), then run the report using this timefilter. With this configuration you get the SNMP availability data for the total reporting (last 7 days) and availability data for just the Mon-Fri, 06:00-18:00 within those 7 days.
The report can be run on a device or group level. If one or more devices are selected when running the report, data for each device is presented on a separate row. If one or more groups are selected when running the report, data for each group is presented on a separate row with data aggregated for each device in the group.
Dashboard Content
There is a range of default dashboards and panel templates that presents SNMP State data:
- Asset Overview – total number of devices being SNMP polled
- Device Overview – device SNMP availability (for the reporting period) and current SNMP state
- Network Summary – counts of devices currently SNMP ‘Up’ and SNMP ‘Down’, current SNMP State of devices in recent ping-down event records
- Server Overview – device SNMP availability (for the reporting period) and current SNMP state
- Daily Device SNMP Reachability (graph template) – the average SNMP reachability for the last 7 days across all devices that match the dashboard Group and Device filters
Custom Report and Dashboard Content
Dashboards
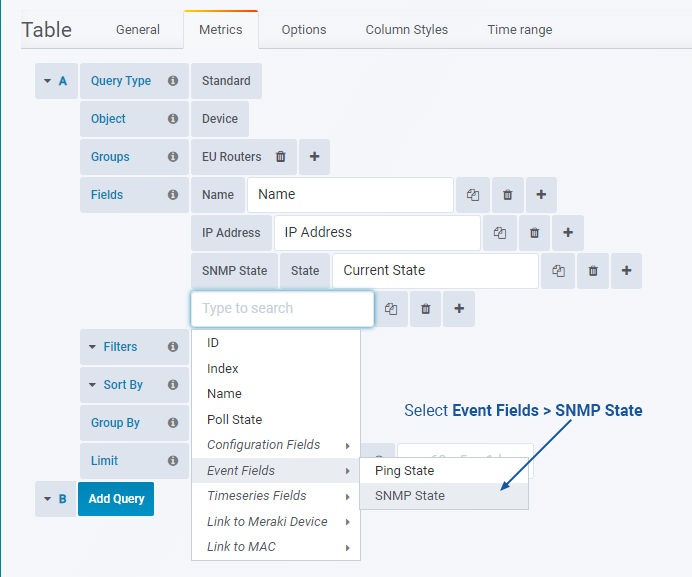
To configure custom dashboard panels to present SNMP State:
- Set Object = Device
- Add the SNMP State field, select Fields > Event Fields > SNMP State
- Specify the data format to use
Reports
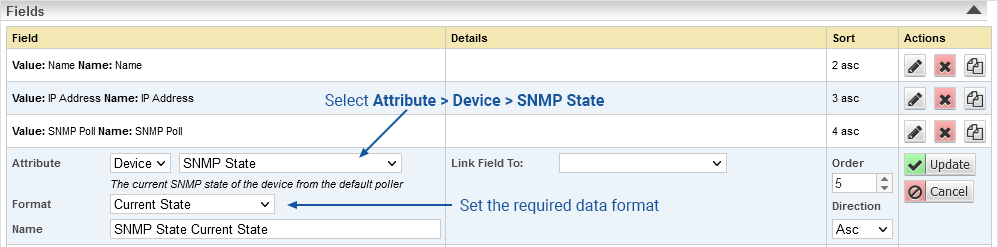
To configure custom reports to present SNMP State:
- Set Report Data Type = Device
- Add the SNMP State field, select Attribute > Device > SNMP State
- Specify the data format to use
When creating custom dashboards or reports containing SNMP State data, there is a range of data formats to select from. Some of these formats also require the specification of one or more SNMP States:
- Percent in/not in States – the percent of time the device has been in/not in any of the specified states
- Time in/not in States – the time the device has been in/not in any of the specified states
- Transitions into/out of States – the number of transitions into/out of the specified states
- Total Transitions – the total number of state transitions
- Poll – whether SNMP polling is enabled/disabled (on/off)
- Current State – the current SNMP state of the device
- Time of last transition – the time of the last state transition for the device
Alerting on SNMP State Changes
Statseeker automatically creates an event record for every SNMP State change that occurs within your monitored network. Alerts can be configured in response to these event records. A device may stop responding to SNMP communications for a range of reasons, including:
- The device is unreachable due to it or an upstream device being offline
- A change has been made to the SNMP community string on the device, or the community string records within Statseeker
- A change has been made to firewall configurations which is preventing SNMP communication from occurring between the device and the Statseeker server
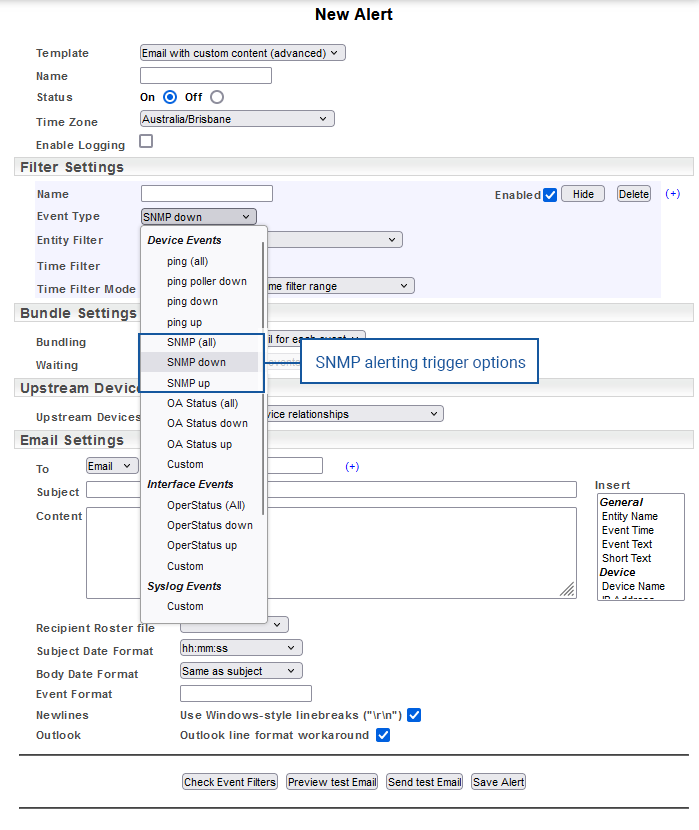
Statseeker alerting offers SNMP-specific alerting triggers:
- SNMP (all) – triggered by devices entering both ‘SNMP up’ and ‘SNMP down’ states
- SNMP down – triggered by devices entering the ‘SNMP down’ state
- SNMP up – triggered by devices entering the ‘SNMP up’ state
For more information on alerting and alert configuration, see Alerting.