Index
Overview
Statseeker can be used as a comprehensive proactive, and reactive, alerting solution. Alerts can be triggered for:
- Threshold Events - by configuring thresholds for specific metrics you can have Statseeker alert to you when, among other things, your network is experiencing unusual activity, or a device is nearing capacity. For more details, see Threshold Configuration.
- Device Events - device level events, such as ping state changes, on any devices monitored by Statseeker
- Interface Events - interface level events, such as ifOperStatus state changes, on any interfaces monitored by Statseeker
- Syslog Events - if your network contains devices that have been configured to output messages to a remote syslog server, then these devices can send those messages to Statseeker. Statseeker can review these logs and use the content to trigger alerts relating to those events.
- SNMP Trap Events - if your network contains devices that have been configured to output SNMP trap messages to Statseeker, then Statseeker can review these messages and trigger alerts based on their content.
What we will be using is the syslog output of our Cisco routers to trigger an email alert to be sent when the state of any VPN tunnel operating from/to the router changes. The same alert could be applied to firewalls in this situation.
Requirements
For the alert to be triggered, you need to have syslog output from your target devices (the routers or firewalls that will be the source/destination of the tunnels) being sent to your Statseeker server. This configuration is made on the device itself:
- Refer to your device specific documentation on how to do this
- Direct the syslog output to the Statseeker server
- Statseeker listens for incoming syslog on the standard syslog port UPD 514
Alert Configuration
- Select Admin Tool > Alerting / Event Management > Alerting
This will display a list of currently configured alerts.
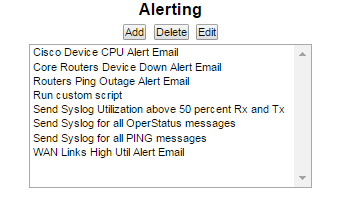
- Click Add
This will display the New Alert screen.
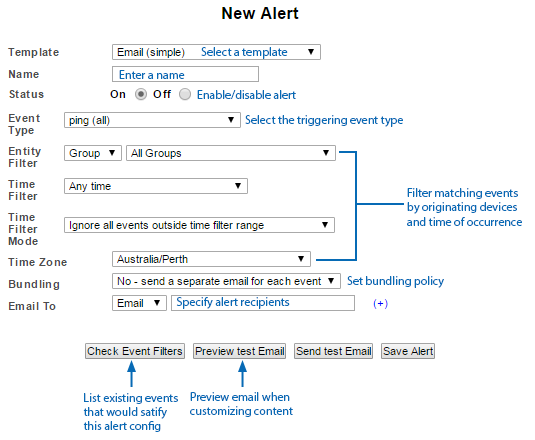
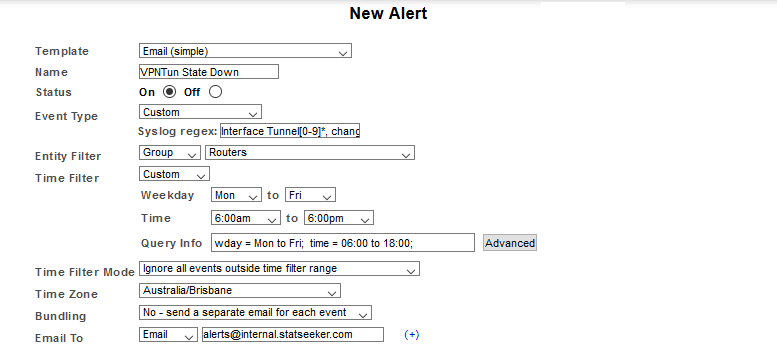
- Select a Template and Name the Alert configuration to suit your requirements
- Set Event Type to Syslog > Custom
Syslog Syntax
Syslog messages can differ between vendors, and device types, so ensure that you use the correct RegEx when creating your filter. Statseeker allows you to review any incoming syslog content and you can use this to confirm the filter string to be used. If you are not familiar with the syntax used in the syslog output from your devices:
- Select Console in the Statseeker navigator
- In the Devices list, select the devices sending the syslog
- Run the Events > Syslog report
This will filter the report to just the selected devices, and display the syslog content received from those devices. Locate a tunnel state change message in the syslog output and set the Syslog RegEx to reflect the message text being sent by your devices.
Here is sample syslog output for tunnel state changes from our devices:
000012 2020-01-22 15:28:39 10.2.20.103 local7.notice 90: *Jan 22 02:31:21.814: %LINEPROTO-5-UPDOWN: Line protocol on Interface Tunnel0, changed state to up
000014 2020-01-22 15:48:41 10.2.20.103 local7.notice 92: *Jan 22 02:51:06.032: %LINEPROTO-5-UPDOWN: Line protocol on Interface Tunnel0, changed state to down
Referring to the sample messages presented above, to alert on the output from our devices we would set the Syslog RegEx field to:
Interface Tunnel[0-9]*, changed state to down
This will alert on down state changes of any Interface Tunnel. To alert on both UP and DOWN state changes simply omit the down. You can confirm that the RegEx filter you supplied is picking up the events you want to alert on by using the Check Event Filters option and reviewing the results. This action will apply your alerting configuration to syslog entries received by Statseeker and return details on those entries satisfying the configuration.
- Set Entity Filter and Time Filter options to suit
- Confirm that your configuration is targeting the syslog entries you wish to alert on, by again using the Check Event Filters option and reviewing the output. Statseeker will display those syslog entries which satisfy your configuration.
- Complete the alert configuration as required by the template you selected and Save the alert
In our example we have included:
- A group filter, limiting the scope of the alert to only those devices in our Routers group
- A timefilter, limiting alerts to only those events occurring during our business hours