Index
Overview
Both Microsoft’s Excel and Power BI products use Power Query to retrieve and format data from external APIs. This can be used to bring Statseeker configuration and timeseries data into either of these products, leveraging their analytic and reporting capabilities.
We will be using the Statseeker REST API to retrieve the data from Statseeker, this process requires basic familiarity with the Statseeker API, see the following for assistance:
The API response will be saved as a JSON file which will be ingested by PowerQuery as the datasource. A Python script will be used to submit the API request and process the output, customizing this script for use within your own environment requires familiarity with Python.
However, Statseeker defaults to token-based authentication for communications with the API and PowerQuery has removed the options for token-based API authentication from the user interface. Token-based authentication can still be achieved but requires the creation of a custom query> and a custom data connector>. Creating these elements requires a working knowledge of PowerQuery’s M function language and will not be covered in this document.
Alternatively, the Statseeker API can be configured to use the deprecated Basic authentication method. For details on configuring the Statseeker server as a web data source and connecting to the Statseeker API using Basic authentication, see Statseeker v5.5.3 Data in Microsoft Excel & Power BI .
Python Script
The Python script generates a file which will be assigned as the datasource in Power Query. The script:
- Authenticates with the Statseeker API
- Submits a query to the API
- Parses the response from the API, extracting the data and discarding the other elements of the response message
- Saves the response data to a specified directory in the same location as the script
import requests
import json
import os
from datetime import datetime

def do_request(server, query, user, pword):
	try:
		headers = {'Accept': 'application/json', 'Content-Type': 'application/x-www-form-urlencoded'}
		url = f'https://{server}/ss-auth'
		authData = {'user': user, 'password': pword}
		resp = requests.post(url, headers=headers, data=authData, verify=False)  # NOTE: verify=False can be updated to use the server's SSH certificate for a secure connection
		print(f"Authentication response status code: {resp.status_code}")

		if resp.status_code == 200:
			myToken = resp.json()
			headers['Content-Type'] = 'application/json'
			headers['Authorization'] = f'Bearer {myToken["access_token"]}'
			url = f'https://{server}/{query}'
			print(f"Attempting data request with URL: {url}")
			resp = requests.get(url, headers=headers, verify=False)   # NOTE: verify=False can be updated to use the server's SSH certificate for a secure connection
			print(f"Data request response status code: {resp.status_code}")
			return resp
		else:
			print(f"Authentication failed: Status code {resp.status_code}")
			return resp # Return the response so the error can be handled
	except requests.exceptions.RequestException as e:
		print(f"Request error: {e}")
		return None # Indicate failure

def log_error(error_message, query):  # Add query parameter
	try:
		errorlog_directory = "<API_ERROR_DIRECTORY>" # Specify the location to house error logs, can be the same as the directory containing the response data files
		if not os.path.exists(errorlog_directory):
			os.makedirs(errorlog_directory)

		now = datetime.now()
		timestamp = now.strftime("%Y_%m_%d_%H_%M")
		filename = f"error_{timestamp}.log"
		filepath = os.path.join(errorlog_directory, filename)

		full_error_message = f"Timestamp: {timestamp}\nURL: {query}\n{error_message}"

		with open(filepath, 'w') as f:
			f.write(full_error_message)

		print(f"Error logged to {filepath}")

	except Exception as e:
		print(f"An error occurred while logging the error: {e}")

# Statseeker Server IP
server = '<YOUR_STATSEEKER_SERVER>' # Your Statseeker server IP / address
# credentials
user = '<YOUR_API_USER>' # A Statseeker user account name. User must be have API read or read-write permission.
pword = '<API_USER_PASSWORD>' # User account password
# API query
query = '<YOUR_API_QUERY>' # Insert your API query (eg. api/latest/cdt_devices/?fields= ...)

# Run the request
resp = do_request(server, query, user, pword)

if resp and resp.status_code == 200:
	try:
		data = resp.json()

		# Extract the desired data
		objects_data = []
		if data.get("data") and data["data"].get("objects"):
			for obj in data["data"]["objects"]:
				if obj.get("data"):
					objects_data.extend(obj["data"])
		else:
			print("Warning: 'data.objects.data' not found in the response.")
			log_error("Warning: 'data.objects.data' not found in the response.", query)

		if objects_data: # Only save if there's data to save
			output_data_directory = "<API_RESPONSE_DATA_DIRECTORY>" # This is where the API response data will be saved, the specified directory is created relative to this script's location
			output_data_file = "<API_RESPONSE_DATA_FILENAME>" # Filename for the API response data
			try:
				if not os.path.exists(output_data_directory):
					os.makedirs(output_data_directory)
					print(f"Directory '{output_data_directory}' created.")
			except OSError as e:
				print(f"Error creating directory: {e}")
				log_error(f"Error creating directory: {e}", query)
				exit()

			now = datetime.now()
			timestamp = now.strftime("%Y_%m_%d_%H_%M")

			filename = f"{output_data_file}_{timestamp}.json"
			filepath = os.path.join(output_data_directory, filename)

			try:
				with open(filepath, 'w') as f:
					json.dump(objects_data, f, indent=4)
				print(f"Data saved to {filepath}")
			except OSError as e:
				print(f"Error saving JSON data: {e}")
				log_error(f"Error saving JSON data: {e}", query)
		else:
			print("No data to save.")
			log_error("No data to save.", query)

	except json.JSONDecodeError:
		error_message = "Error: Invalid JSON response received from server.\n" + resp.text
		print(error_message)
		log_error(error_message, query)

	except Exception as e:
		error_message = f"An error occurred during file saving or JSON processing: {e}"
		print(error_message)
		log_error(error_message, query)

elif resp is None: # Handle if the request failed completely
	print("Request failed. Check network connection or server.")
else:
	error_message = f'Error: {resp.status_code} {resp.reason}\n' + (resp.text if hasattr(resp, 'text') else "No response text")
	print(error_message)
	log_error(error_message, query)
Script Requirements
To make use of the Python script:
- Copy the script to a location within your environment that can access your Statseeker server. ** This script should not reside on your Statseeker server **
- Ensure that all libraries listed in the import block are available to your local Python environment
- Update the server, user, and pword variables to suit your environment
- Update the query string to return the API data required
- Update the output_data_directory and output_data_file variables, these specify where to store and how to identify your API data
- Update the error log errorlog_directory variable, this is where to store a log of any errors encountered while running the script. This could be assigned the same value as output_data_directory.
The API Query
There are a few considerations when building a query to retrieve data from Statseeker, the foremost being data size. Depending on your requirements, you may be manipulating data within Excel/Power BI prior to running analytics and this process is adversely affected by the size of your data set.
In almost every instance it will be more efficient to perform any required data manipulation prior to importing the data into PowerQuery. The Statseeker API’s formula functionality can likely perform any required data manipulation very efficiently, but interacting with extremely large data sets can tie-up the API.
When data manipulation must be performed in PowerBI\Excel, it may be more efficient to retrieve smaller data sets, complete your data manipulation on each individually, and then merge the data where necessary.
Another consideration is what you intend to do with the data. When retrieving timeseries data from Statseeker you can request that the timestamp of the record be included, this is essential when graphing data, or merging data sets with different start-times or polling intervals.
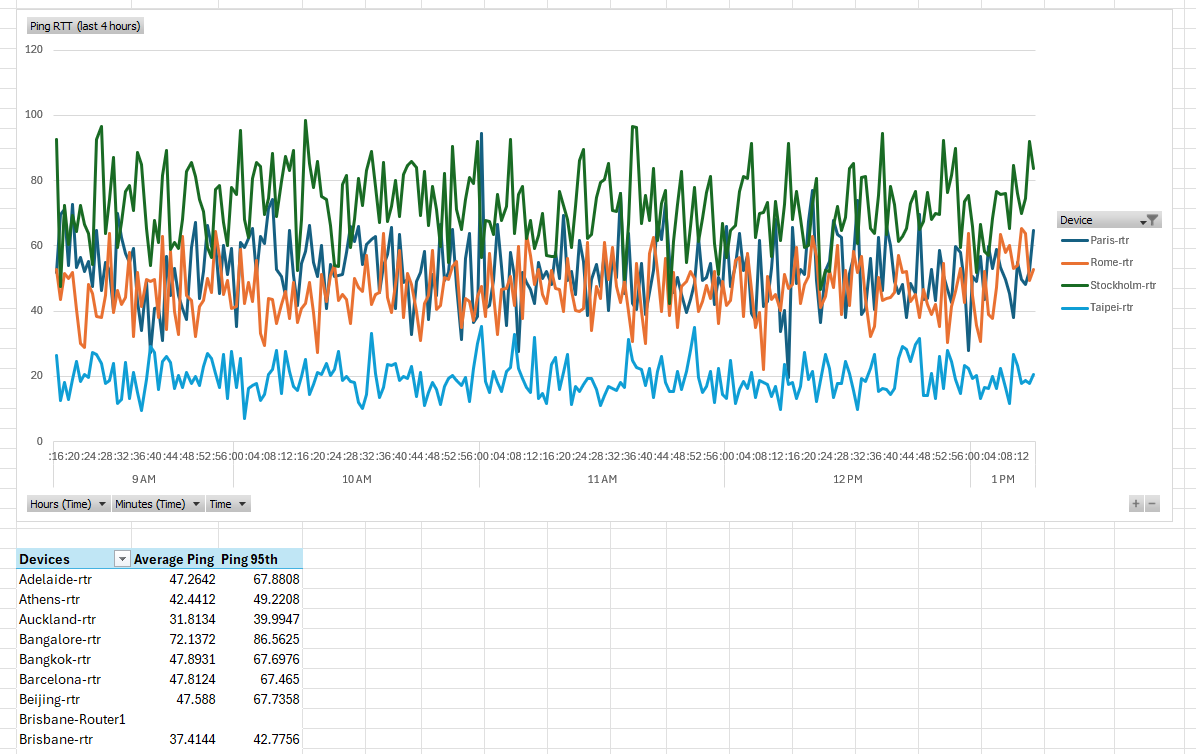
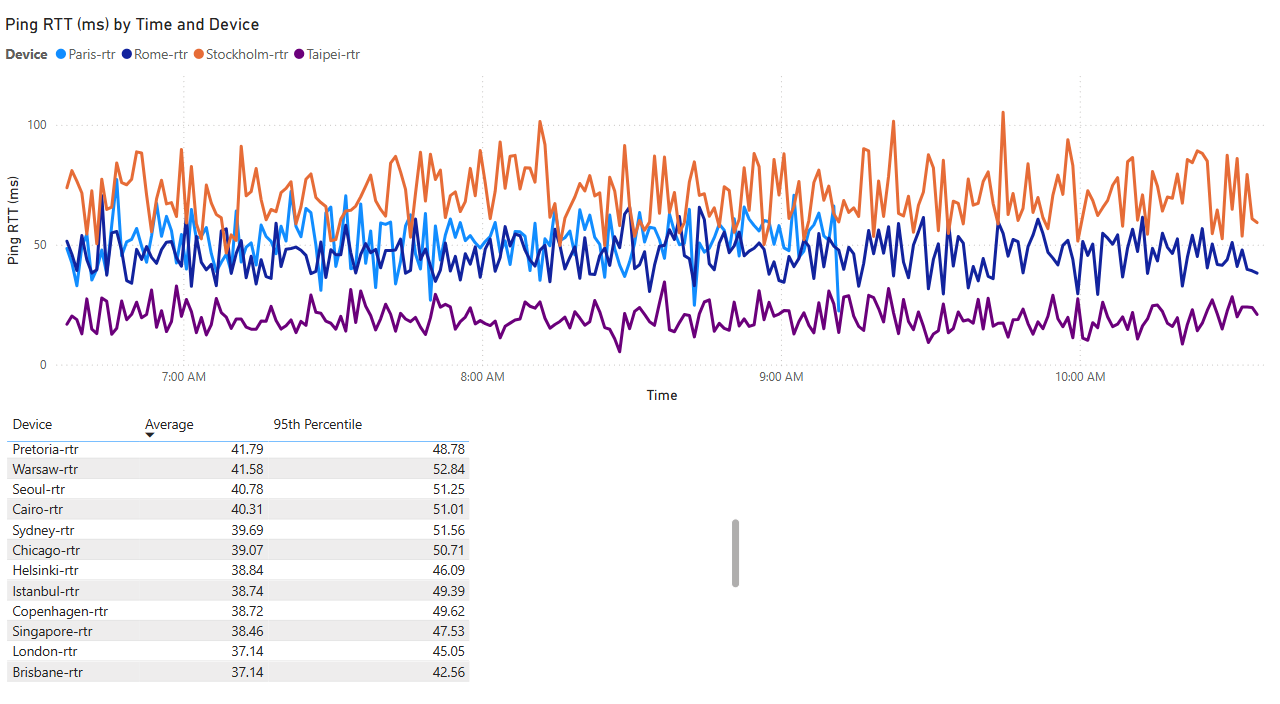
The query we will be using in our example is a simple request for Ping RTT values for a group of devices:
/api/v2.1/cdt_device/?fields=name,ping_rtt&formats=vals,avg,95th&timefmt=%x %X&value_time=start&groups=Routers&timefilter=range=now -4h to now&links=none
- /api/v2.1/cdt_device/ – return device data
- fields=name,ping_rtt – device name and ping RTT data
- formats=vals,avg,95th – the data formats to return
- timefmt=%x %X&value_time=start – request and format timestamps (Note: your could also request epoch timestamps and manage the conversion to human-readable time format in PowerQuery)
- groups=Routers – filter the request to those devices in the “Routers” group
- timefilter=range=now -4h to now – return timeseries data for the previous 4 hours
- links=none – don’t return unnecessary data
import requests
import json
import os
from datetime import datetime

def do_request(server, query, user, pword):
	try:
		headers = {'Accept': 'application/json', 'Content-Type': 'application/x-www-form-urlencoded'}
		url = f'https://{server}/ss-auth'
		authData = {'user': user, 'password': pword}
		resp = requests.post(url, headers=headers, data=authData, verify=False)  # NOTE: verify=False can be updated to use the server's SSH certificate for a secure connection
		print(f"Authentication response status code: {resp.status_code}")

		if resp.status_code == 200:
			myToken = resp.json()
			headers['Content-Type'] = 'application/json'
			headers['Authorization'] = f'Bearer {myToken["access_token"]}'
			url = f'https://{server}/{query}'
			print(f"Attempting data request with URL: {url}")
			resp = requests.get(url, headers=headers, verify=False)   # NOTE: verify=False can be updated to use the server's SSH certificate for a secure connection
			print(f"Data request response status code: {resp.status_code}")
			return resp
		else:
			print(f"Authentication failed: Status code {resp.status_code}")
			return resp # Return the response so the error can be handled
	except requests.exceptions.RequestException as e:
		print(f"Request error: {e}")
		return None # Indicate failure


def log_error(error_message, query):
	try:
		directory = "Router_RTT"
		if not os.path.exists(directory):
			os.makedirs(directory)

		now = datetime.now()
		timestamp = now.strftime("%Y_%m_%d_%H_%M")
		filename = f"error_{timestamp}.log"
		filepath = os.path.join(directory, filename)

		full_error_message = f"Timestamp: {timestamp}\nURL: {query}\n{error_message}"

		with open(filepath, 'w') as f:
			f.write(full_error_message)

		print(f"Error logged to {filepath}")

	except Exception as e:
		print(f"An error occurred while logging the error: {e}")

# Statseeker Server IP
server = '120.2.2.28' # Your Statseeker server IP / address
# credentials
user = 'admin' # A Statseeker user account name. User must be have API read or read-write permission.
pword = 'admin_password' # User account password
# API root endpoint
query = 'api/v2.1/cdt_device/?fields=name,ping_rtt&formats=vals,avg,95th&timefmt=%x %X&value_time=start&groups=Routers&timefilter=range=now -4h to now&links=none'

# Run the request
resp = do_request(server, query, user, pword)

if resp and resp.status_code == 200:
	try:
		data = resp.json()

		# Extract the desired data
		objects_data = []
		if data.get("data") and data["data"].get("objects"):
			for obj in data["data"]["objects"]:
				if obj.get("data"):
					objects_data.extend(obj["data"])
		else:
			print("Warning: 'data.objects.data' not found in the response.")
			log_error("Warning: 'data.objects.data' not found in the response.", query)

		if objects_data: # Only save if there's data to save
			directory = "Router_RTT" # The specified directory is created in the same location as the script
			datafile = "router_rtt_data" # Filename for the API response data
			try:
				if not os.path.exists(directory):
					os.makedirs(directory)
					print(f"Directory '{directory}' created.")
			except OSError as e:
				print(f"Error creating directory: {e}")
				log_error(f"Error creating directory: {e}", query)
				exit()

			now = datetime.now()
			timestamp = now.strftime("%Y_%m_%d_%H_%M")

			filename = f"{datafile}_{timestamp}.json"
			filepath = os.path.join(directory, filename)

			try:
				with open(filepath, 'w') as f:
					json.dump(objects_data, f, indent=4)
				print(f"Data saved to {filepath}")
			except OSError as e:
				print(f"Error saving JSON data: {e}")
				log_error(f"Error saving JSON data: {e}", query)
		else:
			print("No data to save.")
			log_error("No data to save.", query)

	except json.JSONDecodeError:
		error_message = "Error: Invalid JSON response received from server.\n" + resp.text
		print(error_message)
		log_error(error_message, query)

	except Exception as e:
		error_message = f"An error occurred during file saving or JSON processing: {e}"
		print(error_message)
		log_error(error_message, query)

elif resp is None: # Handle if the request failed completely
	print("Request failed. Check network connection or server.")
else:
	error_message = f'Error: {resp.status_code} {resp.reason}\n' + (resp.text if hasattr(resp, 'text') else "No response text")
	print(error_message)
	log_error(error_message, query)
Configuring the Data Source
- Update the Python script as needed, see Python Script for details
Configuring the data source differs slightly between PowerBI and Excel:
Power BI
In our example, we are using Power BI Desktop, but the process is identical across the Power BI range.
- Select Home tab > Get Data > File > JSON and click Connect
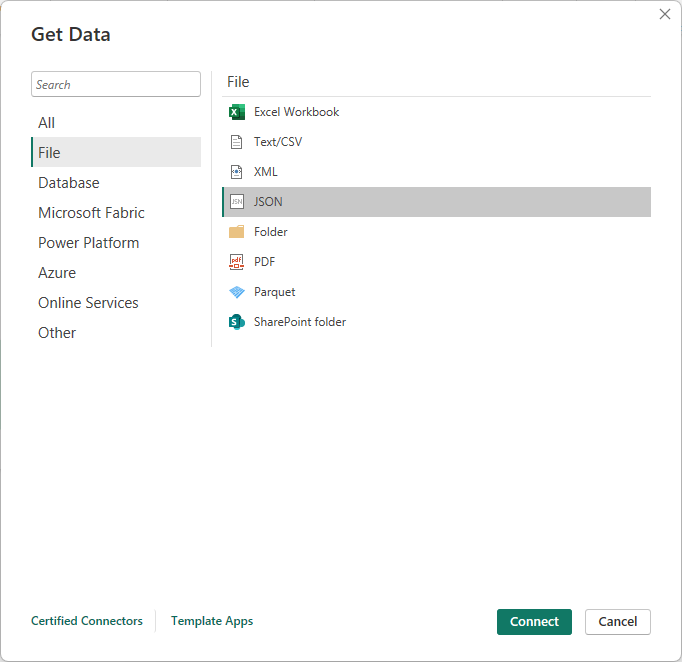
- Browse to the location of the saved API output, select it, and click Open
The data will be imported and presented as a table.
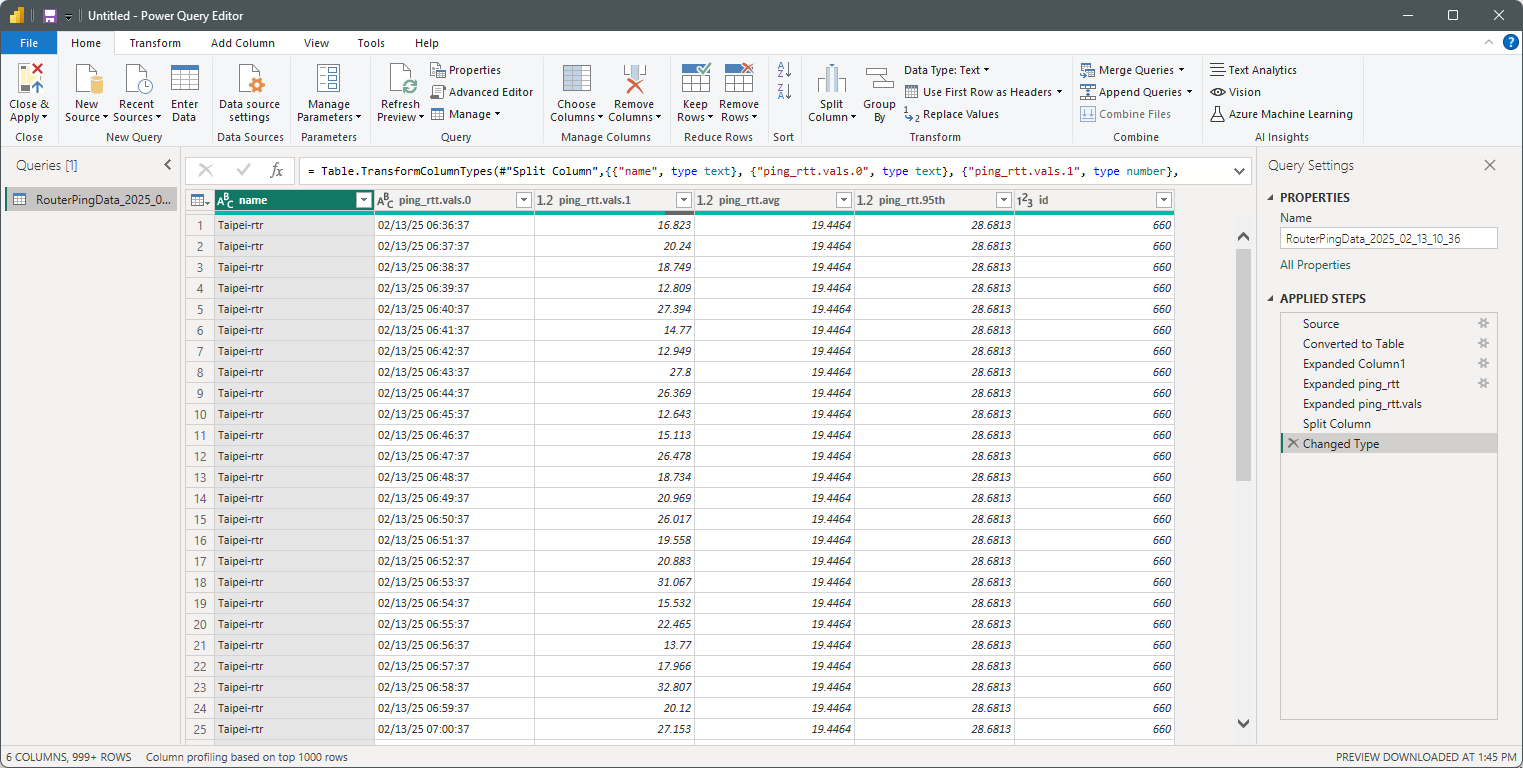
The ping_rtt.vals.0 in our example data contains the timestamps in a “date time” format. PowerBI defaults to summarizing timestamps (year, quarter, month, day) for display, and in this instance it doesn’t suit my needs so I’ll split the column into a date column and a time column. Depending on your query you may not have timestamps or your timestamps may be formatted differently.
- I right-click the column header and select Split Column > by Delimiter and nominate space
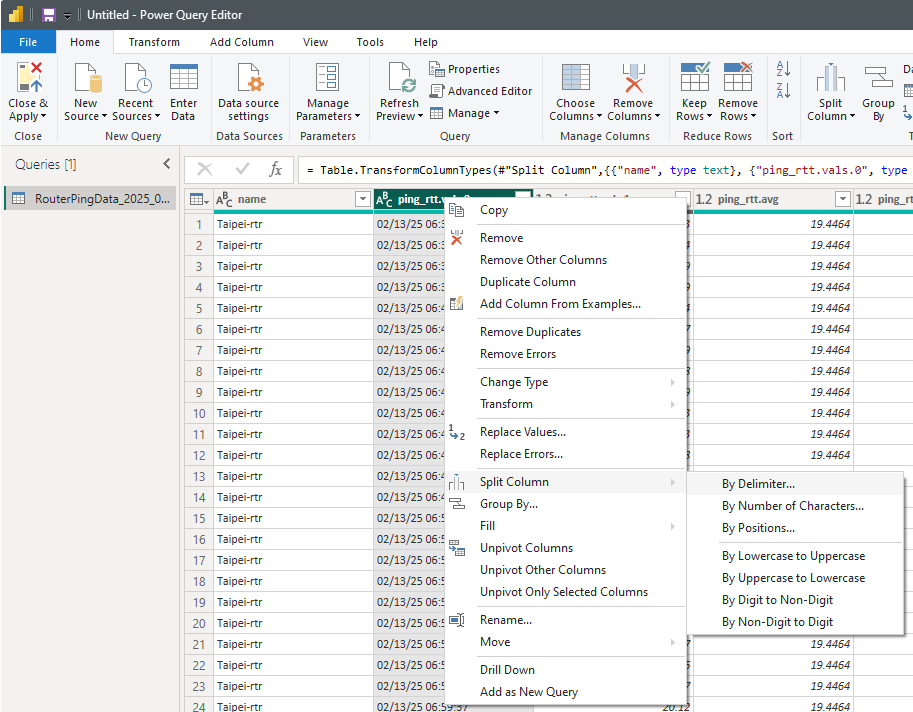
- I’ll also rename (right-click the column headers and select Rename) the columns
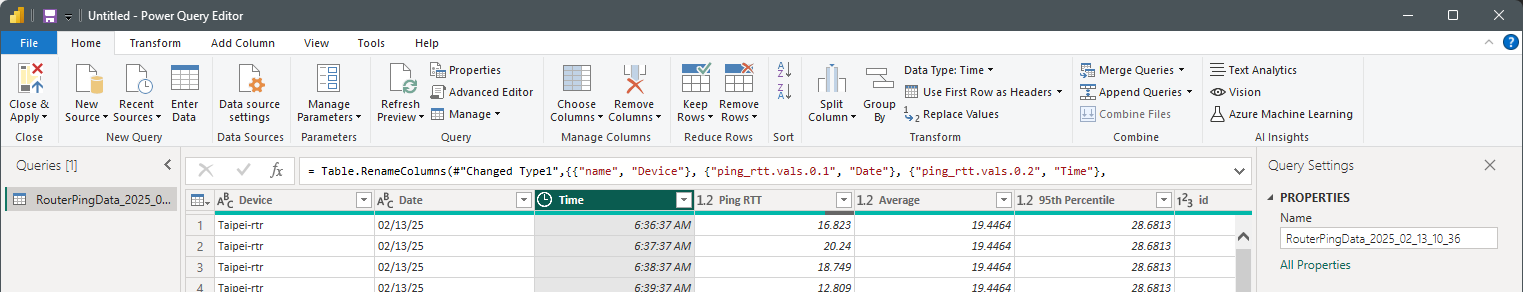
- Clicking Close & Apply saves the datasource configuration
The data is labeled for easy identification, and I have timestamps that will work with the data visualizations I want to employ.
Excel
Compared to PowerBI, Excel requires a few more steps unpacking the data to correctly configure the data source, but the process is fairly similar.
Use the process below as a guide and modify it to suit your requirements.
- Open a Blank Workbook
- Select Data > Get Data > From File > From JSON
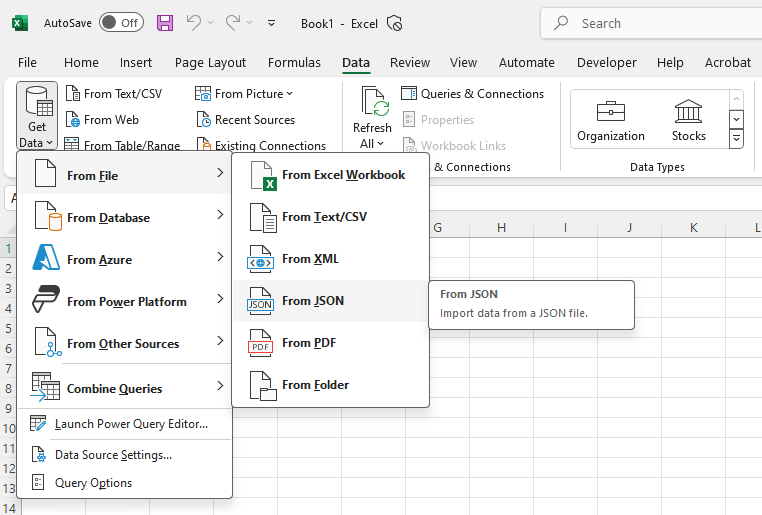
- Browse to the location of the saved API output, select it and click Open
The data will be imported and presented as a list.
- Select List Tools:Transform tab > To Table
- Select none when prompted for a delimiter and click OK

You will now a have single column table with each row containing a Record.
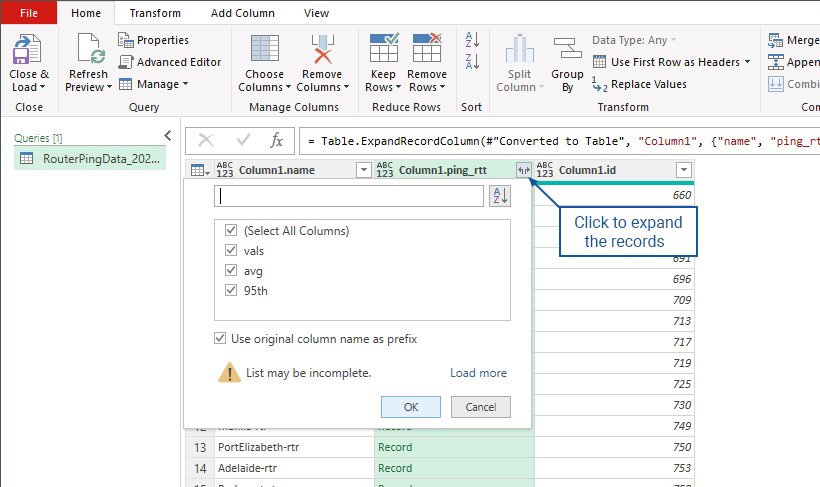
- Click the icon in the top-right of the column header to expand the records
- Select All Columns and click OK
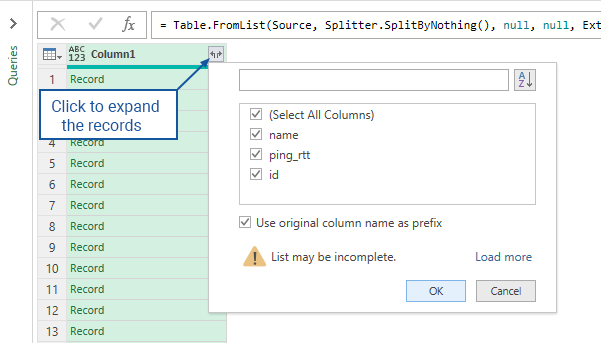
My example data now contains 3 columns, device name, device ID, and a ping_rtt column. Because my query returned multiple Ping RTT data formats this column also contains Records so I’ll need to expand it as well.
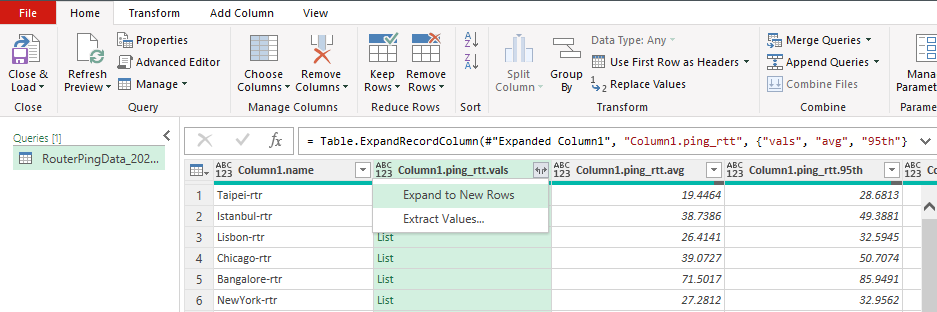
- Where a column displays Record, expand the column to expose your data
My Ping RTT data consists of ping RTT values for each minute of the reporting period, and the average and 95th percentile ping values for the entire reporting period. My ping RTT values are displayed as a List (timestamp and ping RTT for each minute the data was collected) so I need to expand that column as well. The expand options have changed with the content being a list:
- Click the icon in the top-right of the column header to expand the records
- Select Expand to New Rows
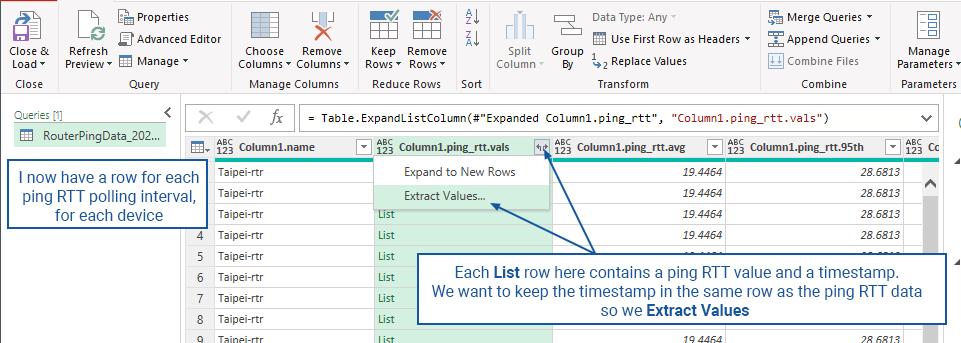
My ping RTT data is no longer grouped by Device, I now have a row for each polling interval
- Click the icon in the top-right of the column header to expand the records
- Select Extract Values
- Select Tab as the delimiter and click OK
Note: due to the timestamp format specified in my query the timestamp will contain slashes (/), spaces, and colons (:). Selecting Tab creates a unique delimiter to separate my timestamp and ping RTT values, allowing me to split these into separate columns in the next step.
The ping RTT column now displays a timestamp and a ping RTT value separated by a tab. To separate these:
- Click the column header to select the column
- Select Home tab > Split Column > By Delimiter
- Specify Tab as the delimiter
- Optionally, right-click a column header and select Rename as needed
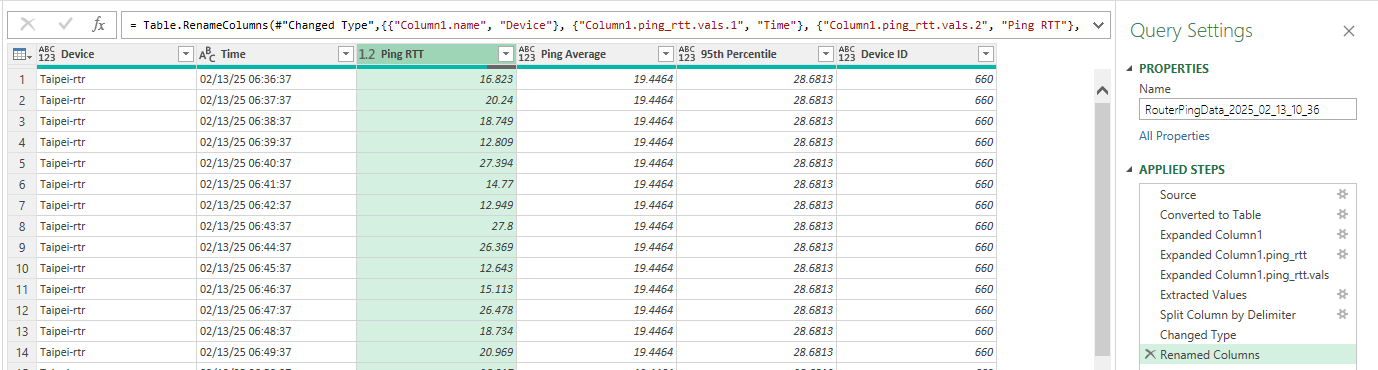
- When the data is formatted correctly click Home tab > Close & Load
The data will be loaded into Excel for analysis and reporting.