Index
- Overview
- Prerequisites
- Static Interface Utilization Graph
- Dynamic Interface Utilization Graph
- Additional Filters through Object Options
Overview
Grafana is a well-known open-source product which can be used for the analysis and display of time-series data and features a great graphing library. Statseeker has written a plugin that can be used to add your Statseeker server as an available datasource for Grafana. Through the Statseeker API, the plugin can retrieve your network data from Statseeker and convert it to a format to be consumed by Grafana.
This document will cover the process required to build basic Grafana dashboard components featuring Statseeker data.
Prerequisites
The processes present in this document require that you have:
- A Statseeker v5.2 (or higher) server
- A Grafana server
- Statseeker configured as a datasource on your Grafana server using the Statseeker – Grafana Datasource Plugin
- Basic familiarity with Statseeker reporting, data formats, time filters and the Statseeker API, see the Statseeker Documentation Library for details on any of these items
Static Interface Utilization Graph
Once logged into your Grafana server:
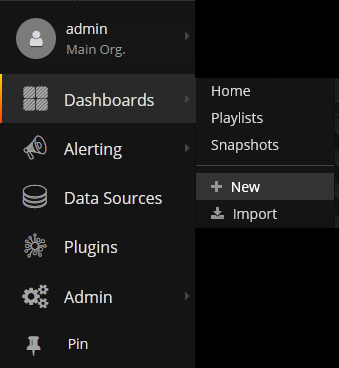
- Select Dashboards > New to add a new dashboard
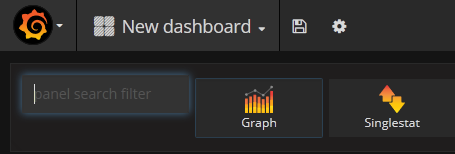
- Select Graph to add a graph panel to the dashboard
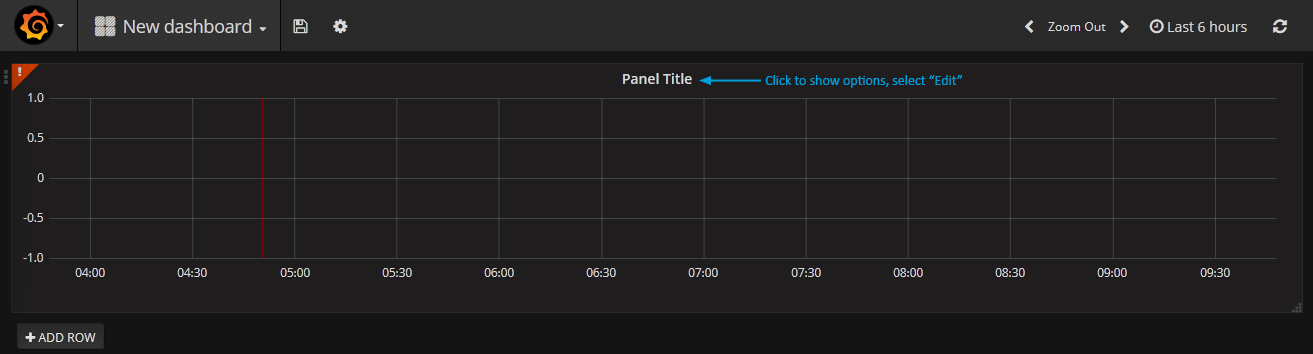
- Select the panel title and click Edit
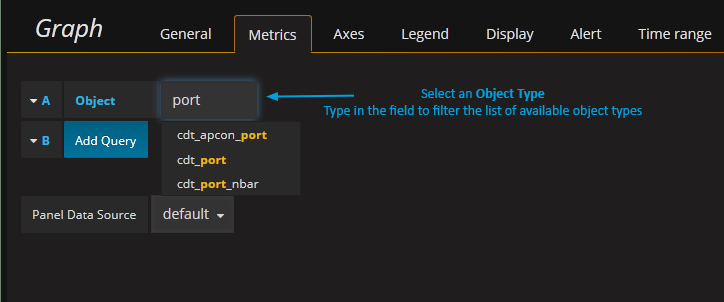
- Select an Object Type – this is the name of the of the Statseeker API resource, in our example cdt_port
- Select a Field and data format, we want RxUtil and a format of vals to plot time-series data points
- Click the ‘refresh’ button in the top-right to send the request and display the data
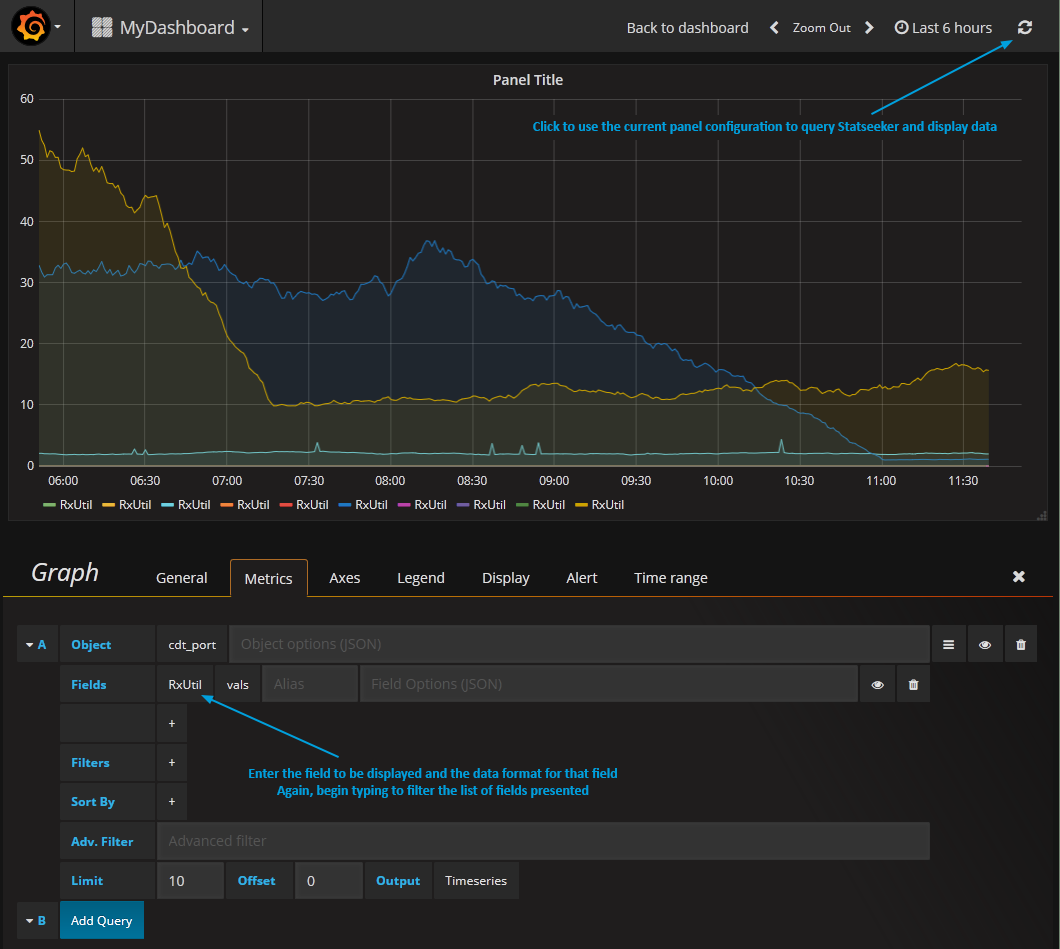
Now we have values on our graph, but where are they from? Let’s identify each data series being displayed.
- Add the fields cdt_device.name and name, click refresh
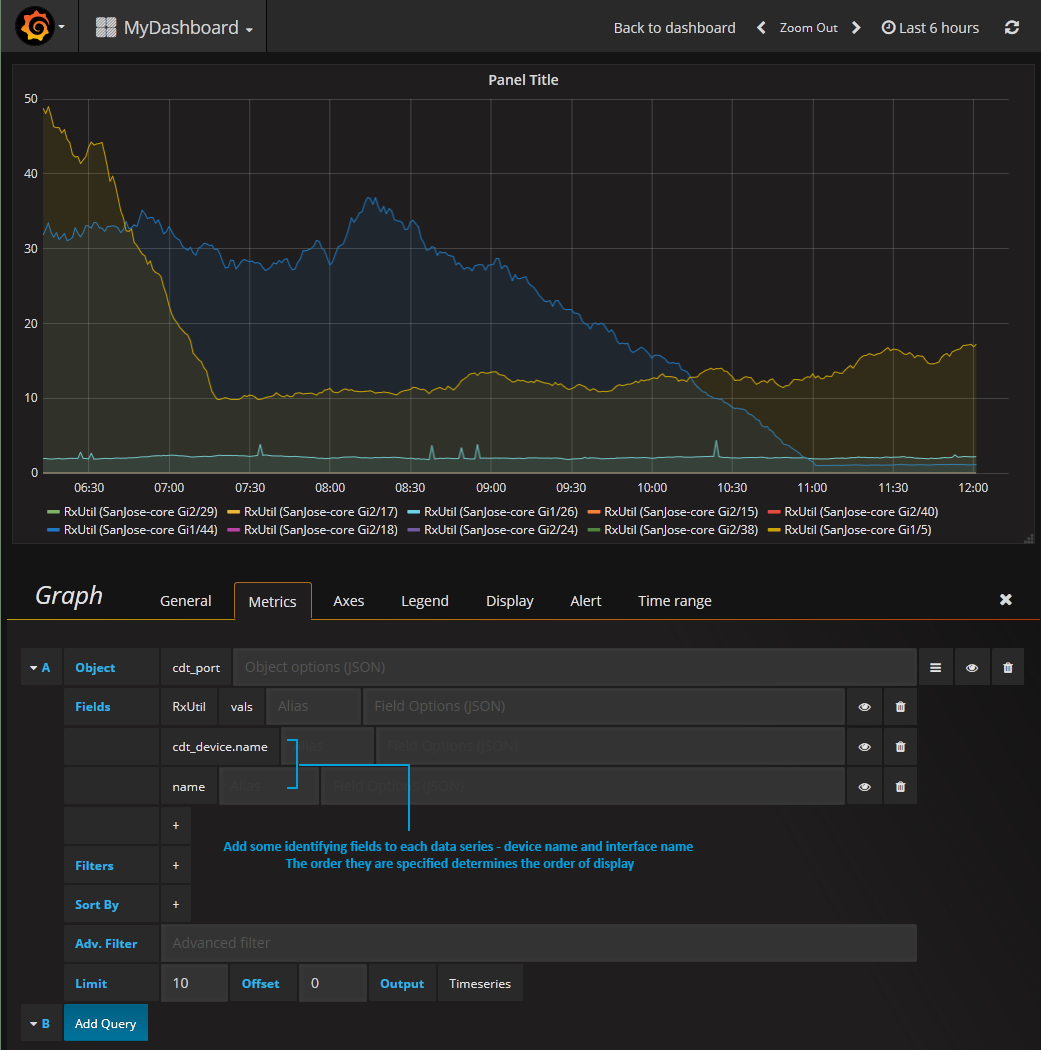
We can now see that the graph is showing data from the device named SanJose-core. We did not specify a specific device, so Statseeker returned data for all devices and SanJose-core was simply the first in the array of devices returned. At the bottom of the metrics tab we can see that the Limit is set to 10, so we are only displaying the first 10 interfaces returned, all of which are on a single device.
Currently we are displaying the first 10 interfaces that returned, but we are only interested in the busiest interfaces, so let’s sort the results to highlight them.
- Sort by RxUtil, specify avg to sort by average utilization over the reporting period and select a sort order of Descending
- Set Limit to 5 and click refresh
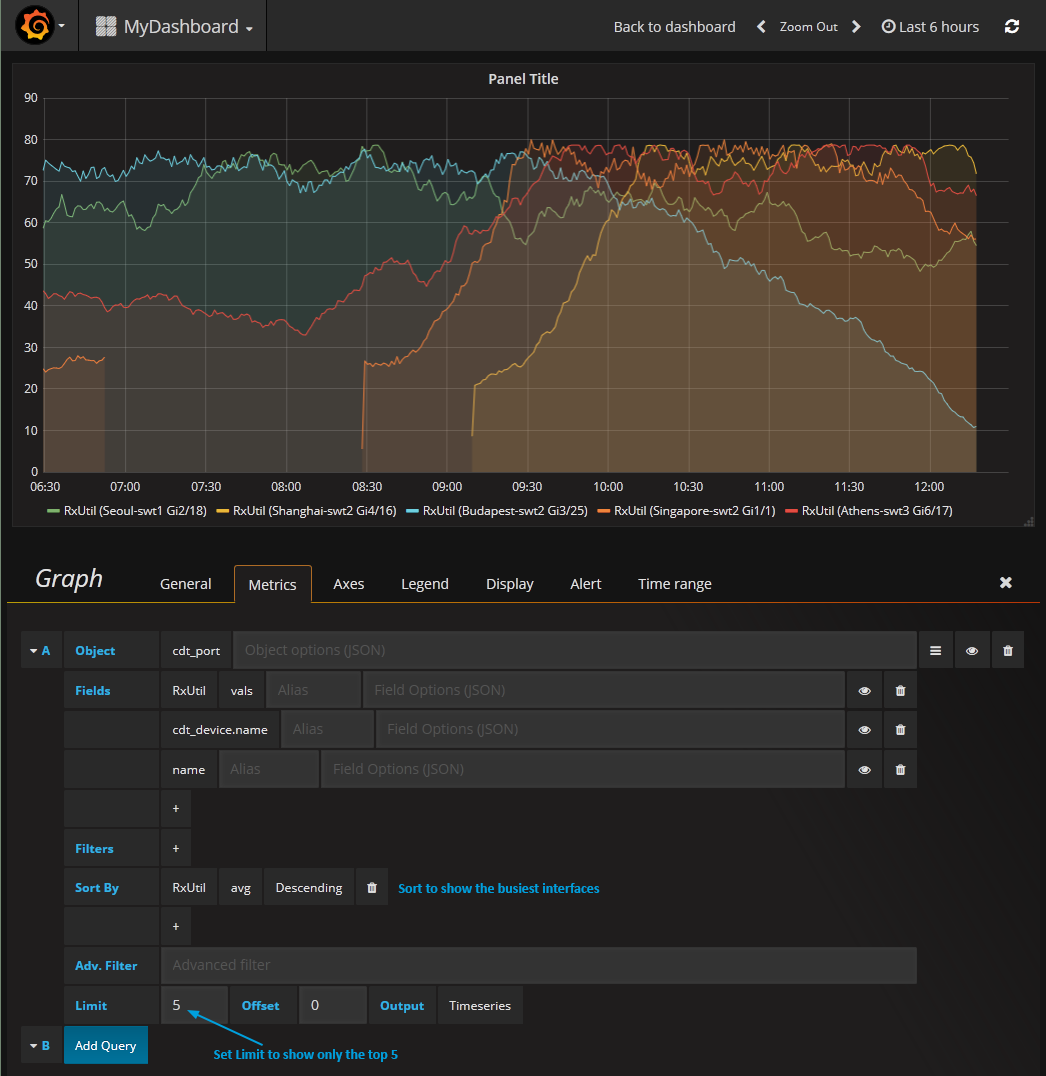
Now we have the top 5 busiest interfaces over the last 6 hours.
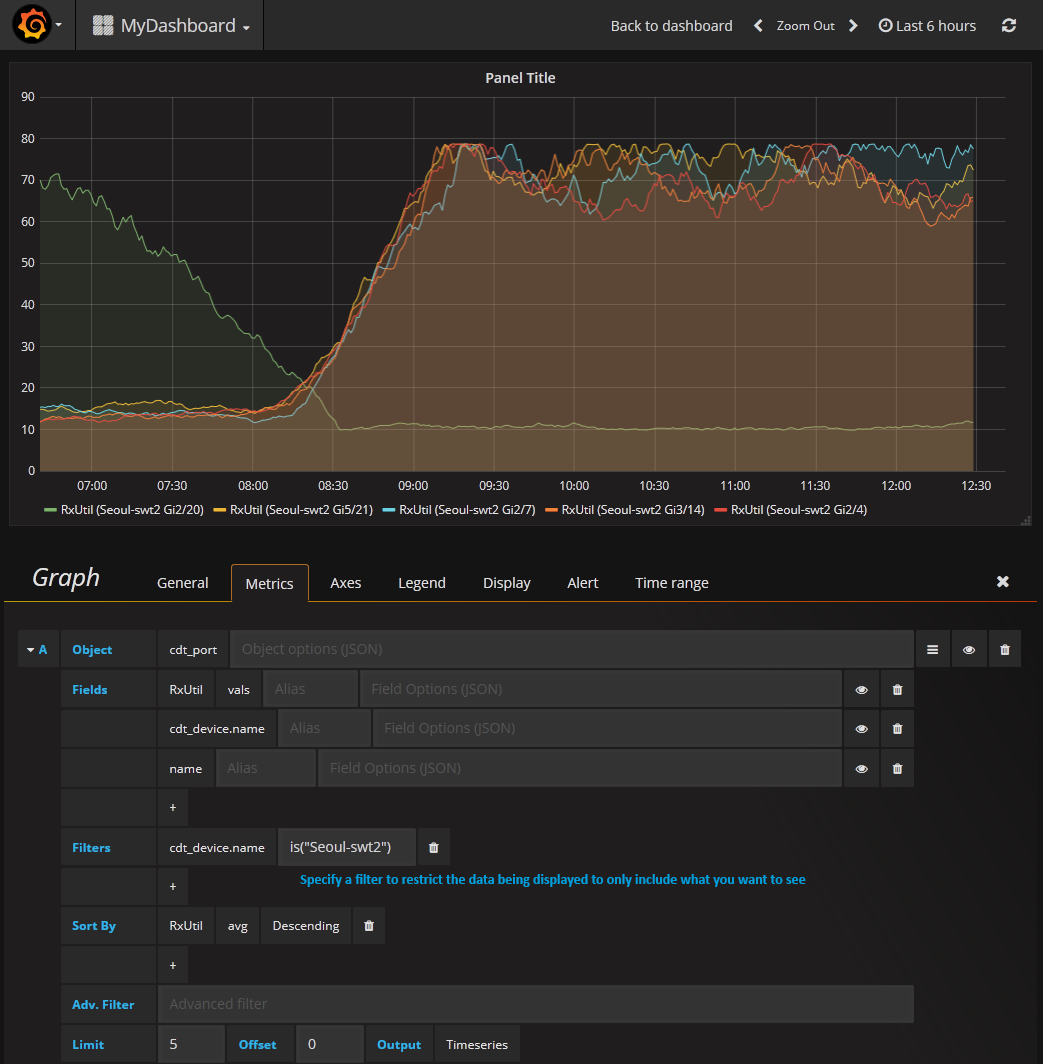
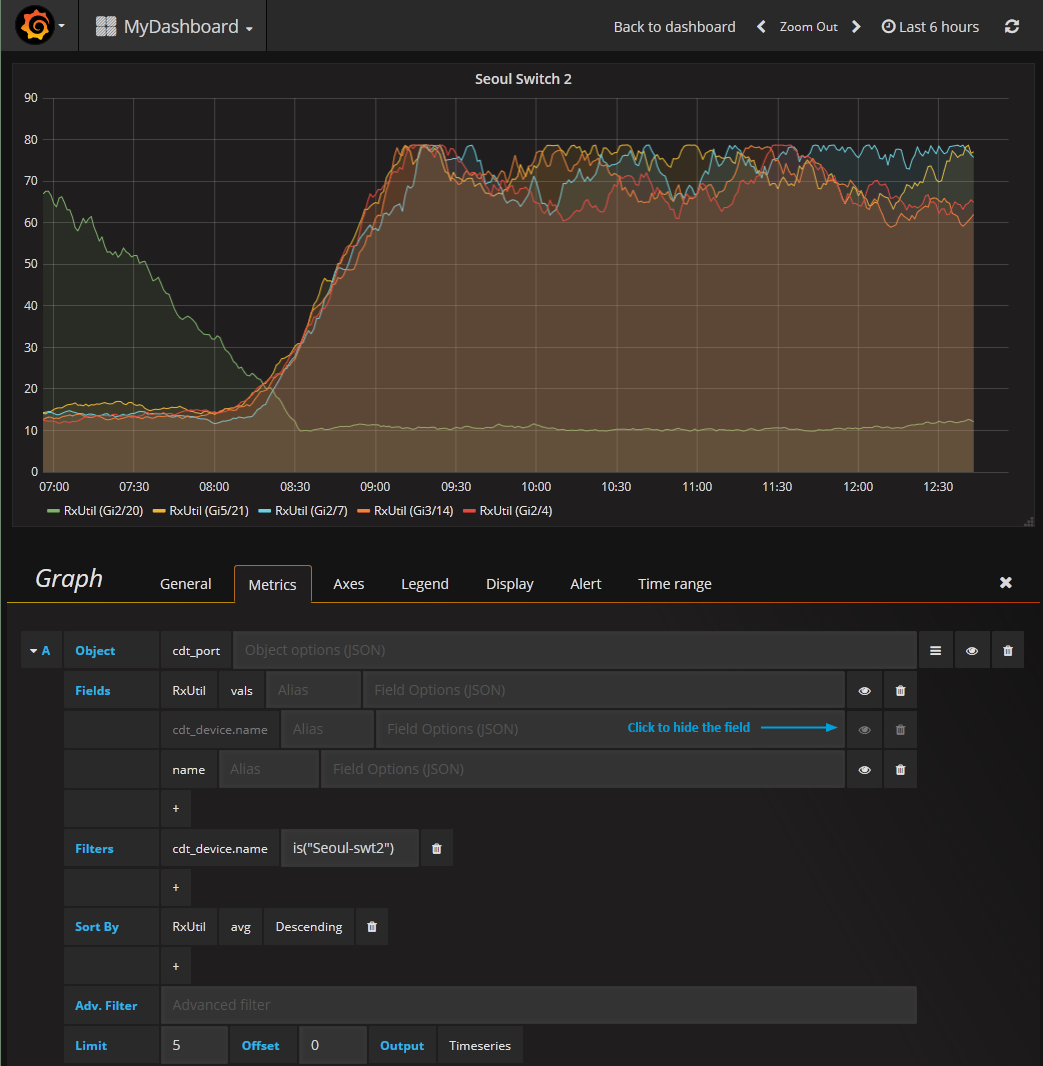
What about just showing the busiest interfaces on a single device, say Seoul-swt2? To restrict the search to a single device, or group of devices, we can specify a filter. In this example, we will restrict the search to a single device by filtering by the device name.
- Set the filter to cdt_device.name with a query string of is(“Seoul-swt2”), and click refresh
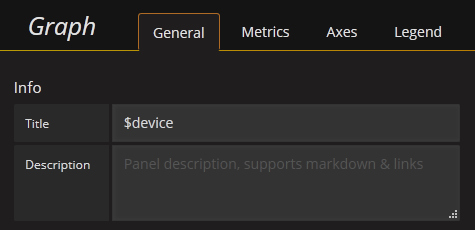
The graph is currently titled Panel Title, but we can address that:
- Select the General tab
- Enter a Title
Now that we have renamed the graph, and we have filtered our search to only display data from Seoul-swt2, we don’t really need to display the device name for each data series.
- Select the Metrics tab
- Click the ‘eye’ icon for cdt_device.name to hide that field
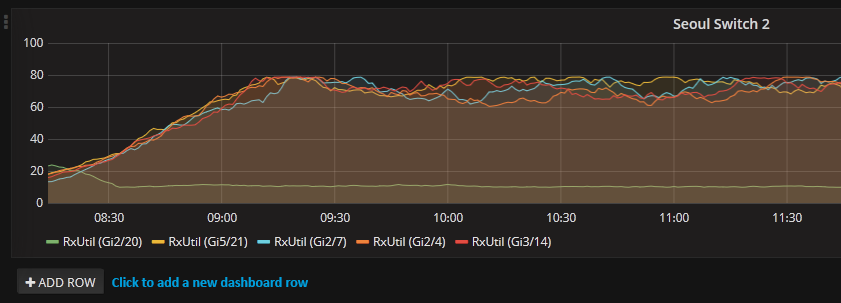
The dashboard panel configuration is complete”
- Save you changes and click the X to disable edit mode

Dynamic Interface Utilization Graph
In the previous section we looked at creating an interface utilization graph which was limited to a specific network device – to change which device was featured in the report, you need to edit the report. In this example, we are going to take that dashboard panel, and modify it to allow the user to select a device from a drop-down list, and have that selection instantly applied to the graph.
To achieve this we are going to take advantage of a Grafana feature called templating. We will use the Statseeker API to populate a drop-down list in the template with the name of every network device known to Statseeker. We can then modify a Grafana dashboard panel to reference the value of the template field for labelling, filtering, and sorting – changing the value in the template field will automatically apply that change to all dashboard elements that reference it.
We will achieve this in three steps:
- Identify the Statseeker API query needed to populate the template list
- Create the template
- Update the dashboard panel to reference the template
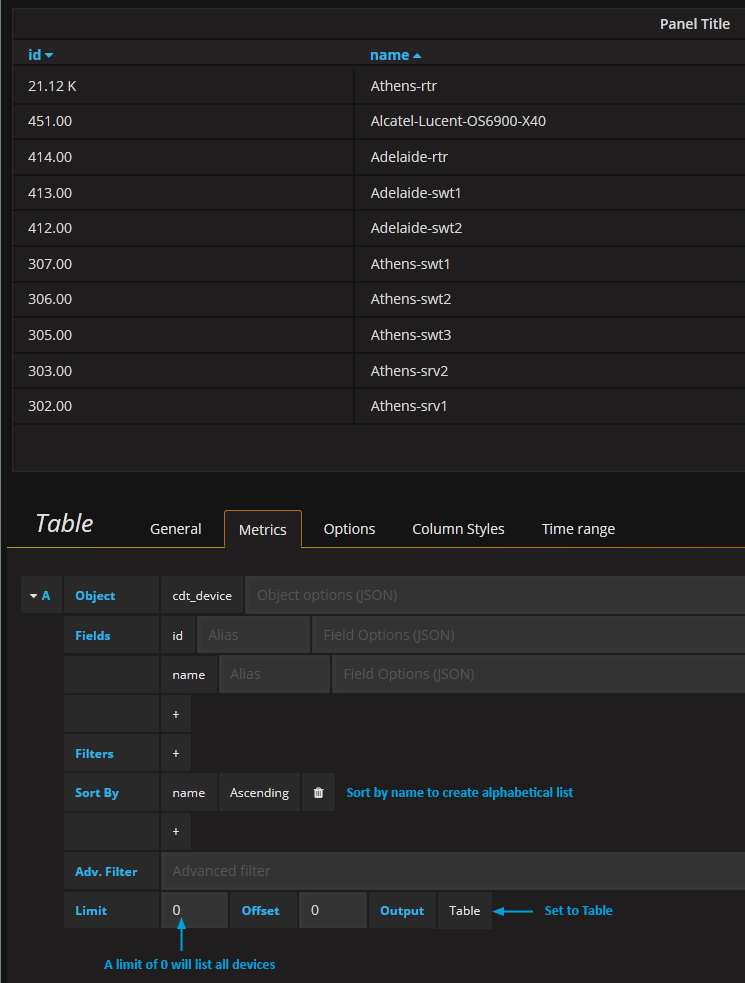
Use a table to provide the API query
- Select ADD ROW
- Select Table
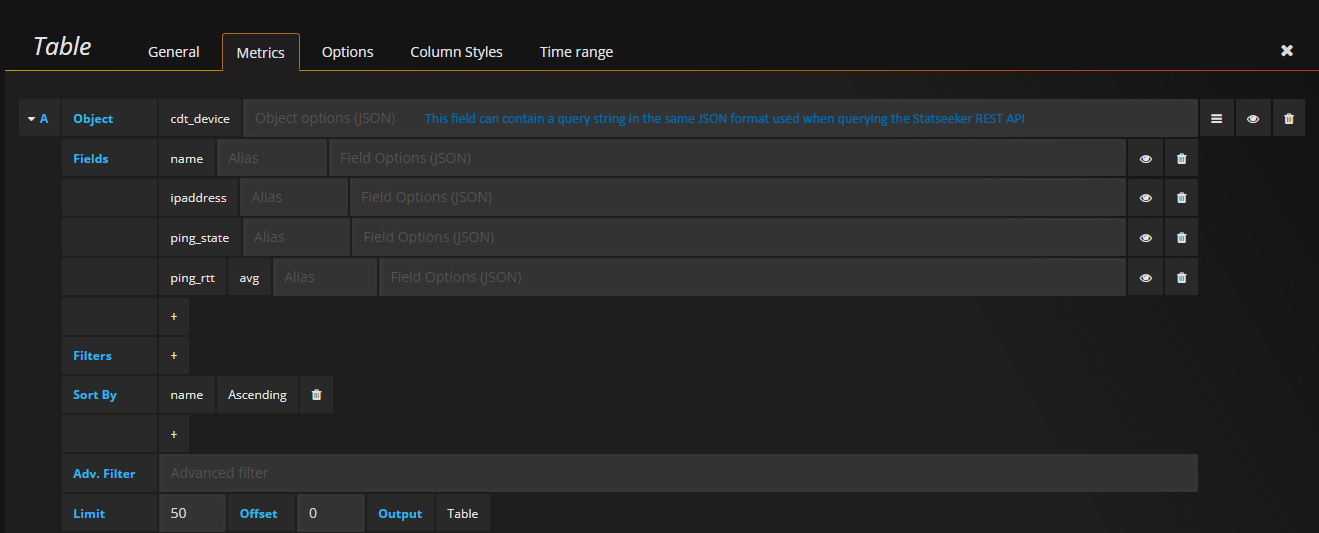
- Click the panel title and select Edit
- Set Object to cdt_device
- Add the fields id and name
- Sort by Name Ascending
- Set Limit to 0
- Set Output to Table
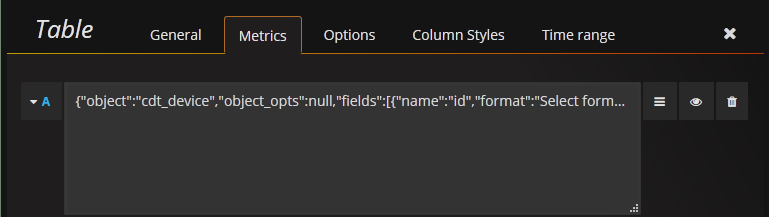
Now we need to copy the API request used to create this table.
- Click the object menu button and select Toggle Edit Mode
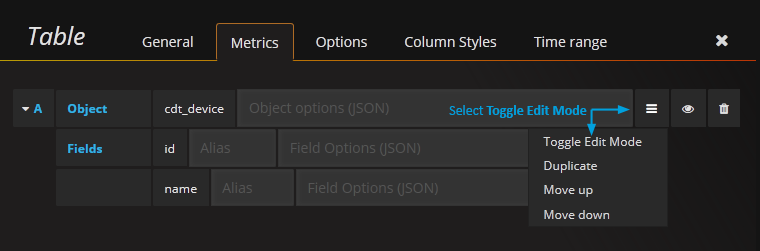
- Select and copy the query string displayed
Create the template
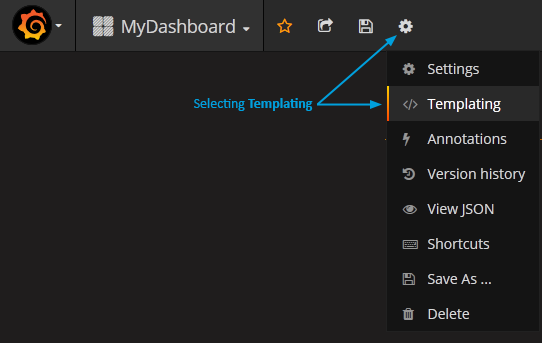
- Select Settings > Templating
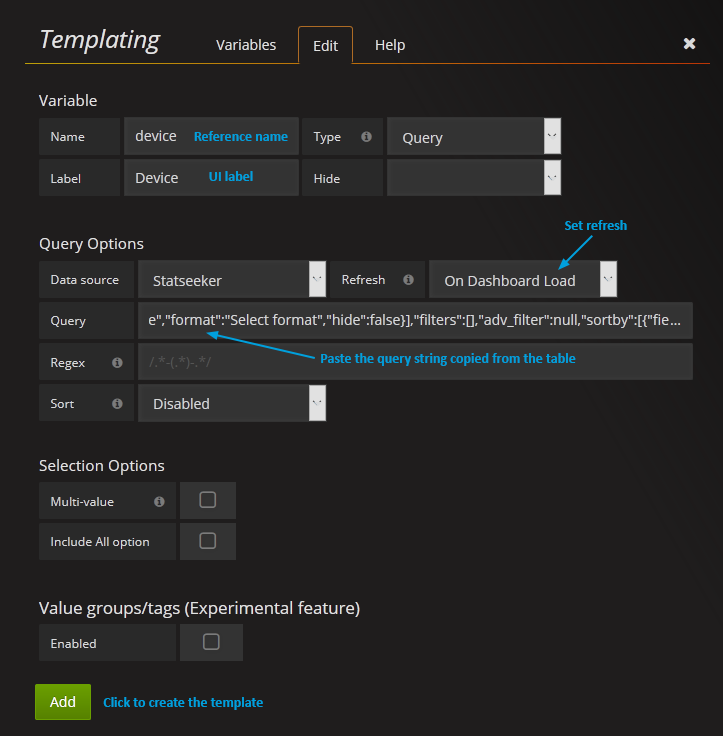
- Specify Variable Name and Label
- Set Data source to Statseeker
- Set a Refresh rate
- Paste the previously copied query string into the Query table
- Click Add
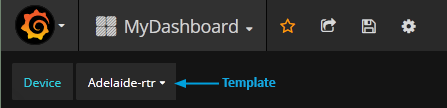
The template will now appear at the top of your dashboard.
Update the panel
To update the panel to use the template we need to replace any static references to cdt_device.name with a reference to the template using the syntax $template_name, in our example the template was named device, so we reference it with $device.
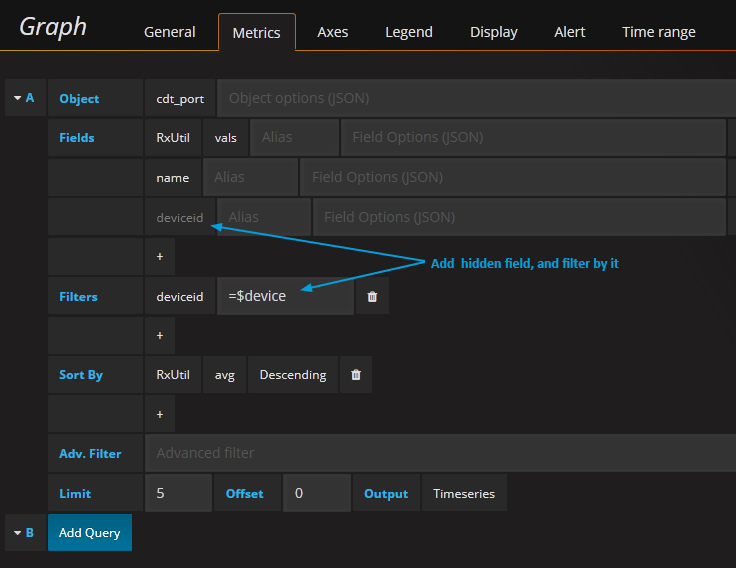
- Click the panel title and select Edit
- In the General tab, change the Title to $device
- In the Metrics tab, delete the cdt_device.name field and the associated filter
- Add the deviceid field, and hide the field
- Add a filter for deviceid = $device
- Save your changes and close the editing panel
The device template can now be used to change the device being graphed in the dashboard panel. Any additional panels which reference the template are also updated on change of the template value.
Additional Filters through Object Options
Grafana offers basic filtering for all the objects and fields via the filter options in the panel configuration. In addition, Grafana offers a catch-all solution for any additional filter, or functionality, you would like to submit along with the request sent when retrieving data via the datasource plugin.
This functionality is catered for by the Object Options field associated with the Object selected for the panel content.
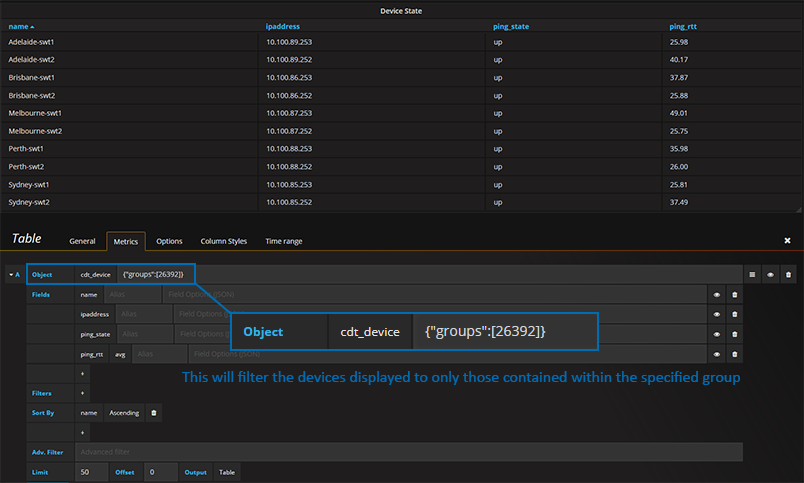
The Object Options field allows you to insert a JSON string to be included in the request sent to the Statseeker API. This can be any JSON string, suitably formatted for the Statseeker API, that is applicable to the API object (e.g. cdt_device, for more information on the Statseeker API, and using the API to request and manipulate Statseeker data, see:
If we look at the example panel presented above, we would be returning the first 50 devices found on the Statseeker server, sorted alphabetically by device name.
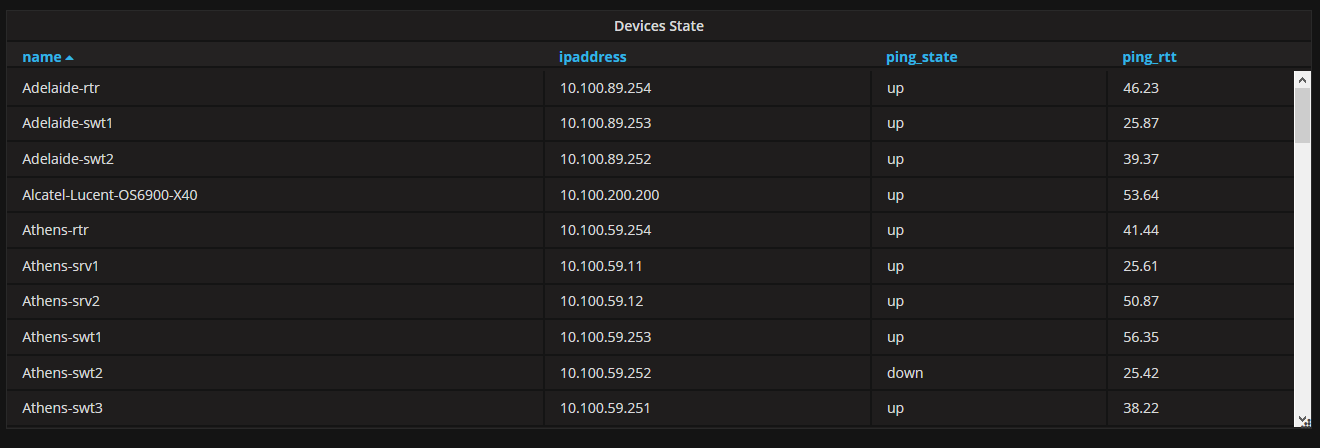
What if we wanted to filter this list to only display devices from a certain group, or groups? There is not field in the cdt_device object that stores information regarding which groups the object is a member of, so how do we filter by group?
Add the required group filter to the Object Options field with the same syntax that you would use when querying the API via a REST request:
- {“groups”:[group_ID1, group_ID2, … groupIDn ]}, e.g. {“groups”:[26392]} or {“groups”:[26392,26395,26399]}
- https://your.statseeker.server/api/latest/group?fields=name will return an object containing all groups, and detailing each groups’ name and id
- https://your.statseeker.server/api/latest/group?fields=name&name_filter=IS(“MyGroupName”) will return the same information, but only for the group named “MyGroupName”