Index
Overview
This custom report will rebuild the stock Console Interfaces > Top Utilization Graphs report with a flexible time filter. The default Top Utilization Graphs report has a fixed 6-hour reporting period, we will build a custom report to replace this stock report and remove the reporting period restriction.

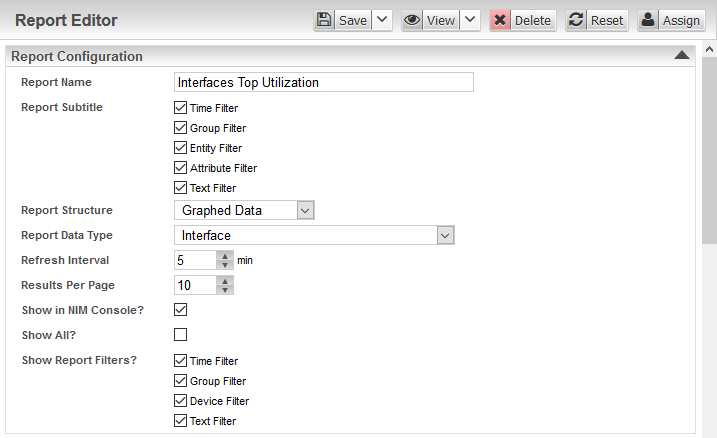
Report Configuration
- Report Subtitle: Time Filter is checked, since the aim is to offer a flexible time filter, displaying the filter as a subtitle ensures that we are aware of the scope of the report
- Report Structure: Graphed Data
- Data Type: Interface
- Refresh: 5mins
- Results: 10, just show me the top ten on the first page
- Show in NIM Console: checked, I want the report available from the Console
- Show Report Filters: all checked, in-report filters add the ability to alter the scope of the report on the fly
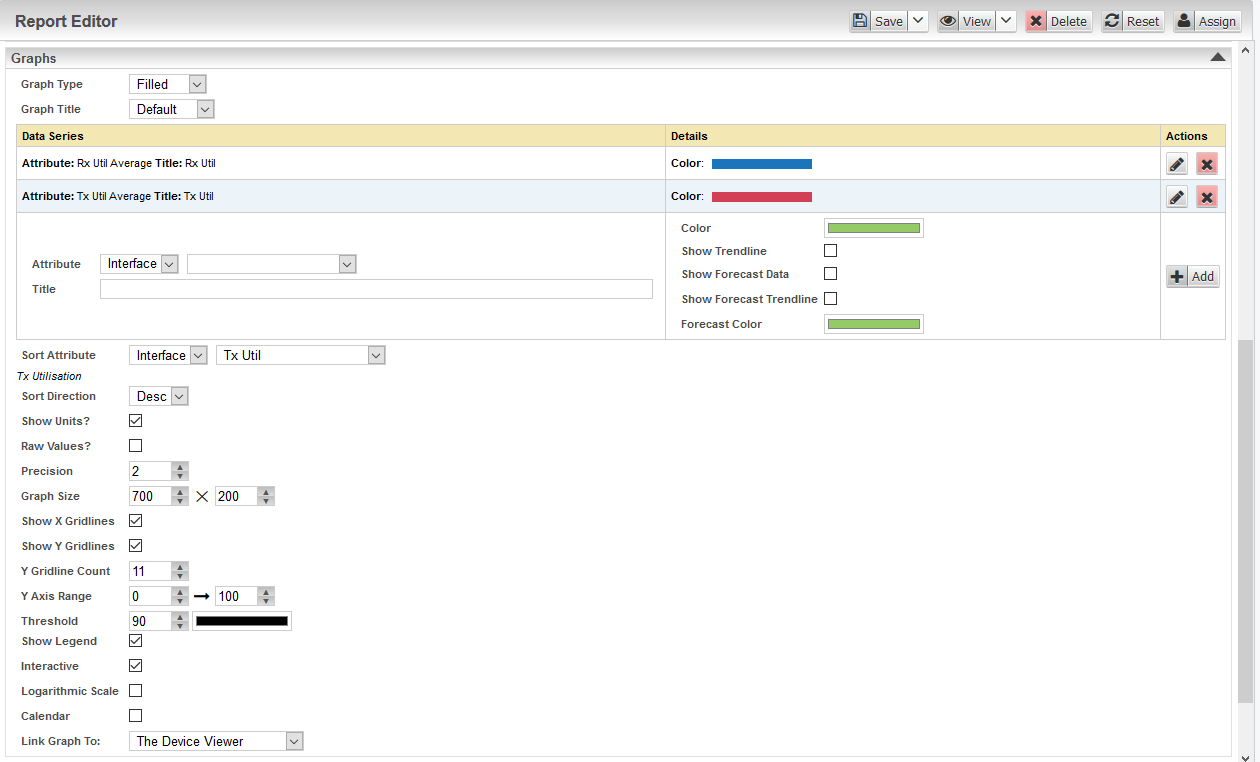
Graphs
- Graph Type: Filled
- Graph Title: Default
- Data Series: Interface > Rx Util, the default ‘blue’ color matches that of Rx Util in the Console reports
- Data Series: Interface > Tx Util, the default ‘red’ color matches that of Tx Util in the Console reports
- Sort Attribute: Interface Tx Util, the default Console report sorts on maximum TX Util, our custom report will sort on average Tx Util over the reporting period
- Sort Direction: Descending
- Y Gridline Count: 11, this will show a gridline at every 10% interval (1st interval is at origin)
- Y Axis Range 0 – 100, without this the Y-axis will auto-scale to the data and this in turn means I have to review the Y-axis prior to accurately interpreting the displayed data
- Threshold: 90, highlighting the 90% utilization mark allows an ‘at-a-glance’ indication that the link is nearing capacity
- Link Graph To: The Device Viewer