Index
Overview
Statseeker offers a real-time poller which can query an interface every second, providing visibility to what is currently occurring on the interface. This functionality can be employed when trouble-shooting an issue on the interface, or a traffic issue on your network – real-time feedback on the effects of your actions will greatly improve your ability to both identify, and resolve an issue.
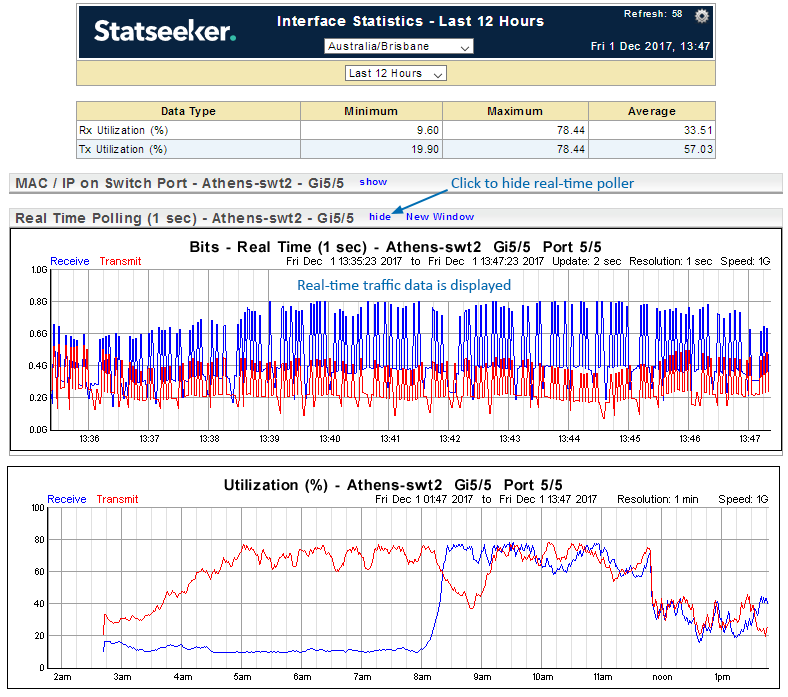
The real-time poller will query the targeted interface every second, and report both inbound and outbound traffic (in bits/s) across that interface. The polling itself will place a very minor load on the link between the interface and your Statseeker server, and does not affect the performance of that link to any significant degree.
Accessing the Real-Time Poller
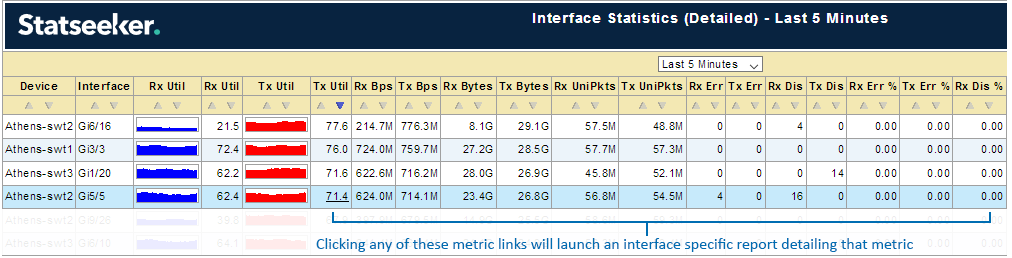
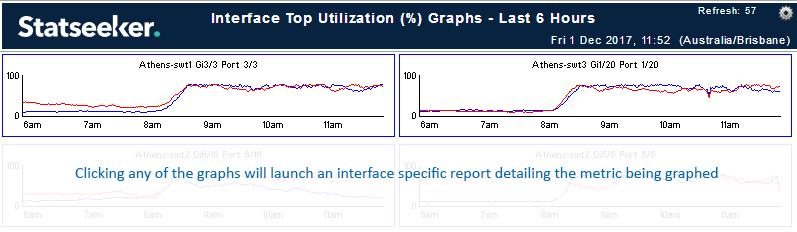
The real-time poller can be accessed from any interface metric report (Statistics, Utilization, BPS, Errors, etc., does not include events based reports such as Interface Availability). Clicking a metric value in a tabular report or a graph in a graphical report will launch an interface specific report detailing the selected metric on that interface.
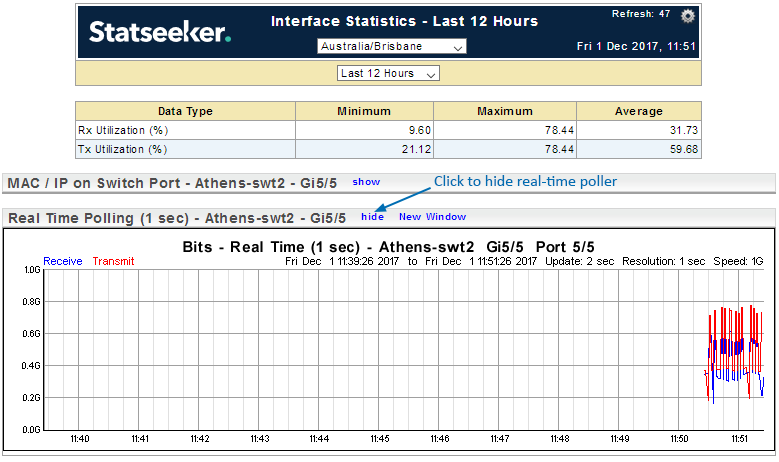
The interface centric report will contain a collapsed report row for the real-time poller, clicking the Show link will launch the poller and display the graph.
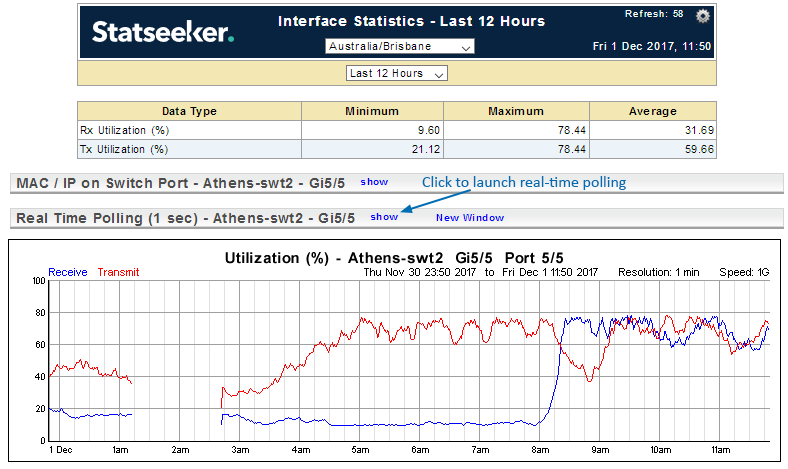
The real-time poller graph will update every second, allowing you to monitor the interface while the issue is investigated.