Index
Overview
Statseeker forecasting refers to using your data history to provide some insight into your future data; particularly useful for capacity planning. Statseeker analyzes your historical data for the metric being forecast and returns a data range for each reporting period across the forecast duration.
Forecast data can be added to both tabular and graphical reports that have been created in the Custom Reporting Console.
Adding Forecast Data to a Tabular Report
To add forecast data to a report:
- Select Console > Custom Reporting Console from the Statseeker header
- Click Edit
- Select the report you want to add forecast data to
In the example used here we have selected an interface received traffic report so that is the metric we will be retrieving forecast data on.
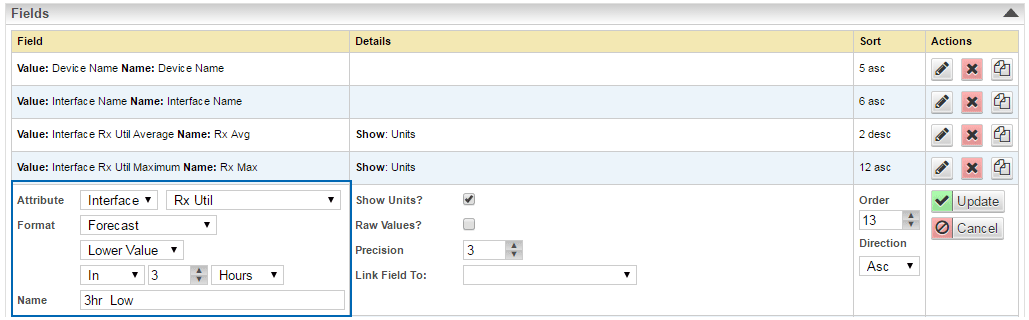
- Add a new field by selecting the desired metric, in this instance, Interface – Rx Util
- Set the Format field to Forecast
This will display additional fields under Forecast offering a drop-down list of forecast analytic options and a time frame for the forecast.
- Select a forecast analytic option
- Value – the median value in the forecast data range for that point in time
- Upper Value – the highest value in the forecast data range for that point in time
- Lower Value – the lowest value in the forecast data range for that point in time
- Daily Change – the forecast daily delta value i.e. the predicted daily change in the average value for the metric
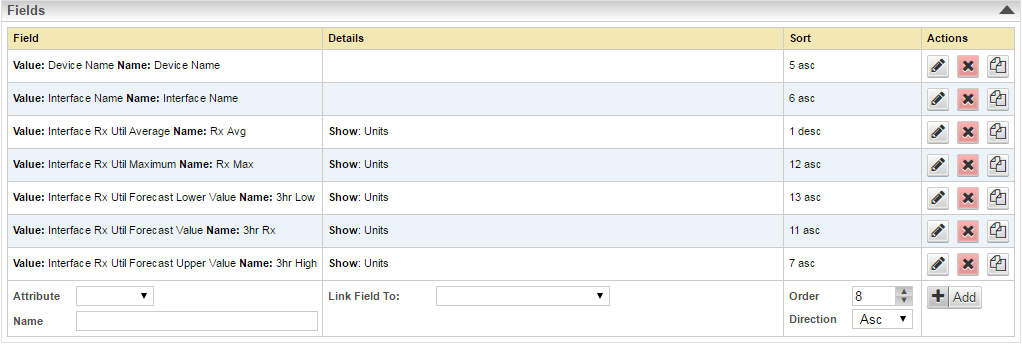
- Supply a name for the column header
- Click Add
- This process can be repeated to add additional forecast analytics as desired
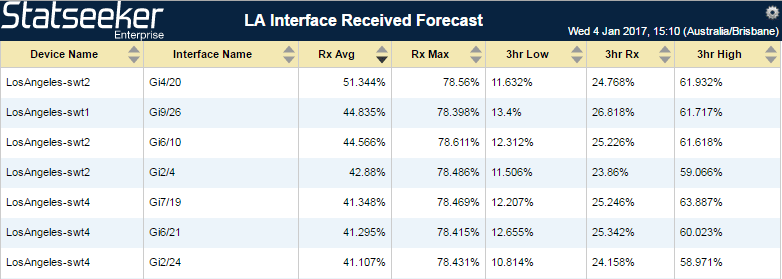
In the example below we have added fields for Lower Value, Value, and Upper Value 3 hrs into the future.
- Save the report
- Select Console > Custom Reporting Console from the Statseeker header
- Click Edit
- Select the report you want to add forecast data to
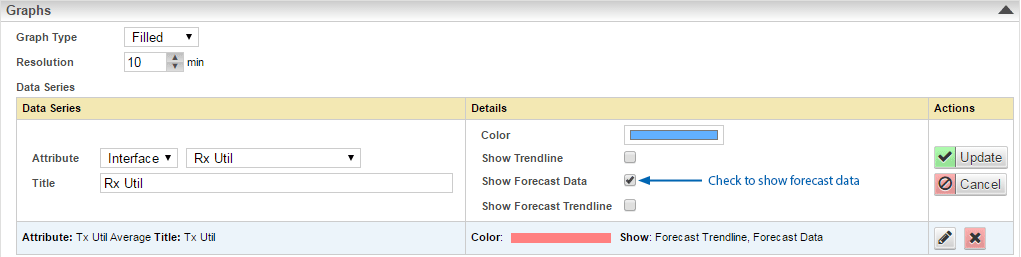
- From the Graphs section, select a metric that you want to forecast data for and click the edit button
- Check the Show Forecast Data box
- Optionally display a trendline for the forecast data by checking the Show Forecast Trendline box
- Click Update
- Repeat this process for any other metrics displayed on the graph that you also want to display forecast data for
- Click Save
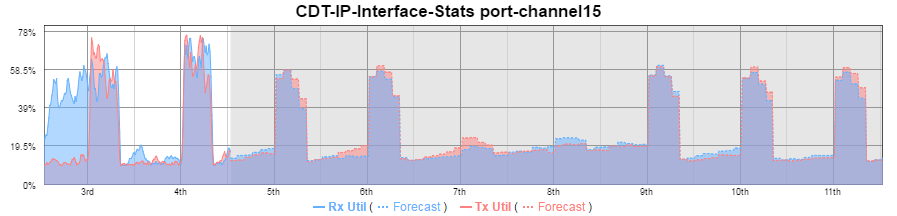
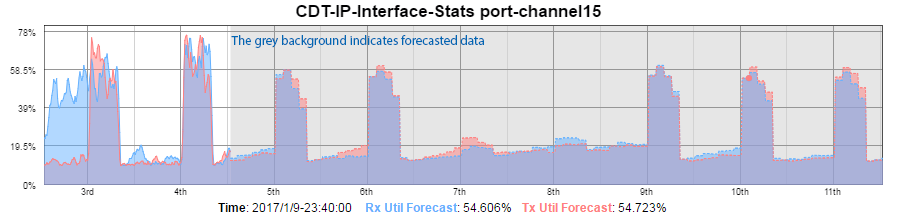
- View the report
Adding Forecast Data to a Graph
To add forecast data to a report:
In the example used here we have selected an interface traffic report.